
Personal Finance
 »» Government bonds broke their multi-week losing streak and yields fell. Sentiment shifted as concerns about imminent Federal Reserve tapering waned.
»» RBC Capital Markets anticipates the Fed will begin to gradually taper in October 2013, and complete the process by April 2014. (see table page 2)
»» Even though the recent surge in bond yields may be overdone on a short-term basis, it serves as a wake up call for investors. (page 3)
»» Global Roundup: Preview of Germany’s upcoming election. (page 4)
For the complete Weekly Report as well as Daily Updates CLICK HERE.

 The traditional meme of
 risk sellers financial advisers is to recommend that clients hold a higher component of their savings in stocks and stock mutual funds in order to sustain desired income withdrawals through retirement. In fact this math is not sound: in reality the price that we pay for securities purchased dictates everything about the sustainability of the capital and the long-term income it is able to yield.
The time to sober up is before more capital losses hit.
Read Danielle’s the whole comment HERE
How often do we hear that aforementioned catch phrase from the usual talking heads? Yet actions speak much louder than words and anyone who isn’t insisting upon absolute fiscal responsibility truly does not care about the children – Robert W
Michael Campbell Explains:
{mp3}mtjune1413lead{/mp3}

Dow Danger Chart

- Most global stock markets are struggling. Major tops take time to form, and the rollover can be subtle.
- The US market has held up quite well, until April. Now, heavy distribution volume is making an appearance.
- Note the MACD indicator. That is showing a continuous breakdown, and setting the stage for deeper declines.
Japan Stock Market Crash Chart

- Japan’s stock market looks like pint-sized towering inferno.
- Horrifically, the crash has helped build a massive head & shoulders top pattern.
- The target on this index chart is the 100 level. If it is hit, Japanese investors would be crushed, and I believe some of them would turn to gold!
TLT (T-Bond Proxy) Major Top Chart

- Most technical indicators have been warning that something is wrong with the T-bond.
- In particular, MACD could be termed a technical “train wreck”.
- Bonds have rallied strongly, for 30 years. Quantitative easing has forced yields lower and lower. From here, even a modest decline in bond prices could cause a panic in global markets.
- The US bond market has formed a substantial head & shoulders top on the weekly chart, and recently broke the neckline.
US Dollar Rounding Top Chart

- When the bond market goes down, yields go higher. That usually supports the underlying currency.
- The dollar is now falling while rates are rising. The appearance of this rounding top pattern is disturbing chart action, and suggests there is a growing loss of confidence in American fiat currency.
Gold Triangle Chart

- Gold has been a little disappointing in the last week, but a short-covering rally could quickly take gold up towards $1580.
- From there, a fall to new lows in the $1250 area can’t be ruled out, unfortunately.
- Volume will be the key in interpreting the gold market in the coming weeks.
- Patience is required. The triangle formation suggests that gold is either headed towards $1580, or down to $1200. Let’s cheer for the bulls!
GDX Sentiment Extremes Chart

- Gold stocks are hated by most investors, which is an opportunity for the long-term investors with patience.
- When investor sentiment is radically lopsided, prices can quickly move in the opposite direction, and in this case that would be to the upside.
- This chart highlights my sentiment indicator. In 2008, prices kept falling, even though sentiment reached extreme levels. Regardless, the entire $25-$40 area seems to represent good value for sentiment players.
GDX Moment Of Truth Chart

- An inverse head and shoulders bottom pattern is in play. The right shoulder is almost complete. That’s bullish, but I want to see a two day close above $32, before getting too excited.
- The upside target is $37. Volume patterns are more constructive for gold stocks than for bullion. Gold stocks could lead the metals higher, which would be a welcome change!
GDXJ Trend Line Action Chart

- My next target price for GDXJ is $16.
- The formation of the right shoulder of the inverse h&s bottom is good news, but the price is back down below a key trend line, which is a little disturbing.
- Junior gold stock investing is not for the faint of heart, and all investors can do is hope that the juniors follow the senior stocks up the chart!
Silver Chart

- From a technical stand point, MACD is acting like it wants to turn higher.
- When silver was peaking two years ago, almost nobody wanted to sell the white metal. Today, there are few buyers.
- I added physical positions this week, in my $19-$23 buy zone. Although I own more gold than silver, I think silver may surprise investors, by holding the recent lows, while gold breaks them.
Unique Introduction For Web Readers: Send me an email to alerts@superforcesignals.com and I’ll send you 3 of my next Super Force Surge Signals free of charge, as I send them to paid subscribers. Thank you!
The Super Force Proprietary SURGE index SIGNALS:
25 Super Force Buy or 25 Super Force Sell: Solid Power.
50 Super Force Buy or 50 Super Force Sell: Stronger Power.
75 Super Force Buy or 75 Super Force Sell: Maximum Power.
100 Super Force Buy or 100 Super Force
Sell: “Over the Top” Power.
Stay alert for our Super Force alerts, sent by email to subscribers, for both the daily charts on Super Force Signals at www.superforcesignals.com and for the 60 minute charts at www.superforce60.com
About Super Force Signals:
Our Super Force signals are created thru our proprietary blend of the highest quality technical analysis and many years of successful business building. We are two business owners with excellent synergy. We understand risk and reward. Our subscribers are generally successful business owners, people like yourself with speculative funds, looking for serious management of your risk and reward in the market.
Frank Johnson: Executive Editor, Macro Risk Manager.
Morris Hubbartt: Chief Market Analyst, Trading Risk Specialist.
Email:
Super Force Signals
422 Richards Street
Vancouver, BC V6B 2Z4
Canada
The financial mania climaxed as a complete bubble in 2007. Virtually, this replicated the conclusion of all of the great bubbles since the first in 1720. As with the 1929 and 1873 examples, its culmination was anticipated by the treasury yield curve reversing from inverted to steepening. In 2007 this key reversal counted out to that June and the curve reversed in that fateful May.
The features of the post-bubble contraction include severe recessions and weak recoveries. This has, indeed, been the case and the first business expansion and first bull market out of the Crash have become mature. The next cyclical decline for both could be discovered in the fall.
In which case, when will the “18-Year Bull Market in Commodities” resume its rightful course?
Another feature of the post-bubble condition has been the senior currency being chronically strong relative to most currencies and most commodities for most of the time.
We have been noting this possibility for some time and that it contrasts with central bank inflation ideology. It also contrasts with the main theme of gold commentators.
Policymakers also have a theory that implementation now becomes effective a couple of years later. This claim was difficult to discuss during the collapse of the 2007 Bubble. What policy change “caused” the collapse?
Inflation bulls remain convinced that all of the reckless “stimulus” injected into the markets since early in 2007 will eventually ignite a fabulous bull market in all commodities – particularly in precious metals.
Nowadays, as the title suggests inflation is instantaneous with policy. It is not something that is “bottled-up” and will erupt at a later date.
But, before detailing this there was a time when the possibility of inflation actually preceded a distinctive rise in the rate of inflation in consumer prices (CPI).
This writer started in the business with Canada’s premier investment dealer some 50 years ago. While working as an assistant resource analyst in 1965 CPI inflation was beginning to threaten the 2 percent level and the VP of the Bond Department was asked about this.
The measured response was that chronic and rampant inflation was only possible in lesser countries in Europe or in South America. Canada and the US had too much integrity to indulge in deliberate depreciation. What’s more, long-dated Canada bonds were trading at a 5.15% yield and would soon get back to levels below 5 percent. They reached 19 percent in 1981.
An early proponent of gold and soaring prices was James Dines who began publishing his letter in 1960. It took until the late 1960s before aggressive Fed policy began to drive prices higher. Perhaps institutional inertia contstrained the price advance due to dollar depreciation until later in the 1960s when the first “Operation Twist” was imposed. That was the US scheme to keep long rates from rising above 6 percent by buying bonds out of the market. Such rates soared to 15 percent in 1981.
To be methodical, there are particular aspects to rising prices that need review. One is due to demand pushing up price to prompt supply. This is not inflation. In the case of a relatively free market it is a very sophisticated conveyance of information.
And then there is the price rise due to currency depreciation. Interventionist policymakers believe that it causes a business expansion and vigilant gold bugs believe that currency depreciation causes inflation in commodities. Including gold which is not a commodity.
If such considerations of cause and effect were valid then prices would have soared, without interruption since the Fed opened its doors in 1914. However, there have been serious liquidity crises as over-speculation crashed. Besides that, there have been times when the Fed has been very accommodative and commodities did not go up. The lengthy bear market for the CRB that ran from 1980 until 1999 is one example and the bear that started in 1Q2011 is another. The latter is in the face of the most reckless central banking – ever.
The attached update on our “Momentum Peak Forecaster” reviews that since the late 1970s the outstanding crashes have been due to speculative surges, not to Fed conspiracies, or blunders.
Financial history provides some explanation. The classical definition of inflation has been “An inordinate expansion of credit”. This has been and still is practical as soaring prices can involve two different asset classes. Tangible assets such as commodities and real estate. And never to be overlooked – financial assets.
Inflation in tangible assets has been around ever since governments learned to depreciate coinage. Financial assets have been around since the latter part of the 1600s when there were enough companies and players to create a stock market. The potential for “modern” depreciation started with the formation of the Bank of England in 1694. It had the power to issue currency.
Even over the long span of when the BoE was disciplined by gold convertibility great speculations in tangible and then financial assets were recorded and then lamented.
So, if that has been the pattern for some 300 years it is tempting to conclude that when the current inflation in stocks and bonds completes commodities will be the next big sector.
It is not as simple as that.
In 1981 we expanded our service from mining companies to financial institutions with the concept that commodity inflation had blown out and would be followed by inflation in financial assets. That was controversial and the way it was phrased may have been perplexing. By this time the investment establishment had finally concluded that the Fed was the culprit in “inflation”.
Using history’s reliable patterns the conclusion was that the Fed would continue to accommodate but the public would choose the new game. Stocks and bonds. The line was “No matter how much the Fed prints, stocks will outperform commodities”.
This has been the feature of each “New Financial Era” until it completes in a classic bubble, much the same as in 1929, 1873, 1825, 1772 and 1720, to list all of the great bubbles.
All were followed by post-bubble contractions that lasted for around twenty years.
Within the framework of the usual 3 to 4-year business cycle there are times when no matter how much the senior central bank tries to print both tangible and financial assets go down. The crash that terminates a new financial era is very severe, and followed by weak recoveries.
The action leading to a raging mania has included speculation in some commodities and real estate. The mania in residential real estate completed in 2006 and assisted by the tout about “Peak Oil” the CRB set its big high in June 2008. As that fateful month was completing our technical research on crude identified it as a possible cyclical and secular peak. The high for crude was 147 and the high for the CRB was 473.
In 1997 we developed an indicator based upon a series related to credit spreads. When it soars up to a spike it is close to the end of a surge of speculation. We’ve called it the Momentum Peak Forecaster. It doesn’t register that often and the last signal was in April 2011. As the big action was in commodities we concluded that when speculation exhausted it would likely set a cyclical high.
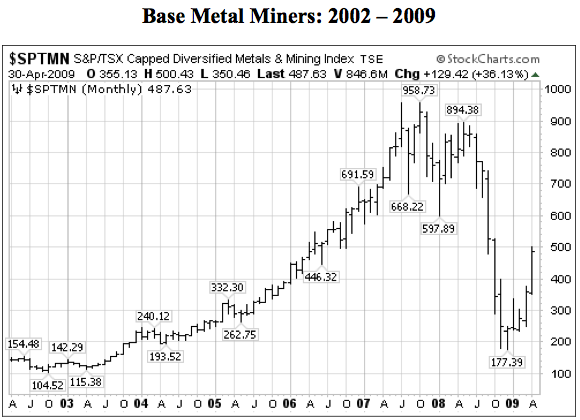
From a high of 502 in April 2011, the base metals index (GYX) set a series of lows such that the last one at 333 a few weeks ago set the bear market.
Agricultural prices (GKX) set their big high at 571 in March 2011. Even the worst drought in 50 years did not drive it to new high in 2012. That high was 533 and the index continued down to 413 in April. Taking out the 381 level set just before drought would set the cyclical bear market.
The main thing is that many commodities as well as precious metals have not been soaring “to the moon” with the most reckless central banking in history. Instead the “to the moon” action has been in financial assets.
And this is the big issue. But last week the esteemed Paul Volker expressed concern about “inflation”, meaning soaring commodities and CPI. The world is still fixed on the impractical concept of “inflation”. The practical description is that inflation is an inordinate expansion of credit.
Which makes “deflation” a credit contraction and this melancholy condition has been the feature of all post-bubble contractions.
And as with the pre-bubble world, both the private and coercive sectors need a business expansion to have credit expand. The theory that an arbitrary increase in central bank credit will “cause” a business expansion is another example of a primitive syllogism. The best-known one is that roosters crowing in the morning cause the sun to rise.
Before getting to our theme that “Inflation is Instantaneous” some additional discussion about the nature of credit is required.
Actually credit expands with business and one does not “cause” the other. However, at the end of a boom the relation between credit and prices becomes clear. Eventually, the rise in prices becomes compelling and too many become aggressively leveraged. Then Mister Margin forces liquidation of suddenly unsupportable positions. And, typically, this overwhelms arbitrary attempts to keep the boom going. Sadly, as in 2007, the establishment will insist that judicious manipulation of credit will keep the boom going, or at least, prevent a depression.
One of history’s ironies is that the esteemed editor of the The Econoomist, Walter Bagehot, provided the recipe right at the top of the 1873 Bubble. In reviewing the severity of the recessions that followed, in 1884, economists coined the term “Great Depression”. It was appropriate to the senior economy (England) and it lasted until 1895.
That was a lengthy contraction that overwhelmed the ability of the senior central bank to foster boom conditions. That was the case on the post-1929 contraction until World War II stabilized basic prices.
This fits financial history whereby, since the late 1600s, a dynamic business expansion culminates with sensational speculation in tangible assets. Following a severe recession the economy stagnates for a few business cycles when a huge speculation in financial assets erupts. That this has been accompanied by firming prices for most tangible assets including real estate is essential to the completion of a great bubble.
This was not the case with the mania in tech stocks in the Dot.Com Bubble that completed in March 2000. Action in basic commodities and real estate was minimal and one of the economists on CNBC keep touting that you had to be in the stock market “because there is no inflation”. That was a “new” discovery that expanding credit was not driving commodity inflation.
It is best to consider speculations as intense hoarding.
As history mandates, each long dynamic expansion matures with a period of inflation in tangible assets when “real” things are hoarded.
This segues into a “New Financial Era” when it becomes compelling to hoard stock and bond certificates.
In the US, the cycle for such certificates seems to have climaxed recently.
Those who have been banking upon a Fed-driven “inflation” in commodities may conclude that it is, once again, time for the action to favour commodities. The “Eighteen-Year Bull” market will resume. After all the Fed will never quit ambitious policies of dollar depreciation.
Regrettably, this is outside of the abilities of today’s central bankers. While they have always considered such a prerogative as constant, the truth is that the credit cycle permits the Fed to look good in a natural credit expansion and, then, to look hopeless and perplexed during the natural contractions.
By way of summary, the basic pattern has been to “hoard tangible assets”, get burned out. Then it is “hoard financial assets”, get burned out.
Then, and there are five previous examples since the start of modern markets and central banking, when the game changes to “hoarding cash”.
Back to our theme that “Inflation is Instantaneous”. Throughout market history Mother Nature has raised basic prices to prompt increases in supply and essentially that increase is not asset inflation. It is reasonable to conclude that the transfer of market information is instantaneous. Also, when not dislocated by arbitrary policy, this is also continuous.
Moreover, the ability of central bankers to raise prices is readily understood, now. No delays in this regard, but the ability to increase prices still depends upon the business cycle, which signals are instantaneous and continuous.
On the aspect of price increases due to deliberate depreciation it is best to consider that even with the most reckless senior central banking in history, a classic bubble developed and climaxed, as in 1929, The consequent collapse was the most severe since – the 1930s. The first business cycle out of the crash has been the weakest since the one that completed in 1937.
The instruction is clear, financial history is in a post-bubble contraction and outside of the typically weak economy, the other feature has yet to happen and that is the great bond revulsion. The world learns that in a poor economy it is virtually impossible to service the debt taken on in the raptures of a financial mania.
Naturally, the issue of debt during the frenzy that completed in 2007 was dauntingly immense. The amount issued during the vain attempt to make the contraction go away has been without precedent.
This great bond revulsion, which is becoming irresistible, could also be without precedent.
So will be the hoarding of cash, and gold is the best kind of “cash” that one can hold or find.
In real terms most commodities set an important high as a financial bubble completes. And gold in real terms sets an important low. Typically the contraction has prevailed for some twenty years and this has been accompanied by a bear market in the real price of most commodities. This translates into a long bull market for gold’s real price.
It seems that as the normal and abnormal instruments of credit contract Mother Nature works to provide real liquidity through significant increases in gold production.
Every time.
Momentum Peak Forecaster,
Updated (June 2013)
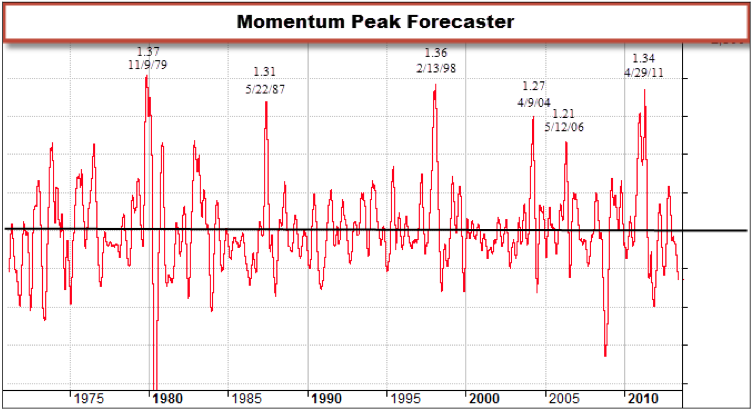
- The straight up occurs with increasing speculation.
- Rising through 1.20 indicates the action is becoming impetuous. The last peak reading was April 2011.
- In most instances the speculative frenzy peaked some 3 months later.
- That counted out to July 2011, give or take a few weeks. The “Forecaster” does not apply to major lows.

In July and August, 2006 we published a couple of articles on the Florida real estate bubble of 1926, as well as on the post-1929 real estate debacle.
On the pending discovery of another liquidity crisis, the investment demand for gold will soar.
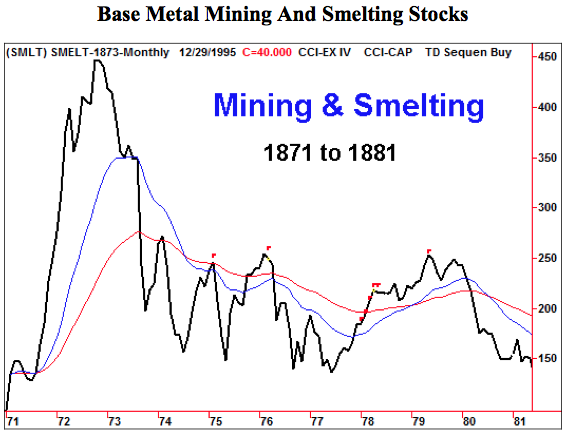
- Base metal prices boomed in the 1860s and rallied with the 1873 Bubble. Base Metal Mining & Smelting stocks were outstanding performers, as
- they were in 1929 and in 2007.
- The Index soared from 150 to over 450 in a year and a half.
- At the top of the bubble, the leading New York newspaper editorialized that nothing could go wrong. The US did not have a central bank and was not on a gold standard.
“True, some great event may prick the commercial bubble of the hour, and create convulsions; but while the Secretary of the Treasury plays the role of banker for the entire United States it is difficult to conceive of any condition of circumstances which he cannot control. Power has been centralized in him to an extent not enjoyed by the Governor of the Bank of England. He can issue the paper representatives of gold, and count it as much as the yellow metal itself. [He has] a greater influence than is possessed by all the banking institutions of New York.” – New York Herald, 1873
- In the long decline in the real price of base metals, the Index eventually declined to 20 in 1895.
- Base metal mining stocks have been outstanding performers in a number of Great Bubbles.
- We have charts on the 2007, 1929, 1873 and 1825 examples.
- The 1825 and 1929 examples have yet to be digitized, but they were straight
- up and straight down.
- Typically, gold mining and exploration companies have been outstanding performers during the lengthy post-bubble contractions.
Written by:
 BOB HOYE, INSTITUTIONAL ADVISORS
bhoye.institutionaladvisors@telus.net
WEBSITE: www.institutionaladvisors.com
Free One Month Trial
Bob Hoye, bio and other interests..
With a degree in geophysics and a number of fascinating summers in mining exploration, one winter in “the bush” quickly led Bob into the financial markets. This included experience on the trading desk and in the research department of a large investment dealer, which led to institutional stock and bond sales.
Bob’s review of financial history provided the forecasting models designed to anticipate significant trend reversals in the sometimes alarming volatility typical of the transition from rampant speculation in tangible assets to fabulous speculation in financial assets.
In anticipation of the latter opportunity, a monthly publication for financial institutions was started in January 1982. This competently covered the stock market, the yield curve, credit spreads as well as metal and energy prices.
In 1998 the Institutional Advisors website was started as a forum for unique and reliable financial research. Bob, as editor and chief financial strategist, writes the weekly overview – PIVOTAL EVENTS as well as historical essays and presentations that inform the work. Contact Bob.
Notable Interviews:
- Weekly Friday audio interviews at www.howestreet.com and www.talkdigitalnetwork.com
- The Mining Stocks PDF “Why You Should Own Gold AND Dollars” interview of Bob Hoye by J. Taylor FEB 10th 2005
- The Barron’s PDF “A Rally for the Buck?” interview of Bob and Ross Clark by Sandra Ward DEC 20th 2004
- The Financial Post interview of Bob Hoye “Market In An Awful Stew?” by William Hanley NOV 18th 2000


-
I know Mike is a very solid investor and respect his opinions very much. So if he says pay attention to this or that - I will.
~ Dale G.
-
I've started managing my own investments so view Michael's site as a one-stop shop from which to get information and perspectives.
~ Dave E.
-
Michael offers easy reading, honest, common sense information that anyone can use in a practical manner.
~ der_al.
-
A sane voice in a scrambled investment world.
~ Ed R.
Inside Edge Pro Contributors

Greg Weldon

Josef Schachter

Tyler Bollhorn

Ryan Irvine

Paul Beattie

Martin Straith

Patrick Ceresna

Mark Leibovit

James Thorne

Victor Adair