
Personal Finance


 Why we are still bullish on stocks?
“If the financial system has a defect, it is that it reflects and magnifies what we human beings are like. Money amplifies our tendency to overreact, to swing from exuberance when things are going well to deep depression when they go wrong. Booms and busts are products, at root, of our emotional volatility.” – Niall Ferguson
As we enter the second quarter of 2013, I’m writing to summarize market developments since the start of the year and to share my thoughts on positioning portfolios for the period ahead. First though, a quick recap of the first quarter of 2013…….

It may not happen next week, but it will happen. It appears that Japan is on an unstoppable path to financial Armageddon.
Disclosure: I have no positions in any stocks mentioned, and no plans to initiate any positions within the next 72 hours. I wrote this article myself, and it expresses my own opinions. I am not receiving compensation for it (other than from Seeking Alpha). I have no business relationship with any company whose stock is mentioned in this article.
Over the past 20+ years, the Japanese economy has unwound the excesses caused by a giant property and financial bubble. At the same time, the country’s aging demographics has increased social costs while the pool of taxable labor declined. Consequently, Japan has stagnated and repeatedly dipped into deflation.
This spring, the Bank of Japan (BofJ) announced insanely aggressive monetary expansion to finally break the deflationary curse by targeting a 2% inflation rate within 2 years. Unfortunately, I believe this policy move simply shortens the time until Japan meets its fate.
While many Americans see Japan as a far-away land of little concern, this is a massive oversight. Japan’s economy is the third largest in the world, Japan owns massive amounts of US Treasuries (TLT) and Japanese financial institutions are intertwined with the global market. If Greece can heat up S&P 500 (SPY) volatility (VXX) across global markets, a shock in Japan would set the global financial market ablaze.
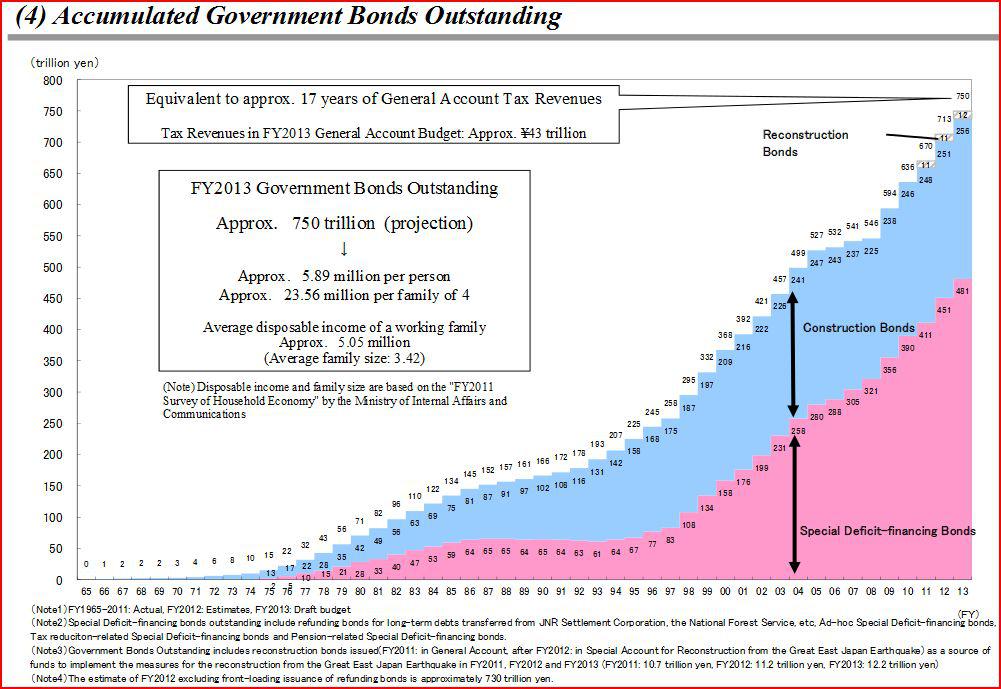
Introducing the Vicious Japanese Debt Spiral
The next few charts will help illustrate why Japan is likely trapped in a vicious debt spiral. This first chart is the most straight forward. It highlights the cumulative growth of outstanding Japanese Government Bonds. As you can see, Japanese indebtedness has risen at an increasing rate over the years.
(click & follow prompts to enlarge)
…..read & follow prompts to view much more HERE
![]() The Next Industry To Crumble. The two trillion dollar war for your living room has begun. And one side is about to make a mistake that puts investors in control.
The Next Industry To Crumble. The two trillion dollar war for your living room has begun. And one side is about to make a mistake that puts investors in control.
…..read and view more HERE
Last month, I ran through a set of figures that cover a huge concern for retirees.
It’s vitally important information that affects nearly every dollar you have invested… yet most of what you hear about this idea is “bunk.”
I’m talking about the concern that the U.S. economy is “running off the rails”… that we are in a recession… or worse, a depression.
The figures I presented showed that our economy was growing slowly, without inviting a sharp increase in inflation. Today, nothing much has changed… No surprises, just steady progress. It’s the sort of environment that leads to gains in your stock portfolio.
But how much money should you have in stocks? And after their big rise (up 14% so far this year), are they too expensive to buy?
Below is the chart that provides our answer. It displays the historical price-to-earnings (P/E) ratio of the S&P 500. The P/E ratio is one of the time-tested ways to gauge stock market valuations. You’ll note that the S&P 500’s current P/E of around 16 is near its historical average of 16-17 times.
(Click HERE to view all 4 larger images)


-
I know Mike is a very solid investor and respect his opinions very much. So if he says pay attention to this or that - I will.
~ Dale G.
-
I've started managing my own investments so view Michael's site as a one-stop shop from which to get information and perspectives.
~ Dave E.
-
Michael offers easy reading, honest, common sense information that anyone can use in a practical manner.
~ der_al.
-
A sane voice in a scrambled investment world.
~ Ed R.
Inside Edge Pro Contributors

Greg Weldon

Josef Schachter

Tyler Bollhorn

Ryan Irvine

Paul Beattie

Martin Straith

Patrick Ceresna

Mark Leibovit

James Thorne

Victor Adair