
Personal Finance
Good morning. Here’s what you need to know.
- Asian markets were up in overnight trading with theNikkei surging 2.9% after the dollar crossed the key 100 yen level. Europe is rallying, and U.S. futures are modestly higher.
- The dollar crossed the crucial ¥100 level yesterday.Today the yen weakened beyond 101 a dollar. This saw the Nikkei close up nearly 3% on Friday. The Bank of Japan’s efforts to bolster its economy by weakening its currency is already reported to be working. Click here to learn about Abenomics, the Japanese experiment that is captivating the world >
- Chinese lending totaled 792.9 billion yuan in April, beating estimates for 755 billion yuan. M2, a broader measure of money supply, increased 16.1% on the year, above expectations for a 15.5% rise. The only three indicators of Chinese monetary policy that you need to watch >
- Carl Ichan and Southeastern Asset Management, two of the largest Dell shareholders, have written to the company’s board with an alternate proposal to the buyout, according to the WSJ. This is part of Ichan and Southeastern’s effort to prevent Dell founder Michael Dell, and a private equity firm, from buying out the company.
- At 9:30 a.m. ET, Federal Reserve Chairman Ben Bernanke will give the keynote address at the Chicago Fed’s banking conference.
- A woman has been rescued from the debris of the collapsed factory in Bangladesh after 17 days. 2,500 people were rescued in the immediate aftermath of the collapse and the death toll is said to have reached over 1,000. A fire broke out at another factory in Bangladesh earlier this week.
- UK Q1 construction output fell 2.4% on a quarterly basis, to the lowest level since Q4 1998.Construction accounts for 6.8% of the UK economy, and the revision is not expected to have a major impact on GDP. The biggest economic experiment of the last five years has ended in disaster >
- The Reserve Bank of Australia expects “below trend” growth of 2.5% this year. It also cut its inflation outlook to 2% in the year to December, down from 3%.
- The Treasury Budget for April is out at 2:00 P.M. ET. Consensus is for the monthly Treasury budget to post a surplus of $107.5 billion. Follow the release at Business Insider >
- Hong Kong’s economy grew 0.2% in Q1, below expectations for a 0.5% rise. This compares with a 1.4%

When people think of their money and how it is managed, they often zoom in on one metric — how well their investments performed compared to the broader market.
But a new survey reveals that another big factor determines whether someone is satisfied with his or her investment firm: the financial advisor.
“The study finds that there are two elements beyond investment performance separating firms with high satisfaction from those with low satisfaction: the person that investors credit for their investment performance and the relationship investors have with their advisor,” said Craig Martin, director of investment services at J.D. Power & Associates, which conducted the study.
When it comes to our money, how well our investments do is out of our control — as they say, past performance is not an indicator of future results. But, who we choose to manage our money is.
 For that reason, you’ll want to search and vet all candidates carefully. Here’s how to find an advisor who is a good fit for your money needs.
How to Find the Right Candidates
Start by asking friends and family for referrals, says Minneapolis-based certified financial plannerSophia Bera and, in particular, get recommendations from people whose financial needs, outlook or stage of life is similar to yours. Before contacting planners, look them up online and on LinkedIn to get a sense of what each firm is like. Something as simple as the photos on their homepages can indicate which ones are targeting your demographic.
Also, search for a planner directly on the sites of theFinancial Planning Association and the National Association of Personal Financial Advisors. The advisors on the latter organization’s site are fee-only, meaning they will not earn commissions for selling you specific investments but simply charge you a rate, usually based on the assets you put under management. Many experts say that a fee-only advisor is preferable, to eliminate conflicts of interest and ensure he or she always acts with your best interest at heart.
But there is one case when you may not want a fee-only advisor, says Bera — and that’s if you want him or her to also help you with annuities, life insurance or disability insurance — basically, other investment vehicles besides stocks, bonds, mutual funds, etc. If so, look for a firm that has a broker-dealer. “They’ll get a commission [for selling you those products],” says Bera, “but some people want a firm that has a broker-dealer so they don’t have to go to someone else for disability or life.”
Once you’ve gotten a list of potential advisors, take one more step before setting up appointments to meet: Find out whether each has ever been disciplined for any unlawful or unethical behavior. You can do this using the Financial Industry Regulatory Authority’s (FINRA) BrokerCheck. You can also look the advisors up on the CFP Board’s site, to verify that they each have CFP certification status.
When you have your initial interview, here are the questions you want to ask:
1. How much do you charge for your services?
If you didn’t see this information on the planner’s web site, ask whether there’s an initial planning fee, whether they charge a percentage for assets under management, or whether they make money from selling you a specific product. Not only should you know how much the service will cost you, but it can help you determine whether they have an incentive to sell you things.
2. What licenses, credentials or other certifications do you have?
Of the four main types of financial advisors, the certified financial planner (CFP) designation is harder to achieve than Chartered Financial Consultant (ChFC), because the former requires a comprehensive board exam; the latter, however uses the same core curriculum. If you want someone to manage your money, then look for a registered investment advisor (RIA). If you have a high income or a small business owner, you’ll probably want a certified public account (CPA), who can offer you advance tax planning. The personal financial specialist (PSF) certification is usually obtained by CPAs who want to demonstrate they can help clients with comprehensive financial planning.
3. What services do you/does your firm provide?
Implicit in this question is also what assistance the advisor will not give you. “Some people are just investment advisors and only provide you advice on your investments,” says Bera. “Other people do comprehensive financial planning around retirement, insurance, estate planning and tax planning.” Go with someone whose offerings suit your needs.
4. What types of clients do you specialize in?
Some financial advisors have a niche, says Bera, and if you have a specific interest — such as charitable giving or socially responsible investments or if you’re a newlywed or recently divorced — you’ll want to find one that concentrates in that area too.
Edward A. Wacks, a CPA and CFP affiliated with Ameriprise Financial , says, “Most advisors tend to focus on people within 10 years of their age.” He for instance, focuses on soon-to-be retirees because he’s 61, and business owners because he has his own business. “I feel we have some commonality, and I understand their issues,” he says.
…..read 5-10 on page HERE
JIM ROGERS: PARAMOUNT ADVICE TO ALL INVESTORS
 Writing is his book Street Smarts he makes the point that:
ABOUT JIM ROGERS

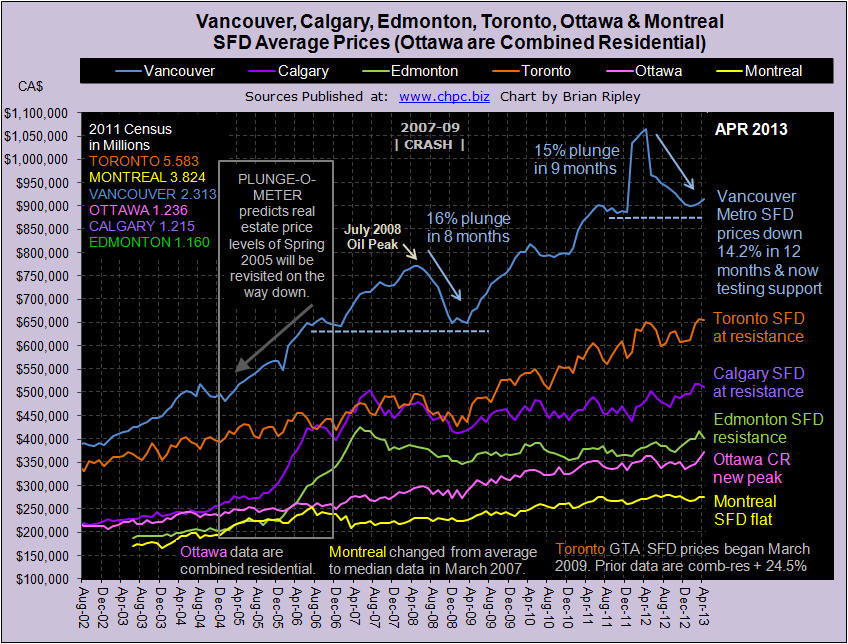
Toronto, Edmonton, and Calgary drop while Ottawa is the new real estate price breakout recipient.
VANCOUVER average single family detached prices in April 2013 ticked up again but remain 14.2% ($150,800) below their peak set last April 2012 (Vancouver Chart). On the short term, price are up fractionally, but on an annual basis, Vancouver is on a sea of red (Scorecard) with combined residential sales down 6.2% Y/Y and prices down 12.6% Y/Y with price momentum solidly negative (-14.2%) and heading towards Extreme Fear on the 12 month change chart.
Now that you have the April data, where do you think Vancouver SFD prices will be one year hence? VOTE HERE.
CALGARY average detached house, townhouse and condo prices in April 2013 have all turned down from their recent record highs, Calgary Chart). I have added the TSX Energy Index plot to the chart to see when correlations occur with housing prices. Real Estate and the energy index are labouring under multiple peaks and price momentum has taken a sharp turn down and threatens to go flat.
The sentiment in Calgary is the least bearish of the 3 markets polled with only 24% of the survey thinking Calgary SFD prices will be 20% lower in 12 months. What do you think? VOTE HERE.
EDMONTON average detached house prices in April 2013 also turned down with Calgary (Canada Chart). The bright spot was townhouse prices popping 2.8% M/M but annually they are down 0.7%. Combined residential sales although up nearly 10% M/M are down 8% for the year (Scorecard). The record high SFD prices of May 2007 are still 5.6% out of reach (Plunge-O-Meter).
TORONTO average detached house prices for the GTA in April 2013 backed off the high set last month (Toronto Chart) and Y/Y sales numbers are down over 5% for detached, townhouse and condos (Scorecard). The weakening sales are driving the market momentum into the flat line. For anyone keeping score, the gap between Vancouver and Toronto housing prices (Vancouver vs Toronto) is narrowing, especially condos and marketers should note that HNWI has fallen in love with Toronto.
Despite recent record highs, sentiment continues to suggest that prices will be down another 20% in 12 months. What do you think? VOTE HERE.
OTTAWA average detached house prices are not available, instead the chart on this site reflects Ottawa’s average combined residential prices. OREB’s report is sparse and opaque and the CMHC, records for Ottawa inventory remain one month lagging. In April 2013 Ottawa combined residential prices zoomed 3.8% M/M for a new record price high on a solid 34.8% M/M sales surge (Scorecard). Ottawa real estate is trading 2.1% above the prior peak set one year ago breaking out from a well defined 2 year channel. Follow the money.
MONTREAL median (not average) detached house prices in March 2013 (I WILL UPDATE WITH APRIL DATA WHEN IT IS RELEASED) ticked up 1.9% M/M but remain in a narrow price channel 1.6% below the all time high price set in June 2012 (Canada Chart). Prices are floating on sales resistance (Scorecard) with combined residential sales 17.3% below last year. In the 2011 Census, Montreal added 6.4% more dwelling units while only adding 5.2% more people. There is no shortage of housing, but there is a shortage of earnings; the Province of Quebec ranks 7th in Canada’s 10 provinces for earnings and shares an unemployment rate with Ontario of 7.7% in March.
Income inequality in Canada and the United States is on the rise. Read on to learn the real reason why…
The Canadian Centre for Policy Alternatives (CCPA) analysis of income inequality data shows the richest one percent of Canadians make $180,000 more today – adjusted for inflation – than they did in 1982.
The bottom 90 percent of Canadians saw income gains of only $1,700 over the same time period. In Vancouver, Toronto, and Montreal – Canada’s three largest cities – the bottom 90 percent actually make less today than they did in 1982.
Most Canadians living in these cities have seen drops in income of:
- Vancouver = $4,300
- Toronto = $1,900
- Montreal = $224
The richest one percent of Canadians in these three cities cities saw pay increases of:
- Vancouver = $189,000
- Toronto = $297,000
- Montreal = $162,000

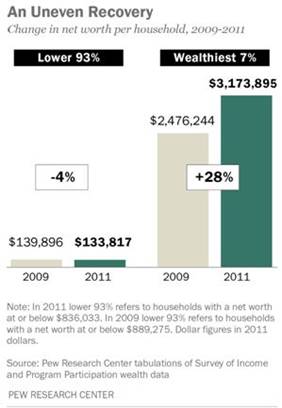 There are shocking disparities in income inequality in America…
David Cay Johnston, a Pulitzer Prize winner writing for Tax Analysts says that between 1966 and 2011, average inflation-adjusted income of the bottom 90 percent of US workers grew by just $59 while the income of the top 10 percent of workers grew by $116,071 – an astonishing, and frightening, 1,967 times the bottom 90 percent income growth rate.
The top one percent have enjoyed 81 percent of all the increased income since 2009.
The truly astonishing fact here is that it takes only $110k a year to be a top 10 percent earner in the U.S.! Getting into the top one percent is a stretch being over three times higher at $366k while joining the exclusive top .01 percent takes a whopping $8 million yearly income. In Canada, to join the top one percent club of 255,000 taxpayers, your income would have to have exceeded $200k. The threshold for the 25,475 Canadians that make up the top 0.1 percent was $685,000.00 of income.
Why such growth in income inequality?
Most would tell you, are telling you, it’s because…
Stocks and bonds are going up while the housing market remains flat. The top 10 percent have most of their wealth concentrated in stocks etc., less affluent households have their wealth in the value of their home – housing prices remain well below their 2006 peak while U.S. stock indices have all recently hit records.
Some will say falling top marginal tax rates in Canada explain part of the wealth disparity and income rise for the richest one per cent in that country.
A few will point out that the increase in inequality, in both countries, can also be attributed toinstitutional forces:
- Declines in unionization rates
- Stagnating minimum wage rates
- Deregulation
- National policies that favor the wealthy
All the reasons above show why the bottom 90 percent are getting poorer or at best have stagnating incomes but at best they explain only partially why the income gap is widening.
Consider what Stephen McNamee and Robert Miller, authors of The Meritocracy Myth have to say:
- 20% of American households receive 50% of all available income
- The lowest 20% of households receive less than 4%
- The top 5% of households receive 22% of all available income
- The richest 1% of households account for 30% of all available net worth
- Economic inequality in the U.S. is the highest among all industrial countries
The Wall Street Journal reported the top .01 percent (14,000 American families) hold 22.2 percent of wealth, and the bottom 90 percent (133 million families), just 4 percent of the nation’s wealth.
In 1980 the richest one percent of America took home 1 of every 15 income dollars. Now they take home 3 of every 15 income dollars. Over the last 30 odd years the share going to the richest 0.01 per cent quadrupled, from one percent to almost five percent.
Why are the rich getting so much richer? It’s obviously more of a long term trend then something that just recently started to happen, what’s going on?

Executive Compensation: A New View from a Long-Term Perspective, 1936–2005
Carola Frydman, M.I.T. Sloan School of Management and NBER, Raven E. Saks Federal Reserve Board of Governors
Lavish Compensation
The super affluent have historically relied mostly on unearned income from financial assets, stocks and bonds etc., but for the last three decades that income has slowly taken a backseat to the compensation they are paid.
Canadian Centre for Policy Alternatives researcher Armine Yalnizyan found
“the income of the richest 1 per cent is due mostly to the lavish sums they are paid for the work they do.”
Paul Krugman, winner of the 2008 Nobel Prize in Economics says asset ownership by the super-rich “Is no longer the main source of elite status. These days even multimillionaires get most of their income in the form of paid compensation for their labor…Needless to say we’re not talking about wage slaves toiling for an hourly rate. If the quintessential high-income American circa 1905was an industrial baron who owned factories, his counterpart a hundred years later is a top executive, lavishly rewarded for his labors with bonuses and stock options. Even at the very top, the highest 0.01 percent of the population—the richest one in ten thousand—almost half of income comes in the form of compensation.”
USA Today’s 2012 CEO’s Compensation analysis focused on 170 S&P 500 companies that filed proxies since Jan. 1, 2013, and were processed by March 22.
The median amount CEOs took home in 2012, including cash bonuses and stock and options awarded in previous years that vested or were cashed in, was $10.2 million.
Pay and total compensation numbers listed in USA Today’s report are incredible, here’s just four of the many:
Miles White, Abbott Labs, $19 million
David Pyott, Allergan, $19.4 million
Kenneth Chenault, American Express, $28 million
Randall Stephenson, AT&T, $21 million

Conclusion
It would seem the rich, in both Canada and the U.S., are getting richer while everyone else is getting poorer.
“Only twice before over the last century has 5 percent of the national income gone to families in the upper one-one-hundredth of a percent of the income distribution…Such concentration at the very top occurred in 1915 and 1916, as the Gilded Age was ending, and again briefly in the late 1920s, before the stock market crash…The great fortunes today are largely a result of the long bull market in stocks, Mr. Volcker said. Without rising stock prices, stock options would not have become a major source of riches for financiers and chief executives. Stock prices rise for a lot of reasons, Mr. Volcker said, including ones that have nothing to do with the actions of these people. The market did not go up because businessmen got so much smarter.” Louis Uchitelle, The Richest of the Rich, Proud of a New Gilded Age
The truth of, and the consequences from, such lopsided income inequality and wealth disparity should be on all our radar screens. Is it on yours?
If not, it should be.
Richard (Rick) Mills
Richard is the owner of Aheadoftheherd.com and invests in the junior resource/bio-tech sectors. His articles have been published on over 400 websites, including:
WallStreetJournal, USAToday, NationalPost, Lewrockwell, MontrealGazette, VancouverSun, CBSnews, HuffingtonPost, Londonthenews, Wealthwire, CalgaryHerald, Forbes, Dallasnews, SGTreport, Vantagewire, Indiatimes, ninemsn, ibtimes, businessweek.com and the Association of Mining Analysts.
If you’re interested in learning more about the junior resource and bio-med sectors, and quality individual company’s within these sectors, please come and visit us atwww.aheadoftheherd.com
***
Legal Notice / Disclaimer
This document is not and should not be construed as an offer to sell or the solicitation of an offer to purchase or subscribe for any investment.
Richard Mills has based this document on information obtained from sources he believes to be reliable but which has not been independently verified.
Richard Mills makes no guarantee, representation or warranty and accepts no responsibility or liability as to its accuracy or completeness. Expressions of opinion are those of Richard Mills only and are subject to change without notice. Richard Mills assumes no warranty, liability or guarantee for the current relevance, correctness or completeness of any information provided within this Report and will not be held liable for the consequence of reliance upon any opinion or statement contained herein or any omission.
Furthermore, I, Richard Mills, assume no liability for any direct or indirect loss or damage or, in particular, for lost profit, which you may incur as a result of the use and existence of the information provided within this Report.

-
I know Mike is a very solid investor and respect his opinions very much. So if he says pay attention to this or that - I will.
~ Dale G.
-
I've started managing my own investments so view Michael's site as a one-stop shop from which to get information and perspectives.
~ Dave E.
-
Michael offers easy reading, honest, common sense information that anyone can use in a practical manner.
~ der_al.
-
A sane voice in a scrambled investment world.
~ Ed R.
Inside Edge Pro Contributors

Greg Weldon

Josef Schachter

Tyler Bollhorn

Ryan Irvine

Paul Beattie

Martin Straith

Patrick Ceresna

Mark Leibovit

James Thorne

Victor Adair