Personal Finance

Real Estate beats Gold as #1 Investment & Euro Yen Recap

The Gallup Poll is out surveying the investment sentiment of American investors. Gold has held that top slot up until now. Gold has now fallen for the first time to the second position as investors return to the old historical investment sector – real estate. Even in Europe people are starting to move toward real estate as we should see a bounce into 2015. The surge in gold coin sales has not proven to be new investors, but those already in the market bargain hunting. Any surge bringing in new investors will need to wait for the next rally.

So far everything appears on track with volatility rising making counter trend reactions strong yet going nowhere as in the yen and euro. In the Euro for example, the Weekly Bullish is in the 13900 zone which is far from the recent low reflecting the amount of volatility within the system.

jy0501-d

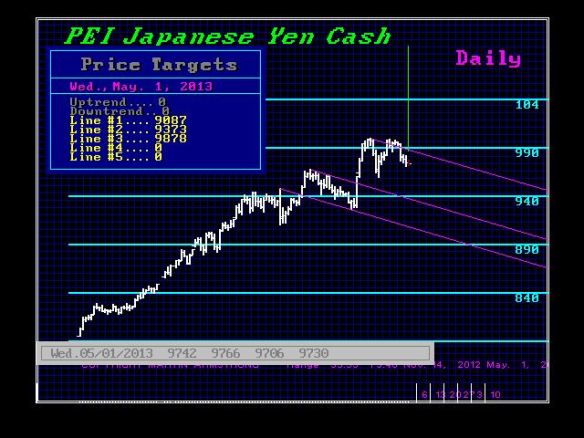
The Japanese yen declined and the dollar made an effective double top at the 99.93 level. This is a big psychological area being par 100. Japanese institutions took profits selling foreign assets since it was the first 20% profit they have seen in 23 years. Nonetheless, only a daily closing BELOW 92.75 would suggest some follow-through. Here we will see most likely a 3rd test of the 100 level, and it may be the 4th time that we plow through it. The highest monthly closing has been 97.40 on the cash. A monthly closing above 97.76 will signal we are starting to breakout, Technical support begins at mid 9300 area with the critical intraday support at the 9000 level. This double top formation is important for it will show the dollar rally that will put the most pressure on the entire global economic system and eventually force the US economy into recession starting 2015.75.

The best trading strategy under these conditions is to sell highs in the Euro according to time against reversals where the risk is the least. In the yen, buy the dollar against support below or on the breakout when that unfolds. Both the euro and the yen are reflecting that we are indeed in a bull market for volatility and when everything turns again with 2015.75 on the ECM, the volatility will be twice as high as what we experienced between 2007-2009. That is where we can see the next phase transition in gold. Don’t forget, gold has yet to test the 1980 high adjusted for inflation which standards at about $2300 level. So forget the hype. Gold has NOT broken out yet nor has it truly made new highs in REAL terms – only nominal.

http://www.mining.com/gold-on-top-no-longer-investors-have-a-new-darling-25556/?utm_source=digest-en-mining-130501&utm_medium=email&utm_campaign=digest


Global Insights – May 1st

Kevin Konar

»» Commodities and commodity stocks bounced back, and equities rallied—  a reversal of the previous week.

»»  With lackluster economic data and few signs of impending improvement,
why have many equity markets remained close to their recent highs? (page 2)

»» Up Next: The Fed and ECB. (page 3)

»» Global Roundup: Overview of U.S. corporate bond issuance, analysis of U.K.
GDP and European earnings, and highlights of Chinese and Japanese data. (page 3 & 4)

For the complete report as well as Daily Updates CLICK HERE.

Median US Single Family Home Price Divided by Gold

For some perspective on the single-family home market, today’s chart presents the median single-family home price divided by the price of one ounce of gold. This results in the home / gold ratio or the cost of the median single-family home in ounces of gold. For example, it currently takes a relatively low 116 ounces of gold to buy the median single-family home. This is dramatically less than the 601 ounces it took back in 2001. When priced in gold, the median single-family home is down 74% from its 2001 peak. Since making new 32 year lows last year, home prices (priced in that other global currency — gold) have worked their way higher. In fact, the median single-family home priced in gold has just broken above its eight-year, downward sloping trend channel.

Notes:
Does the real estate rally continue? The answer may surprise you. Find out now with the exclusive & highly regarded charts of Chart of the Day Plus.

20130501

Quote of the Day
“There is nothing permanent except change.” – Heraclitus

Events of the Day
May 01, 2013 – May Day
May 04, 2013 – Kentucky Derby
May 05, 2013 – Cinco de Mayo (Mexico)
May 07, 2013 – National Teacher Day
May 12, 2013 – Mother’s Day

Stocks of the Day
— Find out which stocks investors are focused on with the most active stocks today.
— Which stocks are making big money? Find out with the biggest stock gainers today.
— What are the largest companies? Find out with the largest companies by market cap.
— Which stocks are the biggest dividend payers? Find out with the highest dividend paying stocks.
— You can also quickly review the performance, dividend yield and market capitalization for each of the Dow Jones Industrial Average Companies as well as for each of the S&P 500 Companies.

Mailing List Info
Chart of the Day is FREE to anyone who subscribes.
To ensure email delivery of Chart of the Day, add mailinglist@chartoftheday.com to your whitelist.

— To subscribe, enter your email address HERE
— To unsubscribe, simply fill in our unsubscribe form.
— To change your email address, first subscribe with your new email address and then unsubscribe your old email address (as described above).


Chart of the Day is provided to subscribers without warranty of any kind and accepts no responsibility for its accuracy or for any consequences of its use.


Faber – OBAMA is a Disaster “TOTAL COLLAPSE IN CONFIDENCE IN THE SYSTEM “

“The Uncertainty is Much Higher Than in The Past”

Marc Faber: He see’s stocks falling at least by 20%. Says the he believes Obama is a disaster for business and the United States as a whole. . – in Bloomberg TV:
 

The Uncertainty is much Higher than in the Past

Marc Faber : I can say one thing that today the uncertainty is much higher than in the past. We continue to have central banks running the expansionary policies in terms of fiscal and monetary stimulation, which has led to the asset price inflation. This creates very high uncertainty because you do not know how much more money will be printed in the US. Uncertainty arises because of these reasons. The interventionists want to stimulate the economies by manipulating the markets, particularly interest rates. They are creating higher economic and financial volatility than in the past. – in rediff

Marc Faber : We may have a total Collapse in Confidence in the System


Marc Faber : “The next crisis could lead to a deflationary bust. And a bust in governments. In other words, we may have a total collapse in confidence in the system.” – in a recent interview with cnbc
 

Marc Faber : Central Banks are Buying Bonds to Manipulate asset Markets and bring Interest Rates down


Marc Faber : Central banks are buying bonds to manipulate asset markets and bring interest rates down. Essentially the quantitative easing policy is supposed to be independent. Actually, it’s closely related to fiscal policy. In a sense, these programmes and the monetisation are designed to purchase government bonds. Indirectly, these central banks, which have large fiscal deficit, are monetising the deficits and piling up more debts. With these measures, they are postponing the problems rather than curbing them. In this process, the debt levels will only go up and certainly the sovereign rating of the US debt will come down at some point in time. – in rediff


Marc Faber’s Short Biography

Marc Faber is a Swiss investor. Faber is publisher of the Gloom Boom & Doom Report newsletter and is the director of Marc Faber Ltd which acts as an investment advisor and fund manager. His blog is updated Daily and can be found at http://www.marcfaberchannel.blogspot.ca/


Screen shot 2013-04-30 at 3.35.46 PM


Zebras?

JeffSaut2The call for this weekThis week will see a large 29 different economic indicators released with the most important being the ADP employment report, initial unemployment claims, the monthly non-farm payrolls report, the Chicago PMI, the ISM Manufacturing report, and the ISM Services report. Such a deluge of economic data within a one-week time period is fairly rare, so buckle up. All such reports can be market moving, but so far the bears, rubbing their collective hands together with glee over the fiscal cliff, sequestration, the continuing resolution, the debt ceiling, etc., have been totally w-r-o-n-g. I feel sorry for the bears waiting for the “crash” they have been expecting for the past four years all to no avail. It looks to me as if the stock market will continue its move irregularly higher until we get indications that something is irrevocably wrong. So far, nothing in the stock market’s internal structure has told us to be anything more than cautious, but NOT bearish.

CLICK HERE to read more…..