
Personal Finance
 I hate reading junk postings so let me start by saying that if you’re not interested in finding out the techniques that Tyler Bollhorn used in September to make money on 90% of his trades or finding out how you can literally take 15 minutes a month to significantly improve your investment results then don’t read another word – and please forgive the interruption.
 - A two month subscription to his daily newsletter and trade alert, normally a $118 cost, (for new subscribers only)
- PLUS a two months Stockscores Advanced membership, regularly a $58 cost, (again for new Stockscores members only).
- PLUS I am working one other special bonus for attendees that I’ll tell you about at the event.


PERSPECTIVE
As the saying goes, this is being written while at sea. Can’t help but think of Rod Stewart’s”Sailing”, but the Atlantic is quiet today and the sun is shining – making it rather nice for walking round the deck. Three times around amounts to a little more than a mile.
(Ed Note: Bob’s take on Stocks, Interest Rates, Commodities & his Wrap below)
Last week’s theme was that high level thinking in the orthodox seems to be changing. Some academics are calling our post-bubble contraction as the “Bernanke Depression”, which is appropriate. In the “cause and effect” world of orthodox thinking the financial agent “on watch” gets the credit for a natural boom and those on duty during a natural depression get the blame.
In the 1920s Treasury Secretary Mellon was celebrated as the greatest “since Alexander Hamilton” and was condemned during the bust. The next to be celebrated was Robert Rubin, who headed the treasury during the “Dot-com Mania”. And what did he and his sidekick Summers do deserve the accolade. They added fuelish amounts of gasoline to a financial conflagration.
Of course it the same thing can be said about Bernanke, but global assets have been deflating since the 2007 Bubble completed.
The other aspect of change is that some involved in policymaking have been uttering some commonsense about insane Fed ambition. Prudent people, such as Charles Prosser who heads up the Philadelphia Fed said as much a week ago. We invite readers to send in the examples they see. We will keep a tally.
Then you have the “Incurables” such as Paul Krugman who has been non-stop in calling for even greater central bank recklessness. Krugman’s error has been the popular notion that the Fed is THE perfect policy instrument. In certain circles this has been popular since the Fed opened its doors in January 1914, and the record has been a series of boom and busts. The most interesting of which have been the great financial manias, such as climaxed in 1929 and 2007.
This fascinating because each set of interventionists believed they were “charting new waters”, when they were replicating old bubble behaviour. Including the boast from previous bubble that “nothing can go wrong”. In 1873 it was that the US did not have a central bank and was not on a gold standard. Then in 1929 the agency that would prevent bad things from happening was the “new” Federal Reserve System. What’s more, it would keep the good times rolling.
Why?
Because the previously celebrated agency – the Treasury System – was gone. It had been the cause of so much financial distress and economic malaise.
Actually this melancholy condition is the feature of every post-bubble contraction. With the “new” Fed this would be impossible.
In fulfilling the record of financial history, 2007 clocked the main features of the conclusion of a classic bubble. At the time, the abilities of existing agencies where boasted as being proof against bad things. And then to use the establishment’s own descriptions, the worst recession since the 1930s followed. This was followed by the weakest recovery – since the 1930s.
Despite massive attempts at “stimulus” the first recovery out of a classic crash was weak. Even worse it is now being more widely seen as ending.
If history continues to guide, sometime soon, the establishment should begin to condemn the “old and disastrous” Federal Reserve System. This would be followed by a tout about a more perfect agency that really will be designed to prevent bad things.
During the initial and shocking crisis the media was full of stories that a bigger Fed would have prevented the problem. That doesn’t count, what will be needed is the tout about a new and different agency.
Time will tell.
STOCK MARKETS
Stock markets rallied as Romney came out on top after the debate. However, the action remains in a topping pattern following impressive momentum and sentiment readings accomplished around September 14th.
The following chart shows the interaction between the S&P and the VIX. Key negative divergences are detailed along with important stock market highs.
On this model all that is needed for completion is that the VIX rally above 15.5. This would be a “sell” signal.
The VIX is now at 14.3.
CREDIT MARKETS
Not much change over the past week. After a magnificent rush of narrowing, junk vs treasuries widened significantly and have paused late in the week. A test of the “high” would confirm a reversal to widening spreads.
A slowing global economy will impair the ability of corporations to service debt obligations.
While junk has bounced a little, long treasuries have declined in price a little. The former is working on a top and the latter are stair-stepping down.
For the shorter maturities there has been some volatility in the Ted-Spread. With narrowing that ran “forever” – well since the end of the dislocations that ended late last year – the action reached a very oversold on the weekly RSI.
The degree of oversold suggest this week’s volatility could be setting up a trend change. And any change in the curve along with change in spreads would be critical.
COMMODITIES
Most commodities have rebounded from the slide that began around September 14. The CRB declined from 321 to 302 and this week made it to 311. Although tied to the “good news” about the advance in Romney’s campaign, it should be considered as a normal test of the high.
Within this Ag prices (GKX) have been stair-stepping down.
WRAP
This is being written on board the Queen Mary 2 on the way to Southampton and the internet hook up has been irregular. So this edition has taken a couple of days to get this far. Ross will be able to update the Gold and Silver sector as opportunities arrive.
We are in the mid-Atlantic enjoying an interesting ride. Sunny and cloudy day with a Force 9 wind blowing, which is described as a “strong gale” with “very rough” seas. The wave height ranges from 14 to 18 feet. Sometimes the spray reaches Deck 8 which has the wooden surface that has been so nice to walk around. Three laps amounts to a little over a mile. With the “tunes” on the walk has been enjoyable, but there is too much spray today. This deck seems to be about 30 feet above the ocean. Considering the thought processes of the liberal-left, this could be considered as “proof” of rising sea levels.
The library is very nicely appointed, with comfortable arm chairs looking out over the bow.There is also an exercise room – offset by a number of bars and dining rooms.
By unusual circumstance, Lois and I “dined” with the captain last evening. One has to be booked into a high-end suite to dine at the captain’s table. We had found a nice table next to the window and were enjoying a pleasant Shiraz-Viognier. Then along came the captain (in a very smart uniform) and his wife who sat at the table next to us. We had an interesting conversation, but brief as the storm was increasing and he was returning to the bridge. Probably for the night.
Better get this finished while we still have sat hook up.

INSTITUTIONAL ADVISORS
TUESDAY, OCTOBER 16, 2012
BOB HOYE
PUBLISHED BY INSTITUTIONAL ADVISORS
The following is part of Pivotal Events that was
published for our subscribers October 5, 2012.
SIGNS OF THE TIMES
“German business confidence unexpectedly fell to the lowest in two and a half years.”
– Bloomberg, September 24
“Consumers and countries continued to pull money out of banks in Spain.”
– Dow Jones, September 26
* * * * *
BOB HOYE, INSTITUTIONAL ADVISORS
E-MAIL bhoye.institutionaladvisors@telus.net
WEBSITE: www.institutionaladvisors.com
The world’s major economies are struggling and their private-sector is deleveraging (paying off debt). If history is any guide, this deflationary process is likely to continue for several years.
You will recall that heading into the global financial crisis, corporations and households in the developed world were leveraged to the hilt. During the pre-crisis era, debt was considered a birth right and for decades, the private-sector leveraged its balance-sheet. Unfortunately, when the US housing market peaked and Lehman went bust, asset values plummeted but the liabilities remain unchanged. Thus, for the first time in their lives, people in the developed world experienced the wrath of excessive leverage.
Today, the private-sector in the West is struggling and for the vast majority of households, their liabilities now exceed their assets. Furthermore, incomes have also declined (or vanished), thereby making the debt servicing even more difficult. Consequently, in order to avoid bankruptcy, the private-sector in the developed world is now trying its best to reduce its debt overhang. Instead of getting excited by near-zero interest rates and taking on even more debt, it is now doing the unthinkable and paying off its liabilities.
Figure 1 shows that despite the Federal Reserve’s carrot of almost free credit, the private-sector in the US is deleveraging. As you can see, since the bursting of the housing bubble, America’s companies and households have been accumulating large surpluses. Make no mistake, it is this deleveraging which is responsible for the sluggish economic activity in much of the developed world. Furthermore, this urge to repay debt is the real reason why monetary policy in the West has become ineffective.
Figure 1: America’s private-sector is not playing Mr. Bernanke’s game

Source: Nomura
If you review data, you will note that in addition to the US, most nations in Western Europe are also deleveraging and this explains why the continent’s economy is on its knees.
The truth is that such periods of deleveraging continue for several years and when the private-sector decides to repay debt, interest rates remain subdued and monetary policy becomes ineffective. Remember, during a normal business cycle, monetary easing succeeds in igniting another wave of leverage. However, when the private-sector is already leveraged to the hilt and it is dealing with negative equity, low interest rates fail to kick start another credit binge.
As much as Mr. Bernanke would like to ignore this reality, it is clear to us that this is where the developed world stands today. Furthermore, this ongoing deleveraging is the primary reason why the Federal Reserve’s stimulus has failed to increase America’s money supply or unleash high inflation. Figure 2 shows that over the past 4 years, the US monetary base has grown exponentially, yet this has not translated into money supply or loan growth.
Figure 2: Liquidity injections have failed to increase US money supply

Source: Nomura
At this stage, it is difficult to forecast when the ongoing deleveraging will end. However, we suspect that the private-sector may continue to pay off debt for at least another 4-5 years. In our view, unless the US housing market improves and real-estate prices rise significantly, American households will not be lured by record-low borrowing costs. Furthermore, given the fact that tens of millions of baby boomers are approaching retirement age, we believe that the ongoing deleveraging will not end anytime soon. Due to this rare aversion to debt, interest rates in the West will probably remain low for several years.
It is noteworthy that interest rates are established by the supply and demand for credit. When business activity is booming and demand for credit is strong, interest rates tend to rise. Conversely, when business activity is muted and demand for new loans is weak, interest rates tend to decline.
In this respect, Japan’s post-bubble experience shows that despite a massive explosion in its government debt, the island nation’s interest rates have continued to fall for over 20 years! Interestingly, Japan’s ongoing experience is consistent with America’s own prior episode of deleveraging which took place after the Great Depression.
Figure 3 confirms that in the aftermath of the 1929 crash, US bond yields remained suppressed for nearly two decades and only normalised after 30 years! Turning to the present situation, short term interest rates in the US are near zero and long term interest rates are at historic lows. For sure, the Federal Reserve is partly responsible for this suppression, but we are of the opinion that the ongoing deleveraging is the chief culprit.
Figure 3: US interest rates in the aftermath of the Great Depression
Source: FRB, Banking and Monetary Statistics
It is our contention that as long as demand for credit remains weak, business activity will not pick up. Furthermore, unless the central banks start sending out cheques to every household, inflationary expectations in the West will probably remain in check.
Today, some of the world’s most prominent central banks are engaged in quantitative easing and Mr. Bernanke has now embarked on an open-ended monthly ‘stimulus’. However, despite such blatant monetary debasement, it is interesting to note that US Treasury yields are staying near historic lows and the prices of precious metals are not going through the roof.
These developments clearly show that investors are not particularly worried about future inflation and they are still allocating capital to ‘safe haven’ assets such as German Bunds and US Treasury securities.
Figure 4 shows that despite various ‘stimulus’ programs, interest rates in many prominent economies are near historic lows. Moreover, it is interesting to note that contrary to the consensus view, interest rates have in fact fallen over the past 4 years!
Figure 4: Global bond yields turning Japanese?
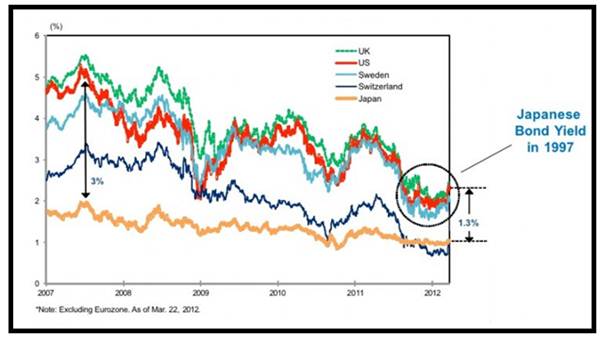
Source: Nomura
When it comes to investing, nothing is set in stone. Nonetheless, we expect long term interest rates to remain exceptionally low for several years. For instance, if Japan’s post-bubble experience is any guide, then it is conceivable that interest rates may remain around current levels for another decade or longer.
Bearing in mind the fact that the private-sector in the West is refusing to take on more debt, the world’s economy is likely to remain sluggish for several years. Under this scenario, interest rates may remain low for an extended period of time and investment returns are likely to remain muted. Furthermore, in this age of deleveraging, we believe that the former high-flying (export dependent) economies could really undergo extreme volatility. Last but not least, in this type of low growth environment, cyclical industries and industrial commodities are likely to disappoint investors.
Turning to the world’s largest economy, it is encouraging to note that its housing market seems to be bottoming out. Amidst all the doom and gloom, at least this is one bright spot and a sustainable recovery in this sector will surely improve consumer sentiment. At this stage, there is no way to know whether America’s housing has already hit rock bottom, but the recent uptick in housing starts and permits are positive signs.
Over the long run, income and household formation determine the state of every real estate market. Generally, property prices rise in line with household incomes.
During a real estate boom, both valuations (price to income ratio) and new construction rise above their historic trend. Furthermore, the availability of cheap credit and relaxed lending standards fuel the euphoria and rising prices generate a herd mentality. During the final phase of a real estate boom, property becomes a national obsession and people delude themselves into believing that ‘this time is different’. After several years of rising home prices, the participants become convinced that their market is somehow special, therefore not subject to the laws of economics. Interestingly, such misplaced optimism is almost always accompanied by the usual misconceptions (land is scarce, home supply is limited, central banks cannot print houses, affordability does not matter etc.)
Unfortunately, no real estate boom lasts forever and the quality of the hangover is alwaysproportionate to the extent of the indulgence i.e. the bigger the boom, the bigger the bust.
After the boom has turned into a bust, the opposite occurs during the downturn. Both, valuations and new construction fall below their historic trend. Furthermore, credit becomes scarce, property transactions evaporate and there is a buildup of unsold inventory. Last but not least, optimism and euphoria are replaced by outright despair.
Whether you agree with it or not, mean reversion is the most reliable feature for any real estate market. Although real estate is one of the most cyclical assets (prone to extremebooms and busts), the property cycle is lengthy in duration and quite difficult to read. For instance, most market participants are unable to tell where they are in any given cycle.
In terms of the US real estate market, history has shown that its gyrations follow a somewhat regular pattern. In fact, between 1960 and 1990, real US home prices peaked every 10 years (in 1969, 1979 and 1989). Thereafter, a long 17-year interval occurred before the next top in 2006 and it appears as though Mr. Greenspan’s easy money policy extended the most recent real estate cycle.
Today, inflation adjusted real estate prices in the US are well below trend and mass euphoria has been replaced by abject despair. Thus, it is conceivable that America’s housing market is now bottoming out and getting ready for the next upswing which may last for at least 10 years.
It is notable that after topping out in 2006, America’s real estate prices declined by approximately 34% over the following 6 years. However, over the past couple of months, prices have rebounded sharply in some of the hardest hit regions and now it will be most interesting to see whether this nascent recovery can be sustained.
Puru Saxena publishes Money Matters, a monthly economic report, which highlights extraordinary investment opportunities in all major markets. In addition to the monthly report, subscribers also receive “Weekly Updates” covering the recent market action. Money Matters is available by subscription from www.purusaxena.com.
Puru Saxena is the founder of Puru Saxena Wealth Management, his Hong Kong based firm which manages investment portfolios for individuals and corporate clients. He is a highly showcased investment manager and a regular guest on CNN, BBC World, CNBC, Bloomberg, NDTV and various radio programs.
Puru Saxena Website – www.purusaxena.com
Head Office
Puru Saxena Limited
Suite 1301, Tower One
Lippo Centre
89 Queensway
Hong Kong
Phone: (852) 3589 6789
Fax: (852) 3585 5665
contact@purusaxena.com


Ed Note: How long can Canada, Vancouver in particular, cruise along as the only Western City/Country cruising along untouched by housing contraction/crash. After a huge bubble caused by inane fiscal policies and the oceans of cheap money, the Netherlands are experiencing a great big housing bust (look at some of the percentages below).
It is surprising that there has been very little coverage of this crash in the media, then again most big media are fans of the policies poured in that got the 5th largest economy in the eurozone into this great big mess. There are some good clips & full article links below though, discovered by Mike Shedlock. There is one from Canada Oct 4th/2012: Canada may dodge housing hard landing, Flaherty says
Dutch Housing Prices Tumble
The Wall Street Journal reports Dutch Housing Prices Tumble
The slump in the Dutch housing market deepened in July as prices posted the steepest drop on record, highlighting the challenges facing the Netherlands ahead of next month’s general elections.
With prices now plumbing levels last seen in 2004, the downturn is weighing heavily on household consumption and has raised concern about the country’s huge mortgage debt pile, among the largest in Europe
House prices fell 8% from a year earlier, statistics bureau CBS said Tuesday, the largest decline in the 17-year history of the agency’s house-price index. Prices fell 4.4% in June and 5.5% in May.
Record Price Drop
Similarly, Bloomberg reports Netherlands House Prices Dropped the Most on Record Last Month
House prices in the Netherlands, the fifth-biggest economy in the euro area, dropped in July by the most since the index started in 1995.
Prices declined 8 percent from the same month a year earlier, after falling 4.4 percent in June, national statistics agency CBS in The Hague said on its website today. Values have fallen 15 percent from a peak in 2008 and are back to about the same level as eight years ago, CBS said. Prices had already dropped 5.5 percent in May from a year earlier.
The Dutch Central Bank forecast in March that house prices will continue to drop through 2014 because of stricter mortgage lending rules and a reduction of a homeowner tax break that spurred the lending boom. Values may fall another 5 percent next year, ING Groep NV economists said in a note Aug. 9.
What About France?
France is the eurozone’s second largest country, following Germany.
Note that French unemployment topped 3 million in August for the first time since 1999. France is now in a 16-month employment slide.
Government forecast for France is GDP +1.2%. I already believe that estimate to be way over-optimistic. Should a major housing bust pick up steam, a decline of 1.2% will start to look rosy.
Given president Francois Hollande’s seriously misguided tax policies coupled with inane business work rule proposals, there is every reason to expect a major French housing bust accompanied by sharp downward revisions in GDP estimates.
For more on France, please see …
France Set to Implode; Troika Soap Opera; Grappling with Neo-Nazis
Austerity Programs Hit France; Marchers Demand Vote on Treaty; Hollande Reneges on Campaign Promise
Mike “Mish” Shedlock
http://globaleconomicanalysis.blogspot.com
WEEKLY COMMENTARY
Since 1990 the Money Talks Conference Series has established itself as the first choice for Canada’s sophisticated and active investors. The Conferences have provided individual investors access to the world’s top rated financial analysts through years of unsurpassed market volatility.
Host of MoneyTalks, Michael Campbell, is hosting events in October including two dates with me, Calgary October 29th and Vancouver October 30th. In addition, there is an event October 10th in Vancouver with market analyst David Bensimon.
I hope to see many of you at one of these events. All attendees to my event October 29th and 30th will be the first to receive my new book. During the event, I will discuss some of the important lessons taught in the book and show how you can find short and long term trading opportunities with a few minutes of work. Your ticket for the evening includes:
– Attendance at the event
– A first edition hard cover copy of The Mindless Investor (value $29.95)
– One month of my daily newsletter (value $59, new subscribers only)
– One month access to Stockscores.com (value $29, new subscribers only)
For more information, click on the appropriate link below:
Evening with Michael Campbell and David Bensimon, Vancouver Oct 10
Evening with Michael Campbell and Tyler Bollhorn, Calgary Oct 29 and Vancouver Oct 30
To get 20% off of the ticket price, use the special offer code SSTB2013 at checkout.
Trade the situation, not the stock. Learn how pro traders approach the trade plus get Tyler Bollhorn’s weekly market analysis in this week’s Market Minutes video. You can watch this week’s video on Youtube by clicking here. To receive email alerts any time I upload a new video, subscribe to the Stockscores channel at www.youtube.com/stockscoresdotcom.
Here is an excerpt from my upcoming book, The Mindless Investor, How to Make Money in the Market by Overcoming Your Common Sense. This piece is from the chapter, Bad Traders Diversify.
The traditional way to manage risk is to diversify your holdings. The hope is that owning a number of stocks from sectors of the market that are not correlated to one another will lead to more consistent returns. If one stock in the portfolio suffers a large loss, it should not have a significant impact on the overall performance as the other stocks make enough of a gain to compensate.
I don’t believe in using diversification to manage a portfolio. That doesn’t mean I think it’s appropriate to put all of your capital into just one stock; it means that the mindset that diversification is based on makes little sense to me.
Diversification Weakens Your Winners
Diversification’s aim is to remove the alpha risk component and pursue the beta component. Strong moves up or down by individual stocks will not have a significant impact on the performance of the portfolio because they get watered down by diversification. By owning a basket of stocks, the diversified portfolio should perform in a way that is similar to the index. Why not just buy the index through an ETF?
In order to beat the market, you must find alpha, not take it out of your portfolio. Diversification would not allow you to buy a number of strong stocks if they were in the same sector because those stocks will tend to move together, increasing the risk of a substantial loss if the sector moves lower and takes your stocks down with it.
If the stocks you buy are trading on their own story then they shouldn’t move together. Here is an example that shows what I mean.
Suppose you find a biotech stock that makes an abnormal break from a predictive chart pattern. The chart has everything your strategy seeks, so you buy the stock. You do some research and find that this company has a treatment for colon cancer. It’s in testing, and they expect results in a month. It is apparent that the market is speculating on what those results will be, and those who know the most seem to think the results will be positive, which is why the stock is moving up abnormally.
The next day, you’re hunting for opportunities and find another stock trading with abnormal activity and breaking from a predictive chart pattern. It turns out that this stock is also a biotech stock, but this company has a treatment for obesity. It’s in clinical trials, and the buzz is that it’s working very well. The market is speculating that this company’s treatment is going to have a dramatic impact on its long-term ability to make a profit.
Given that these stocks are in the same sector, buying both would go against the principles of diversification because the expectation is that they will move in similar fashion. As the biotech sector moves, so too should these stocks.
However, these stocks are not trading higher because of their correlation to the overall market or the sector. They’re trading up because of company-specific factors that are completely unrelated to one another. One company has a treatment for colon cancer and the other for obesity. If one company’s drug fails to work, it won’t take the other company lower, because one company’s future earnings are not dependent on the other.
The aim of diversification is to mitigate the damage from being wrong. The hope is that losses in one stock can be overcome by gains in the others. Unfortunately, stocks that aren’t trading on their own story tend to be highly correlated to one another regardless of their sector. If the S&P 500 index is down 2% in one day, you can expect that almost every stock that trades in the market will be down. Not just in the U.S.-these strong down days tend to affect the markets globally. When the markets sell off, there are few places to hide.
What you can do, however, is limit the effect the loss has on your overall portfolio. If a stock you own falls through support-if the market gives you a message that the stock is likely to fall lower still-then sell it. Take the small loss and move on.
If you really like the company (I hope you never like any company, only the trade of it!) then you’ll get the opportunity to buy it back later, probably at a lower price. When a good trade goes bad and requires you to take a loss, take it and move on.
By diversifying, you are expecting to do a bad job at picking stocks. You intend to hang on to losers and use the profits from the winners to overcome the loss. It’s better to focus on a strategy that does a better job of picking trades with a positive expected value and work on the discipline to take a loss when the market tells you to.
STRATEGY OF THE WEEK
The market gave us a sign that it is going to pull back in the near term. Here are a few vehicles to take advantage of a market sell off:
STOCKS THAT MEET THAT STRATEGY
1. T.VXX
The VXX tends to go up when the market goes down because investors buy options as insurance, raising the premium paid for the option. The VXX is based on the option premium in the S&P 500 index. It is a great hedge against market weakness and it broke a short term downward trend line today. The Canadian version trades with the symbol T.VXX.

2. QID
20% of the Nasdaq 100 is based on Apple (AAPL) and that stock has been falling for a few days. That has helped the QID go up since it is an inversely correlated ETF to the Nasdaq 100. I won’t be surprised if the sell off on the Nasdaq stalls in the next few days as AAPL is near some support, but as the month progresses I think there is a good chance the QID moves higher as the Nasdaq moves lower.

References
- Get the Stockscore on any of over 20,000 North American stocks.
- Background on the theories used by Stockscores.
- Strategies that can help you find new opportunities.
- Scan the market using extensive filter criteria.
- Build a portfolio of stocks and view a slide show of their charts.
- See which sectors are leading the market, and their components.
Disclaimer
This is not an investment advisory, and should not be used to make investment decisions. Information in Stockscores Perspectives is often opinionated and should be considered for information purposes only. No stock exchange anywhere has approved or disapproved of the information contained herein. There is no express or implied solicitation to buy or sell securities. The writers and editors of Perspectives may have positions in the stocks discussed above and may trade in the stocks mentioned. Don’t consider buying or selling any stock without conducting your own due diligence.

-
I know Mike is a very solid investor and respect his opinions very much. So if he says pay attention to this or that - I will.
~ Dale G.
-
I've started managing my own investments so view Michael's site as a one-stop shop from which to get information and perspectives.
~ Dave E.
-
Michael offers easy reading, honest, common sense information that anyone can use in a practical manner.
~ der_al.
-
A sane voice in a scrambled investment world.
~ Ed R.
Inside Edge Pro Contributors

Greg Weldon

Josef Schachter

Tyler Bollhorn

Ryan Irvine

Paul Beattie

Martin Straith

Patrick Ceresna

Mark Leibovit

James Thorne

Victor Adair