
Personal Finance
Gold & Silver Portfolio Structure
The single most important thing responsible for growth of your portfolio on the long-term is diversification. We can’t stress enough just how important it is!
Summary
Although reading this long report is probably not an easy thing to do without a cup (or two) of your favorite coffee, you can rest assured that it will be worth it. According to most studies, the structure of one’s portfolio is responsible for at least 75% of the investment success in the long term. This means that even if your market timing skills are brilliant, you may still lose money on the long-term if you don’t pay enough attention to portfolio structuring.
In this report we show you how to structure your portfolio so that it:
- Limits risk,
- Provides significant upside potential and exposure to the great bull market in silver and gold,
- And takes into account key major factors that could come into play in the following years like a collapse of financial system, lack thereof, stable continuation of the bull market and a prolonged consolidation.
Additionally, you learn more about diversification and how it can be utilized on different levels of your portfolio. You also learn the advantages of semi-active portfolio management.
Finally, we discuss in detail how to combine signals from investment tools and analysts, and provide 3 sample portfolio structures for 3 different types of investors. (Emphasis mine – Editor Money Talks)
We encourage you to apply the rules outlined to your own portfolio at least partly. Please keep in mind that the more you care about your capital, the more it will be able to care for you and your goals when it is needed.
At Sunshine Profits, we’ll keep helping you grow your portfolio more predictably.
…..read the entire report HERE

Stocks Reverse Two-Day Slide
Stocks tried to regain their short-term mojo Wednesday following some better than expected economic data and a development on the regulatory front. From Bloomberg:
Data today showed new-home sales in the U.S. surged in August to the highest level in more than six years, a sign that the housing recovery is making progress…Eight of the 10 main S&P 500 groups gained as health-care companies jumped 1.6 percent, after a two-day slide, amid signs the Obama administration’s efforts to curtail tax-friendly overseas deals might fall short.
How Much Damage To Equities?
While the top callers continue to get attention, the reality is stocks dropped for two days following last week’s new highs. The market continues to be concerned about a future shift from the Fed, which aligns well with the historical interest rate cycle script. A Fed-induced correction could occur in the coming months. Is there a way to monitor risk in the equity markets?
Trends Speak To Economic Conviction
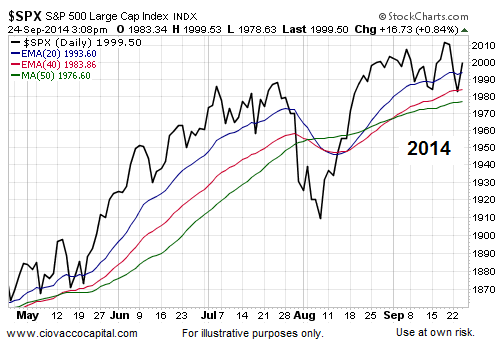
Trends can help with risk management. When the net aggregate opinion of all market participants is favorable, markets tend to push higher. Conversely, when the net aggregate opinion becomes pessimistic, markets tend to drop. Moving averages help us monitor the market’s pulse. During a correction, the S&P 500 (shown in black below) tends to drop below the colored moving averages. Also note the slopes of the colored moving averages (MAs) tend to roll over during sharper pullbacks in equity prices. Relative to the bearish period on the left, the bullish period on the right side of the chart looks quite a bit different (price above MAs, slopes of MAs are positive).

How Does The Market Look Today?
The chart below is as of 3:08 p.m. ET Wednesday. While there are reasons to be concerned and to pay closer attention, the market has not rolled over in a significant manner. The chart below tells us to exercise some patience with the core portion of our equity-based holdings.
Investment Implications – The Weight of The Evidence
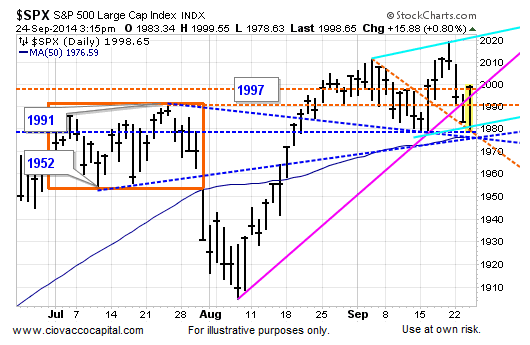
It is not all fun and games from a risk-reward perspective. Wednesday morning the S&P 500 hit a low of 1,978 and was testing the important cluster of support shown below. The market held, but the issues related to a flat 50-day moving average, outlined on September 16, still apply.
Fed: Mixed Message On Rates
On Tuesday, Federal Reserve Bank of St. Louis President James Bullard said he sees the Fed raising interest rates some time early next year. On Wednesday, Chicago Federal Reserve Bank President Charles Evans took the other side of the argument saying the Fed should be “exceptionally patient” in removing monetary policy accommodation.
Guideposts Can Help
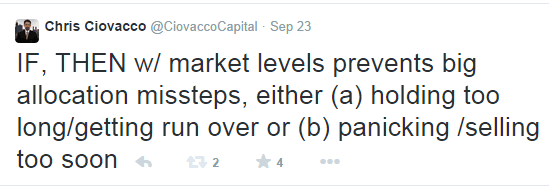
How can we logically balance risk and reward in this schizophrenic environment? One way is to use market levels as a guide. The tweet during Tuesday’s selloff in stocks illustrates the concepts.
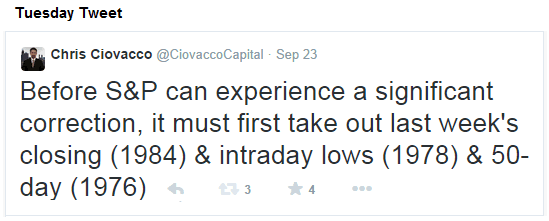
The S&P 500 closed below 1984 Tuesday, but above the more important 1976 (50-day moving average). Therefore, we reduced risk in a relatively small manner before Tuesday’s close. When stocks rallied Wednesday, we still had significant equity exposure. Why do we use a level-based and incremental approach?
As long as the S&P 500 holds above the key support cluster in the 1976 area, our bias will be to leave our stocks (VOO) and leading sectors (XLK) alone. Below 1976, we will be more apt to make some additional chess moves. The market will guide us if we are willing to listen.

 You’ll recall from yesterday that the first secret to getting rich is that you cannot fear poverty. Otherwise, you can’t take the chances you need to take if you are to accumulate substantial wealth.
You’ll also recall that there are only three important decisions in life: what you do… where you do it… and with whom you do it.
Here, we continue our series with more on… what you do.
Imagine a man who is a great chef. He loves cooking. So he opens a restaurant, and it is an immediate success.
Seeing the possibilities, he takes his recipes, trains other chefs and opens other restaurants. Pretty soon, he has restaurants all over town… and the money is rolling in.
But now he is no longer doing what he likes to do. Instead of cooking, he’s running a complicated business; he’s become a manager and an administrator. He’s figuring out tax strategies, leverage and cost control.
“I’ve become a damned accountant,” he says. “I hate accounting.”
The real fun is getting money, not having it. Once you have it, the fun is over.
This is partly because of the nature of wealth. To get it, you have to be expansive, ambitious and optimistic. But once you have it, you have to change your personality to cope with it… protect it… and administer it.
Instead of being an entrepreneur… and a builder of wealth… you must become a custodian… and a conservator.
You can no longer be the same person you were. You have to assume that the worst will happen… because it probably will.
Now you have to be cautious, careful, distrustful, cynical… and pessimistic. You’re no longer expanding your wealth. Now, it shrinks as you do all you can to try to stop nature from running her course.
In short, you are no longer a young man full of energy and promise; you are now an old man trying to stop the clock.
And then, when you are no longer building a fortune, you have to do something else.
But what?
You look for things to do… ways to pass the time… things you can convince yourself are meaningful or fun. But they are usually just big time wasters – art… charities… sports… entertainments.
Often, the positions a rich person puts himself in are not only dull, but also they are fraudulent.
He has made a lot of money in one business, so he thinks he will be competent and successful in others. Remarkably, others think so too! So he could end up as chairman of a local hospital board or maybe the head of its investment committee.
But nothing in his career prepares him for the petty politics of a charity board of directors… or the deceptive nuances of the investment world.
He is not only miserable because he feels he is wasting his time, his projects also end in failure.
The hospital board gets into a nasty internal feud… and he cuts the hospital fund – and his own fortune – in half, mistakenly believing that he knows what he is doing.
We did not make that mistake. We have not retired. Still, we have suffered from wealth.
Tune in tomorrow to find out how…
Bill
Market Insight:
Beware of Overconfidence
From the desk of Chris Hunter, Editor-in-Chief, Bonner & Partners
If you’re watching the Dow and the S&P 500, it seems nothing can go wrong for investors.
For most folks, watching stock prices rise without so much as a 10% correction induces a very human response: They assume it “means” that prices will continue to rise.
As Yale economics professor and recent Nobel laureate Robert Shiller put it in his bookIrrational Exuberance:
Another aspect of overconfidence is that people tend to make judgments in uncertain situations by looking for familiar patterns and assuming that those patterns will resemble past ones, often without sufficient consideration of the reasons or the probability of the pattern repeating itself.
But overconfidence works in many different ways.
For example, Shiller carried out a survey of investors following the October 19, 1987, US stock market crash to investigate how overconfidence affects market prices.
He asked, “Do you think at any point on October 19, 1987, that you had a pretty good idea when a rebound was to occur?”
Of the individual investors surveyed who bought on that day, 47% said yes. And of the institutional investors surveyed who bought on that day, nearly 48% said yes.
According to Shiller:
Thus nearly half of those trading that day thought they knew what the market would do that day
Why would anyone think they could forecast what the stock market would do on a particular day – especially one as volatile and frightening as October 19, 1987?
This certainly does not conform to what we know about the forecastability of markets.
And when Shiller asked investors what made them think they knew when a rebound would occur, references were made to “intuition,” “gut feeling,” “common sense.”
His conclusion: These intuitive feelings play a large role in setting market prices.
The problem is your intuition is just as likely to be wrong as right. Past market movements, although often of interest, do not tell you what is coming next.
In fact, as far as we know, there is no way of determining near-term market moves in a consistent way.
That’s why it pays to focus on the long term.
As we wrote on Friday, if you look back as far as 1926 (the year one of the most extensive publicly available data sources starts) through December 2012, the 30% of stocks with the lowest P/Es has delivered 18.6% annualized returns. The 30% of stocks with the highest P/Es has delivered 10.9% annualized returns.
Clearly, your buy price, over long time horizons, is closely linked with your returns.
So, instead of trying to predict where prices will be in the future based on past price movements, focus instead on the price you pay for your investments.
You don’t know what the future holds. What you do know, with mathematical certainty, is that the lower the price you pay now, the higher your future returns will be. And the higher the price you pay now, the lower your future returns will be.
With the US stock market trading on valuations at the top of their historical range… now is not a promising time to buy for long-term investors.
If you are already invested in US stocks, consider taking some money off the table and increasing your cash balance. And consider using trailing stop losses to lock in your gains.
Further Reading: The US is heading down a difficult path. As Bill says, “It already lives on borrowed money… and borrowed time.” If you want to learn how this has happened and what you can do to overcome the financial challenges that will arise as the situation deteriorates, you simply MUST read Bill’s book The New Empire of Debt, which he co-wrote with Addison Wiggin.
It reveals, in often shocking detail, the financial realities the US faces and what the ultimate outcome may be. Claim your FREE hardcover copy of Bill and Addison’s book here. All we ask is that you cover the shipping cost.
Interest rates, oil prices, earnings, GDP, wars, terrorist attacks, inflation, monetary policy, etc. — NONE have a reliable effect on the stock market
You may remember that during the 2008-2009 financial crisis, many called into question traditional economic models.
Why did the traditional financial models fail? And more importantly, will they warn us of a newapproaching doomsday, should there be one?
This series gives you a well-researched answer.
Here is Part V; come back soon for Part VI.
Myth #5: “GDP drives stock prices.”
By Robert Prechter (excerpted from the monthly Elliott Wave Theorist; published since 1979)
Surely the stock market reflects the nation’s Gross Domestic Product. The aggregate success of corporations shows up as changes in GDP. Stocks are shares in corporations. How could their prices not reflect the ebb and flow of GDP?
Suppose that you had perfect foreknowledge that over the next 3 3/4 years GDP would be positive every single quarter and that one of those quarters would surprise economists in being the strongest quarterly rise in a half-century span. Would you buy stocks?
If you had acted on such knowledge in March 1976, you would have owned stocks for four years in which the DJIA fell 22%. If at the end of Q1 1980 you figured out that the quarter would be negative and would be followed by yet another negative quarter, you would have sold out at the bottom.
Suppose you were to possess perfect knowledge that next quarter’s GDP will be the strongest rising quarter for a span of 15 years, guaranteed. Would you buy stocks?
Had you anticipated precisely this event for 4Q 1987, you would have owned stocks for the biggest stock market crash since 1929. GDP was positive every quarter for 20 straight quarters before the crash and for 10 quarters thereafter. But the market crashed anyway. Three years after the start of 4Q 1987, stock prices were still below their level of that time despite 30 uninterrupted quarters of rising GDP.
Figure 10 shows these two events. It seems that there is something wrong with the idea that investors rationally value stocks according to growth or contraction in GDP.

Interest rates, oil prices, trade balances, corporate earnings and GDP: None of them seem to be important, or even relevant, to explaining stock price changes. But you need not trust your own eyes. In a study that is stunning for its boldness in actually checking basis premises, Cutler, Poterba and Summers in a paper for the Journal of Portfolio Management in 1989 investigated the effect of economic news on stock prices and concluded,
“Macroeconomic news bearing on fundamental values…explains only about one fifth of the movement in stock prices.”
Even here, I would question the conclusion that such news “explains” even 1/5 of the movement in stock prices. Surely a set of football statistics could generate a 1/5 correlation to the S&P. And every correlation, to have meaning, must have a theory to account for it.
What theory accommodates the idea that macroeconomic fundamentals explain 1/5 of stock price changes? If there is no accommodating theory, then the presumed causality involved is tenuous at best.v
(Stay tuned for Part VI of this important series, where we examine another popular investment myth: Namely, that “Wars are bullish/bearish for stock prices.”)
Free Report:
“The Biggest Lie in Stock Market History”
Dear Reader,
We believe risks and opportunities even larger than those of 2007-2009 lie ahead in a bear market of epic proportions.
Only problem is, this bear market is silent right now. It’s not visible to the public, because the government and the Federal Reserve inflate the credit supply and the U.S. dollar to hide its impact.
But make no mistake about it: There is a Silent Crash going on right now in the stock market, and it’s having avery real impact on your spending power.
Read this special report now, free — and see 15 eye-opening charts >>
 The Dow rose back above 17,000 yesterday. All clear. US stock market investors: Your money will probably not die today. Maybe tomorrow.
But does it really make sense to be in the US stock market now?
There may be apples higher up in this tree, but it is dangerous to reach for them.
We came up with our Simplified Trading System (STS) a long time ago as a way to tell us when it was time to put away the ladder. We weren’t completely serious about it then… and still aren’t now.
Still, it’s a great system… but only for people with the life expectancy of Methuselah and boundless patience.
The original idea was that there was a time to be in stocks and a time to be out. When you were out… you just stayed in cash. And because we’re talking about long periods of being in cash, you should be in the “cash” that holds up over time: gold.
P/E > 20 = Sell stocks.
Otherwise = Gold.
Simple?
Well, yes and no. You have to decide how you’re going to calculate the P/E ratio, for example. And therein hangs a long and complicated tale…
Forward earnings estimates? Last year’s “as reported” earnings? Earnings averaged over the 10 years and adjusted for inflation? Normalized earnings?
To put this in perspective, we are suspicious of “as reported” earnings. The Fed and other central banks are artificially pushing down interest rates. This artificially pushes up earnings.
That’s because ultra low rates push down corporations’ interest expenses on their debt. Meanwhile, earnings per share – even more important to shareholders than earnings – rise due to debt-fueled share buybacks.
We’d rather base our strategy on something more real. And right now, we guess that earnings, adjusted to normalized interest rates, should put the P/E ratio way over 20 – long past our “sell by” date.
Sure, our STS can be improved. But had you followed the system since 1980, you would have bought the S&P 500 in the early 1980s and enjoyed at least 10 years of that bull market. (The index had started trading above 20 times earnings by 1992.)
You would have made about three times your money by the time you got around to selling out. (At that point, the better move would have been to put a trailing stop-loss on your position. But who knew?)
This would also have put you into gold near its bottom. Let’s say you bought at around $400 an ounce. Stocks have not fallen to a P/E, on last year’s earnings, of less than 10 since. So, you’d still have your gold – now worth about three times what you paid for it.
If you’d started in 1980 with $10,000, now you’d have about $90,000 – with almost no fees or trading costs along the way… and only one tax event (at capital gains rates).
If you’d started with $1 million, you’d now have about $9 million.
Great?
No. But not bad for making a total of two moves… neither of which was very risky.
But of course, you would have missed all the fun of trading in and out… talking to your broker… watching Jim Cramer on CNBC… and reading our newsletters.
And today, you’d be sitting on a pile of gold, cursing us for having kept you out of one of the biggest bull markets in history.
But can you really expect to do better?
Maybe! We developed the STS because we don’t have the temperament to do serious stock research. We enjoy economics… and trying to put the pieces of the big puzzle together. We don’t have a head for the painstaking, detailed work required of a stock analyst.
But we’ve seen that a careful investor who is willing to do his homework can outperform the markets over long periods.
We saw evidence in the track records of our own colleagues Porter Stansberry and Chris Mayer, for example – who have more than doubled the market averages over the last 10 years. Thousands of other investors have done likewise.
You can see the current marketing campaigns for Porter’s service here and Chris’s servicehere. Our feelings won’t be hurt if you decide to subscribe to their services rather than our own.
Still, you might be better off reading my new letter too.
Besides, the Diary is free. You can’t beat that.
The cost in time… well, we try to make it worth your while.
Regards,
Bill
Further Reading: If you don’t have the stomach for betting on the direction of stock markets, there’s a relatively unknown three-step process you can use to collect hundreds of dollars from an entirely different type of market altogether. According to Barron’s, this is “a simple strategy that can boost your returns without increasing your risk level.” To find out full details, follow this link.
Market Insight:
Three Flavors of Risk
From the desk of Chris Hunter, Editor-in-Chief, Bonner & Partners
Our recommendation to buy beaten down Russian stocks continues to stir controversy amongDiary readers. (If you have thoughts on this, please join in the conversation. Just hit “reply” to this email to write to us directly.)
Reader Darin A. takes us to task for our assertion that the high risk in Russia right now (perceived or otherwise) means high future expected returns.
Darin believes it’s the other way around:
Value investing gets you low risk (due to your deliberate choice of a high margin of safety) and high potential reward. You get the best of both worlds.
It all depends on your definition of risk…
Perhaps the simplest definition of risk is that more things can happen than will happen.
But Wall Street likes to measure risk as volatility. The more assets move up and down in price, the “riskier” they are.
By this definition, Russian stocks are certainly risky right now. Since Russia annexed Crimea in March, Russian stocks have been the most volatile since 2009.
As of the end of May, for example, volatility for the Russian benchmark Micex Index was almost three times the level of the MSCI Emerging Markets Index.
It’s easy to poke fun at the Wall Street’s definition of risk as volatility. But keep in mind that during the Great Depression US stocks lost 80% of their value. And in the 1973-74 bear market, stocks lost half their after-inflation value.
Add to that the 1987 crash… the dot-com crash… and the 2008 crash… and it’s not hard to see why investors demand higher compensation for holding stocks over, say, bonds or cash.
And if you were a pension fund manager… and making decisions about retirees’ nest eggs… this kind of volatility really is risk.
For someone who needs to access their funds in the next couple of years, an investment in Russian stocks now could mean those funds aren’t available when they’re needed. The poor retiree could find himself trying to cash out while the Russian market is in a trough.
So, investors demand higher returns on Russian stocks than, say, US or Canadian stocks in exchange for putting up with higher volatility.
But Darin is not wrong, either…
If you define risk a third way – as the potential for a permanent loss of invested capital – low prices can have the effect of damping risk.
That’s because buying low and selling high gets you positive returns. And buying high and selling low gets you negative returns. The lower you buy, the more chance there is of fetching a higher selling price.
The point is that the rewards low prices bring come with a catch: You have to shoulder high levels of perceived risk about a stock or a country – as is the case in Russia today.
Darin’s right: Low prices aren’t risky. But you don’t get low prices without lots of fear… and often the whiff of cordite in the air.
P.S. If investing in Russian stocks is the kind of thing that would give you sleepless nights, you may be interested in a different approach to “investing” altogether. Instead of betting on the direction of stocks, there is a way to pick up extra income by allowing other investors shoulder this kind of risk. You can read all about it in our special investor report.

-
I know Mike is a very solid investor and respect his opinions very much. So if he says pay attention to this or that - I will.
~ Dale G.
-
I've started managing my own investments so view Michael's site as a one-stop shop from which to get information and perspectives.
~ Dave E.
-
Michael offers easy reading, honest, common sense information that anyone can use in a practical manner.
~ der_al.
-
A sane voice in a scrambled investment world.
~ Ed R.
Inside Edge Pro Contributors

Greg Weldon

Josef Schachter

Tyler Bollhorn

Ryan Irvine

Paul Beattie

Martin Straith

Patrick Ceresna

Mark Leibovit

James Thorne

Victor Adair