
Stocks & Equities
The Dow and S&P 500 notched new highs this morning. So what else is new? Stocks have been going through the roof pretty much all year with no let-up in the upside momentum, save for a few minor pullbacks of 3% or so.
I’ve been warning for some time now that this overbought, overvalued market is also way overdue for a correction. And I’ve been proven dead wrong so far. But the fact is, the longer it takes for a typical pullback to materialize, the more severe it is likely to be.
At the risk of sounding like a broken record, here are several bearish red flags to watch closely. That’s because any one – or some combination – of them could quickly pull the rug out from under the market …
Red Flag #1 – Bad breadth: Granted, stocks are hitting new highs almost daily. But I notice a glaring lack of conviction in terms of market breadth – fewer advancing vs. declining stocks, which you can see in the chart below – and fewer new highs.
Plus, trading volume has diminished steadily in recent weeks at a time of year when it typically picks up.

These are classic signs of a market about to run out of gas. And they tell me the long-awaited correction is finally looming.
Don’t get me wrong; I’m not expecting a repeat of the 1987 stock market crash, which took the Dow down 22% in a single day 30 years ago last week. But we’re way overdue for a typical 10% correction.
And there’s a long way for stocks to fall, because they’re so overextended to the upside right now …
Red Flag #2 – Stocks overextended: In addition to cycles analysis, I keep a watchful eye on several tried-and-true technical indicators of price action for the markets.
One of the best is relative strength – which is a popular measure of momentum.
Specifically, the Relative Strength Index is an oscillator that moves between 0 and 100 and reflects the strength of a market’s trend. When RSI turns up from a very low level, it signals an oversold market, which may be a good buying opportunity.
But as you can see clearly in the chart below, the S&P 500 is at the other extreme …
 https://s3n.edelsoninstitute.com/wp-content/uploads/2017/10/wavechart1023-300×197.jpg 300w” sizes=”(max-width: 631px) 100vw, 631px”>
A very high RSI reading – 70 or above – signals an overbought market that’s ripe for a correction. And sure enough, the RSI for the S&P 500 has been above 70 for 15 straight days. That’s a rare occurrence that typically signals a correction of 5% or more.
All the market needs is a catalyst to break this complacency, and there are plenty of potential candidates …
Red Flag #3 – Rising headline risks: North Korea is the most obvious flash point right now, but by no means is it the only one. Just take a look at some recent headlines …
“North Korea has upped its war talk once again, warning the United States it faces an ‘unimaginable strike at an unimaginable time.‘ ”
Or how about the Middle East, where Iraq’s offensive against the Kurds threatens oil supplies? Then there are ongoing conflicts in Syria, Yemen, Libya, Turkey and the Ukraine … just to name a few. A flare-up in any one of these hot spots would quickly shatter the stock market’s complacency.
Or how about Europe?
“Stocks Drop as Spain Crisis Heats Up.“
Millions of Catalans protested for self-rule over the weekend, they want out of Spain. And Spain responded by seizing control of the autonomous region, actions that likely foreshadow large-scale civil unrest and probably martial law in one of Europe’s most-populous nations.
And while we’re on Europe, do you remember this headline from early 2017 …
“EU banks crumbling under 1 trillion-euro severe debt as toxic loans threaten CRISIS.“
This story broke back in January. And it wasn’t some prophet of doom-and-gloom saying it either. It was the chairman of the European Banking Authority sounding the alarm, the EU’s top banking regulator!
He warned flat-out that the amount of toxic debt held by EU banks has reached “urgent and actionable” levels. And guess what the EU has done about it? Absolutely nothing!
Just because the EU has been relatively quiet lately, don’t be fooled into thinking their banking and debt crisis is over … not by a long shot.
Bottom line: There is no shortage of potential risks to the market that investors are largely ignoring today. But complacency almost always gives way to a spike in volatility. That, you can bet on.
At this point, the consensus expects clear sailing for stocks through year-end. After all, this is seasonally the strongest time for stocks. But I believe the consensus may have it all wrong this time.
Investors are fooling themselves if they believe the stock market will continue to “melt-up” forever. Any one out of dozens of potential catalysts could trigger a sharp correction in this overbought market.
Forewarned is forearmed!
Good investing,
Mike Burnick

Briefly:
Intraday trade: Our Friday’s intraday trading outlook was neutral. It proved wrong because the S&P 500 index gained 0.5%, following higher opening of the trading session. The broad stock market accelerated its uptrend on Friday. There have been no confirmed negative signals so far. On the other hand, we still can see some short-term overbought conditions. Therefore, we prefer to be out of the market today, avoiding low risk/reward ratio trades.
Our intraday outlook is neutral today. Our short-term outlook is neutral, and our medium-term outlook is neutral:
Intraday outlook (next 24 hours): neutral
Short-term outlook (next 1-2 weeks): neutral
Medium-term outlook (next 1-3 months): neutral
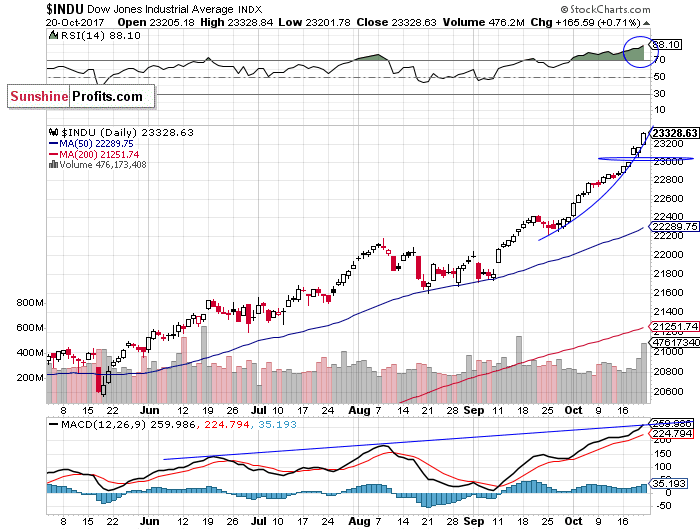
The main U.S. stock market indexes gained between 0.4% and 0.7% on Friday, extending their long-term uptrend, as investors’ sentiment remained very bullish following Thursday’s rebound off support level. The S&P 500 index has reached new record high at the level of 2,575.44. The Dow Jones Industrial Average reached another all-time high at the level of 23,328.84. It accelerated its recent run-up, as investors were euphorically buying blue-chip stocks. The technology Nasdaq Composite was relatively weaker than the broad stock market. However, it reached new record high at the level of 6,640.03, around 0.1% above its Wednesday’s high. The nearest important level of support of the S&P 500 index is now at around 2,565, marked by Friday’s daily gap up of 2,562.36-2,567.56. The next support level remains at around 2,550, marked by previous level of resistance, among others. The next support level is at 2,540, marked by recent fluctuations. On the other hand, potential resistance level is at around 2,600. The S&P 500 index accelerated its uptrend, as it broke above recent consolidation. Will it continue even higher? There have been no confirmed negative signals so far. However, we can see some medium-term technical overbought conditions:
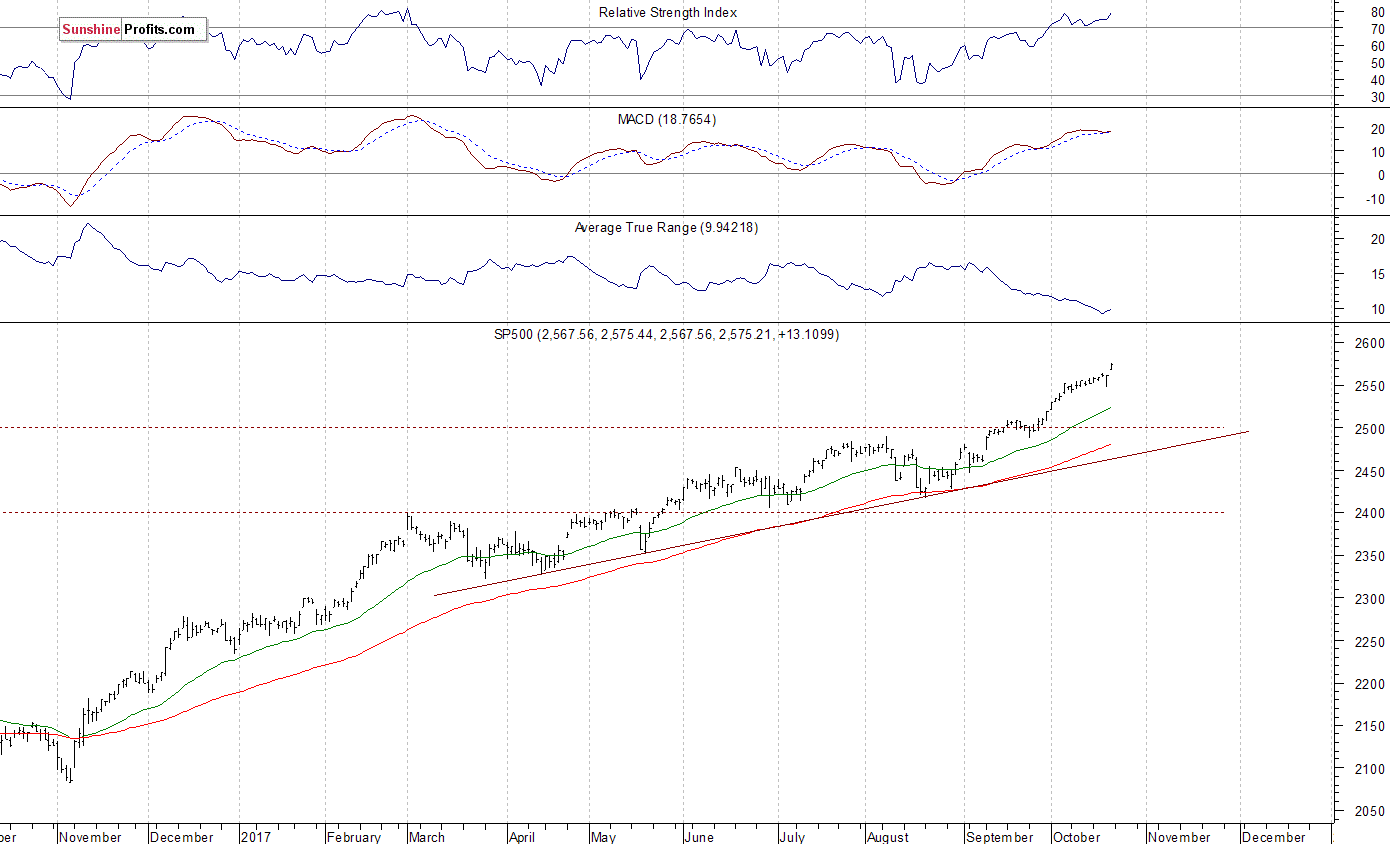
Close To New Record High
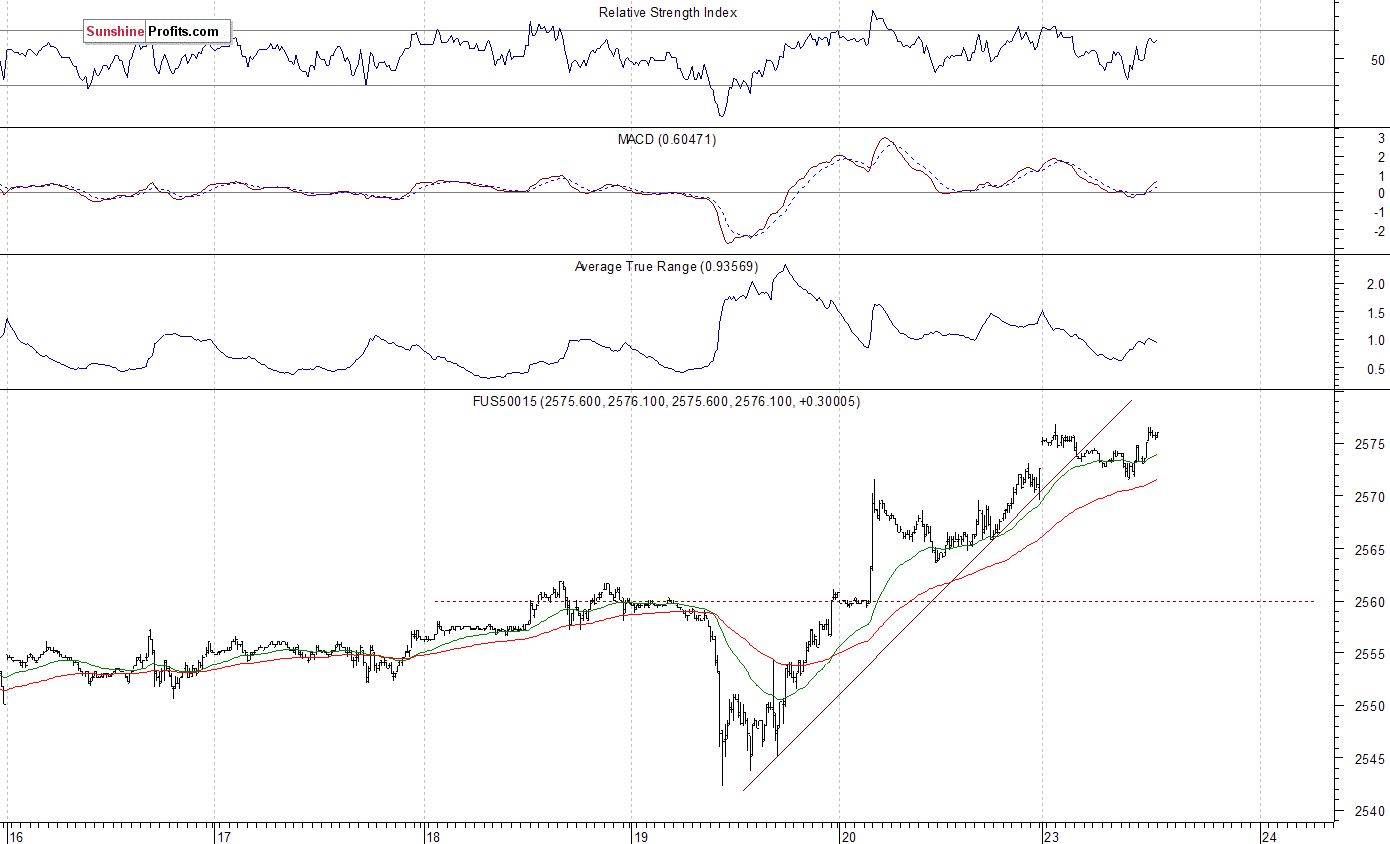
Expectations before the opening of today’s trading session are slightly positive, with index futures currently between +0.1% and +0.2% vs. their Friday’s closing prices. The European stock market indexes have gained 0.2-0.5% so far. There will be no new important economic data announcements. However, investors will wait for quarterly corporate earnings releases. The S&P 500 futures contract trades within an intraday consolidation, following an overnight rally. The market has reached new record high above the level of 2,575. The nearest important support level is at 2,565-2,570, marked by recent fluctuations. The next level of support remains at 2,560, marked by Wednesday’s local high. The futures contract trades close to its new record high, as we can see on the 15-minute chart:
Nasdaq Still Relatively Weaker
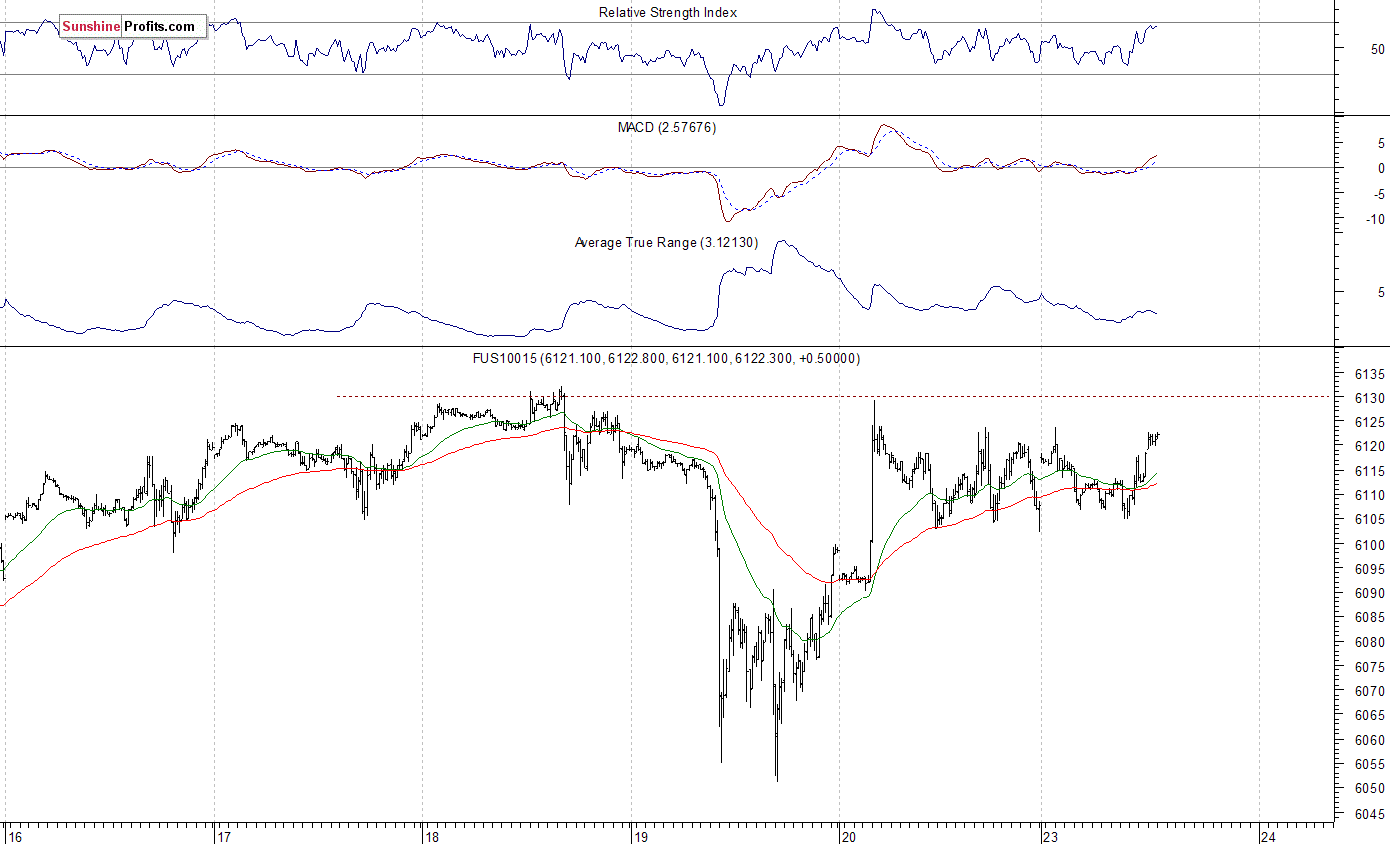
The technology Nasdaq 100 futures contract trades within an intraday consolidation, as it extends its Friday’s uncertainty. The market fluctuates along record high, close to resistance level of 6,130. The support level remains at 6,080-6,100. The next support level is at around 6,050, marked by Thursday’s daily low. The Nasdaq 100 futures contract extends its fluctuations along last week’s highs, as the 15-minute chart shows:
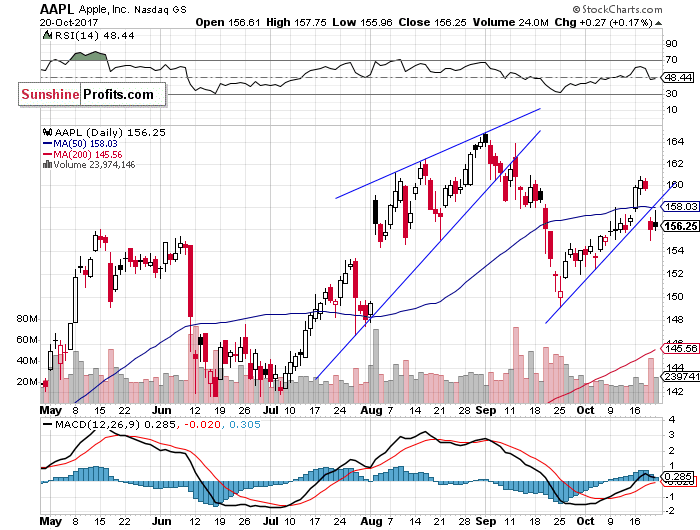
Let’s take a look at Apple, Inc. stock (AAPL) daily chart (chart courtesy of http://stockcharts.com) again. The stock remains relatively weaker than record-breaking broad stock market gauges. It broke below its short-term upward trend line on Thursday, after reaching resistance level of $160. The stock price bounced off support level at around $150 at the end of September. Is this a new downtrend or just downward correction following recent advance?
The Dow Jones Industrial Average daily chart (chart courtesy of http://stockcharts.com) shows that blue-chip index accelerated its long-term uptrend last week. There have been no confirmed negative signals so far. However, we can see technical overbought conditions. Is this a medium-term blow-off top pattern?
Concluding, the S&P 500 index continued its long-term uptrend on Friday, as it reached new all-time high at the level of 2,575.44. Investors’ sentiment remained very bullish ahead of quarterly earnings releases. There have been no confirmed negative signals so far. However, we still can see technical overbought conditions. Is this some medium-term topping pattern before downward correction?
If you enjoyed the above analysis and would like to receive free follow-ups, we encourage you to sign up for our daily newsletter – it’s free and if you don’t like it, you can unsubscribe with just 2 clicks. If you sign up today, you’ll also get 7 days of free access to our premium daily Gold & Silver Trading Alerts. Sign up now.
Thank you.
Paul Rejczak
Stock Trading Strategist
Stock Trading Alerts
Todd Market Forecast for 3:00 Pacific Thursday October 19, 2017
DOW + 5 on 9 net advances
NASDAQ COMP – 19 on 419 net Declines
SHORT TERM TREND Bullish
INTERMEDIATE TERM Bullish
STOCKS: Some negative news from Europe and some downbeat earnings hit an overbought market and the result was a sharp decline at the opening with the Dow down 104 points.
However, like so many times before, the decline was soon halted and the remainder of the session saw buying come in. This market is like a ball being pushed under water. It keeps popping back up.
This is even more remarkable given the fact that this is October, the month of so many sharp drops in previous years.
Perhaps the memory of the sharpest one day drop in history exactly 30 years ago played a bit part in this drama in the very early going.
But our task is simple. We’re going to keep riding this horse ’till if gives out. We’ll stay with our positions.
GOLD: Gold was up $3. Just a small move without consequence. At least for now.
CHART: The S&P reversed and maintained its bullish posture. These kinds of reversals tend to be bullish more often than not.

BOTTOM LINE: (Trading)
Our intermediate term system is on a buy.
System 7 We are long the SSO from 95.27. Keep your stop at 98.77.
System 8 We are in cash. Stay there for now.
System 9 We are in cash.
NEWS AND FUNDAMENTALS: Jobless claims were 222,000, less than the expected 240,000. The Philadelphia Fed Business Outlook Survey was 27.9, better than the consensus 20.2. On Friday we get existing home sales.
INTERESTING STUFF: “Learn from yesterday, live for today, hope for tomorrow. The important thing is not to stop questioning.”Albert Einstein
TORONTO EXCHANGE: Toronto gained 36.
BONDS: The bond market rebounded somewhat.
THE REST: The dollar lost ground. Crude oil was basically unchanged.
Bonds –Bullish as of October 12.
U.S. dollar – Bearish as of October 10.
Euro — Bullish as of October 10.
Gold —-Bearish as of October 17.
Silver—- Bearish as of October 17.
Crude oil —-Bullish as of October 10.
Toronto Stock Exchange—- Bullish as of September 20, 2017.
We are on a long term buy signal for the markets of the U.S., Canada, Britain, Germany and France.

Monetary conditions (+2 means the Fed is actively dropping rates; +1 means a bias toward easing. 0 means neutral, -1 means a bias toward tightening, -2 means actively raising rates). RSI (30 or below is oversold, 80 or above is overbought). McClellan Oscillator ( minus 100 is oversold. Plus 100 is overbought). Composite Gauge (5 or below is negative, 13 or above is positive). Composite Gauge five day m.a. (8.0 or below is overbought. 13.0 or above is oversold). CBOE Put Call Ratio ( .80 or below is a negative. 1.00 or above is a positive). Volatility Index, VIX (low teens bearish, high twenties bullish), VIX % single day change. + 5 or greater bullish. -5 or less, bearish. VIX % change 5 day m.a. +3.0 or above bullish, -3.0 or below, bearish. Advances minus declines three day m.a.( +500 is bearish. – 500 is bullish). Supply Demand 5 day m.a. (.45 or below is a positive. .80 or above is a negative). Trading Index (TRIN) 1.40 or above bullish. No level for bearish.
No guarantees are made. Traders can and do lose money. The publisher may take positions in recommended securities.
 Many will simply read the headline to this article, and use it as support for their belief in the market striking a multi-year top right now. I mean, aren’t headlines like this proof that the market is overheated?
Well, the answer is a definite “sometimes.” You see, back in 2015 and 2016 I was writing articles with headlines saying that we are going to target the 2500SPX region. And, if you thought that those headlines were portending the end of the bull market, then you were clearly wrong. So, consider, maybe this headline is prescient rather than a contrarian signal. double click larger chart
While it is quite profitable at times to be a contrarian in the market, at other times it is downright dangerous. When you are standing in front of a bull who is charging ahead at full speed, you either get gored or trampled. The key is to know when the time is ripe to be a contrarian rather than simply being a contrarian because you “feel” the market is too high.
And, I am quite certain you have read all the articles constantly being published about one matrix or another that presents the “bear case” as to why the market will top today. The problem is that those articles have been published EVERY day for the last year and a half. But, since bearishness sells, we can understand why they are such click-bait, and will garner heavy hits for those writing such articles. And, Seeking Alpha is clearly not immune from such writers. The problem is that they do not serve investors well.
Remember what Keynes said: “The market can remain irrational longer than you can remain solvent.” But, more correctly, the market is always irrational. It is not based upon “logic,” or else one would engage the services of a logician to prognosticate market direction. Consider when was the last time you saw a logician identify a turning point in the market?
Currently, I am seeing more and more people believing that this current rally will simply continue unabated. As the market continues higher, their bullish calls become stronger and stronger. This is simply how market sentiment works. So, rather than expecting a crash, many are moving towards the belief that nothing will stop this stock market, since no negative “news” has been able to put a dent in this rally.
“From a purely technical point of view, if a bear market is born this month it would have to be considered the result of some sort of ‘immaculate conception,’” wrote Doug Ramsey, chief investment officer of the Leuthold Group.
Ramsey cited a “remarkable level of bullish ‘agreement’ across the U.S. stock market” for his positive views on the market, which he said “stacks the odds heavily against an imminent cyclical top,” although he said that it was still possible that stocks saw a “short-term setback.”
Well, when was the last time that a remarkable level of bullish agreement has led to a major rally continuation? If the money managers are “all-in,” I am not sure there is a lot of upside left in this market before we finally see a multi-month pullback or larger consolidation.
Several years ago, we set our target for the S&P500 between 2537-2611. While it may not seem like such a stretch of the imagination right now, consider that the market was in the 1800 region at the time we set this target, and most market participants were awaiting the certain market crash just around the corner. In fact, we maintained our strong conviction for this rally to 2500+ no matter who won the election in 2016. And, the fact that Trump won and we still rallied, despite most expectations to the contrary, supports our larger degree perspective.
But, now, we are in what we consider a “topping” zone. While the market can still push higher by another 50 points or so, I think we will be moving into a multi-month pullback as we move into 2018.
I have attached my long-term chart, which I have posted publicly on occasion over the last several years. And, for those that recognize it, you will know it has been quite an excellent road map for the US stock market. In fact, while many were calling for the “crash” back in early 2016, this chart was pointing straight up towards the 2500+ region.
Ultimately, this chart suggests that we will not likely see a 15%+ correction in the market until we complete waves (4) and (5). But, even after a 15%+ correction, which seems to be setting up for 2019 (just in time for our next Presidential election), the market will likely be heading higher into the early 2020’s, and will likely eclipse the 3000 region no matter who is elected President in 2020.
See charts illustrating the wave counts on the S&P 500.
Avi Gilburt is a widely followed Elliott Wave technical analyst and author of ElliottWaveTrader.net (www.elliottwavetrader.net), a live Trading Room featuring his intraday market analysis (including emini S&P 500, metals, oil, USD & VXX), interactive member-analyst forum, and detailed library of Elliott Wave education.

**NEW** As part of the ongoing process to offer new and up-to-date information regarding seasonal and technical investing, we are adding a section to the daily reports that details the stocks that are entering their period of seasonal strength, based on average historical start dates. Stocks highlighted are for information purposes only and should not be considered as advice to purchase or to sell mentioned securities. As always, the use of technical and fundamental analysis is encouraged in order to fine tune entry and exit points to average seasonal trends.
Click for larger images:

Callaway Golf Co (NYSE:ELY) Seasonal Chart

Six Flags Entertainment Corp. (NYSE:SIX) Seasonal Chart

MSG Networks Inc. (NYSE:MSGN) Seasonal Chart

Northern Dynasty Minerals (TSE:NDM) Seasonal Chart

Viacom Inc – Class B (NASD:VIAB) Seasonal Chart

CBS Corp. (NYSE:CBS) Seasonal Chart

West Fraser Timber Co. Ltd. (TSE:WFT) Seasonal Chart

Time Warner Inc. (NYSE:TWX) Seasonal Chart

Ball Corporation (NYSE:BLL) Seasonal Chart

Capstone Mining (TSE:CS) Seasonal Chart

American Software, Inc. (NASD:AMSWA) Seasonal Chart

The Home Depot, Inc. (NYSE:HD) Seasonal Chart

WestJet Airlines Ltd. (TSE:WJA) Seasonal Chart
Market Outlook
The Markets
Another day of mild gains for stocks saw major benchmarks in the US remained pinned to all-time high levels as investors hold the tape steady in the midst of the ongoing earnings season. The S&P 500 Index added close to two-tenths of one percent, remaining firmly embedded in overbought territory according to a number of momentum indicators. So far, there has been a lack of catalysts to fuel a significant move in broad market benchmarks in either direction, but, as we enter the heart of the earnings season, the number of potential catalysts increases exponentially as more and more companies release results. Typically, by the third week of earnings season, investors will have a good sense of the health of corporate America and price in their expectations of future results accordingly. We are presently in the second week of earnings, which unofficially got underway closer to the end of last week.


Of course, it was during the third week of earnings season in October of 1987 that one of the worst one day declines was recorded. On Monday, October 19, 1987, the S&P 500 Index shed 20.5% in a session that has become known as “Black Monday.” The benchmark relinquished the over 36% gain accumulated through the first eight months of the year in just a few sessions, closing the year in a flat position. Turning to the present day, the over 14% gain recorded in 2017 is nowhere near the excess achieved in 1987 and technical parameters are not suggestive of an imminent collapse to the magnitude that was recorded back then. The most simple of the technical parameters is the benchmark’s position relative to its 200-day moving average. On the Friday prior to Black Monday of ‘87, the S&P 500 Index plunged firmly below its 200-day moving average, setting the stage for the panic selling that was to follow. Equity market performance, on an intermediate basis, tends to weaken significantly when the long-term 200-day moving average is violated. The S&P 500 Index is currently holding 6% above this significant average, presenting a sizeable downside risk, but certainly nothing that could be deemed cataclysmic, as it was back then. The last time the S&P 500 Index closed below the 200-day moving average was in March of 2016 when the large-cap benchmark was bound by a massive trading range that spanned the course of a couple of years. So while comparisons are made of the present market to what existed 30 years ago, a simple technical analysis suggests that similar risk of a waterfall plunge is not on the horizon, but a check-back of levels closer to the rising 200-day moving average would not be unexpected. The benchmark typically reverts to the long-term mean around once every 18 months, on average.

On the economic front, manufacturing data out of the new york region continues to suggest strength in this segment of the economy. The Empire State Manufacturing Survey showed a headline print of +30.2, one of the best readings since the economy emerged from recession in 2009. Stripping out the seasonal adjustment, the gauge of manufacturing activity actually improved to +22.7, from +21.1 previous. This is the best October level since 2009 when the index peaked at +27.3. The average level for this time of year is +2.5. Seasonally, manufacturing activity tends to wind down for the year in the fourth quarter, therefore it is rare to see improvement into this slower period following the average peak in September. Manufacturing activity tends to ramp up again in the first few months of the year as inventories are depleted following the fourth quarter consumer spending season.

This strength in manufacturing activity, not only in the US, but around the world, has had a direct influence on the price of copper, which is breaking out again. The price of the industrial metal started to ramp higher a year ago as manufacturing activity started to rebound from the recessionary conditions in this segment of the economy in the years prior. A trend of lower-lows and lower-highs was broken and a trend of higher-highs and higher-lows began. The price of the metal shot higher this summer when some of the manufacturing gauges, such as those presented above, started to show sustained strength. Monday’s breakout projects a move back to previous resistance around $3.70, based on a head-and-shoulders bottoming pattern that has been charted over the past few years. Seasonally, the price of the commodity tends to rise between the end of the year through the month of April, benefitting from the increased demand related to the rebound in manufacturing activity during the spring.

 Seasonal Chart")

Sentiment on Monday, as gauged by the put-call ratio, ended bearish at 1.17. This is one of the highest levels of the year, suggestive of risk aversion as portfolio managers seek to hedge their long exposure.

Sectors and Industries entering their period of seasonal strength:

DISCRETIONARY Relative to the S&P 500 


Seasonal charts of companies reporting earnings today:
 Seasonal Chart")
 Seasonal Chart")
 Seasonal Chart")
 Seasonal Chart")
 Seasonal Chart")
 (GS) Seasonal Chart")
 Seasonal Chart")
 Seasonal Chart")
 Seasonal Chart")
 Seasonal Chart")
 Seasonal Chart")
 Seasonal Chart")
 (PGR) Seasonal Chart")
 Seasonal Chart")
 Seasonal Chart")
 Seasonal Chart")
 Seasonal Chart")
 Seasonal Chart")
 Seasonal Chart")
 Seasonal Chart")
S&P 500 Index


TSE Composite


Callaway Golf Co (NYSE:ELY) Seasonal Chart
Six Flags Entertainment Corp. (NYSE:SIX) Seasonal Chart
MSG Networks Inc. (NYSE:MSGN) Seasonal Chart
Northern Dynasty Minerals (TSE:NDM) Seasonal Chart
Viacom Inc – Class B (NASD:VIAB) Seasonal Chart
CBS Corp. (NYSE:CBS) Seasonal Chart
West Fraser Timber Co. Ltd. (TSE:WFT) Seasonal Chart
Time Warner Inc. (NYSE:TWX) Seasonal Chart
Ball Corporation (NYSE:BLL) Seasonal Chart
Capstone Mining (TSE:CS) Seasonal Chart
American Software, Inc. (NASD:AMSWA) Seasonal Chart
The Home Depot, Inc. (NYSE:HD) Seasonal Chart
WestJet Airlines Ltd. (TSE:WJA) Seasonal Chart

-
I know Mike is a very solid investor and respect his opinions very much. So if he says pay attention to this or that - I will.
~ Dale G.
-
I've started managing my own investments so view Michael's site as a one-stop shop from which to get information and perspectives.
~ Dave E.
-
Michael offers easy reading, honest, common sense information that anyone can use in a practical manner.
~ der_al.
-
A sane voice in a scrambled investment world.
~ Ed R.
Inside Edge Pro Contributors

Greg Weldon

Josef Schachter

Tyler Bollhorn

Ryan Irvine

Paul Beattie

Martin Straith

Patrick Ceresna

Mark Leibovit

James Thorne

Victor Adair