
Stocks & Equities
For 3pm PST Wednesday October 4 , 2017
DOW + 20 on 59 net declines
NASDAQ COMP + 3 on 16 net advances
SHORT TERM TREND Bullish
INTERMEDIATE TERM Bullish
STOCKS: The market was pretty much flat on Wednesday with a mild upward bias. Helping hold things up may have been a somewhat better than expected ISM number. Also, Warren Buffett was on the wire stating that he liked the stock market. This was probably a minor, but positive influence.
GOLD: Gold inched up from an oversold condition. Still looks bearish.
CHART: The Russell 2000 was lower today. Frequently, it leads the Dow and S&P 500. We’ll soon see. Like tomorrow.

BOTTOM LINE: (Trading)
Our intermediate term system is on a buy.
System 7 We are long the SSO from 95.27. Move your stop to 97.27.
System 8 We are in cash. Stay there for now.
System 9 We are in cash.
NEWS AND FUNDAMENTALS: Oil inventories were down 6 million barrels. Last week they were down 1.6 million. The ADP employment report showed 135,000 jobs added, less than the expected 140,000. The ISM non manufacturing index was 59.8, better than the consensus 55.5..
INTERESTING STUFF: You must not fight too often with one enemy, or you will teach him all your art of war. ——–
Napoleon Bonaparte
TORONTO EXCHANGE: Toronto gained 24.
BONDS: Bonds were slightly higher.
THE REST: The dollar had a slight pullback. Crude oil was again lower.
Bonds –Bearish as of September 27.
U.S. dollar – Bullish as of September 13.
Euro — Bearish as of September 13.
Gold —-Bearish as of Sept. 11.
Silver—- Bearish as of Sept. 11.
Crude oil —-Bearish as of October 2.
Toronto Stock Exchange—- Bullish as of September 20, 2017.
We are on a long term buy signal for the markets of the U.S., Canada, Britain, Germany and France.

INDICATOR PARAMETERS
Monetary conditions (+2 means the Fed is actively dropping rates; +1 means a bias toward easing. 0 means neutral, -1 means a bias toward tightening, -2 means actively raising rates). RSI (30 or below is oversold, 80 or above is overbought). McClellan Oscillator ( minus 100 is oversold. Plus 100 is overbought). Composite Gauge (5 or below is negative, 13 or above is positive). Composite Gauge five day m.a. (8.0 or below is overbought. 13.0 or above is oversold). CBOE Put Call Ratio ( .80 or below is a negative. 1.00 or above is a positive). Volatility Index, VIX (low teens bearish, high twenties bullish), VIX % single day change. + 5 or greater bullish. -5 or less, bearish. VIX % change 5 day m.a. +3.0 or above bullish, -3.0 or below, bearish. Advances minus declines three day m.a.( +500 is bearish. – 500 is bullish). Supply Demand 5 day m.a. (.45 or below is a positive. .80 or above is a negative). Trading Index (TRIN) 1.40 or above bullish. No level for bearish.
No guarantees are made. Traders can and do lose money. The publisher may take positions in recommended securities.

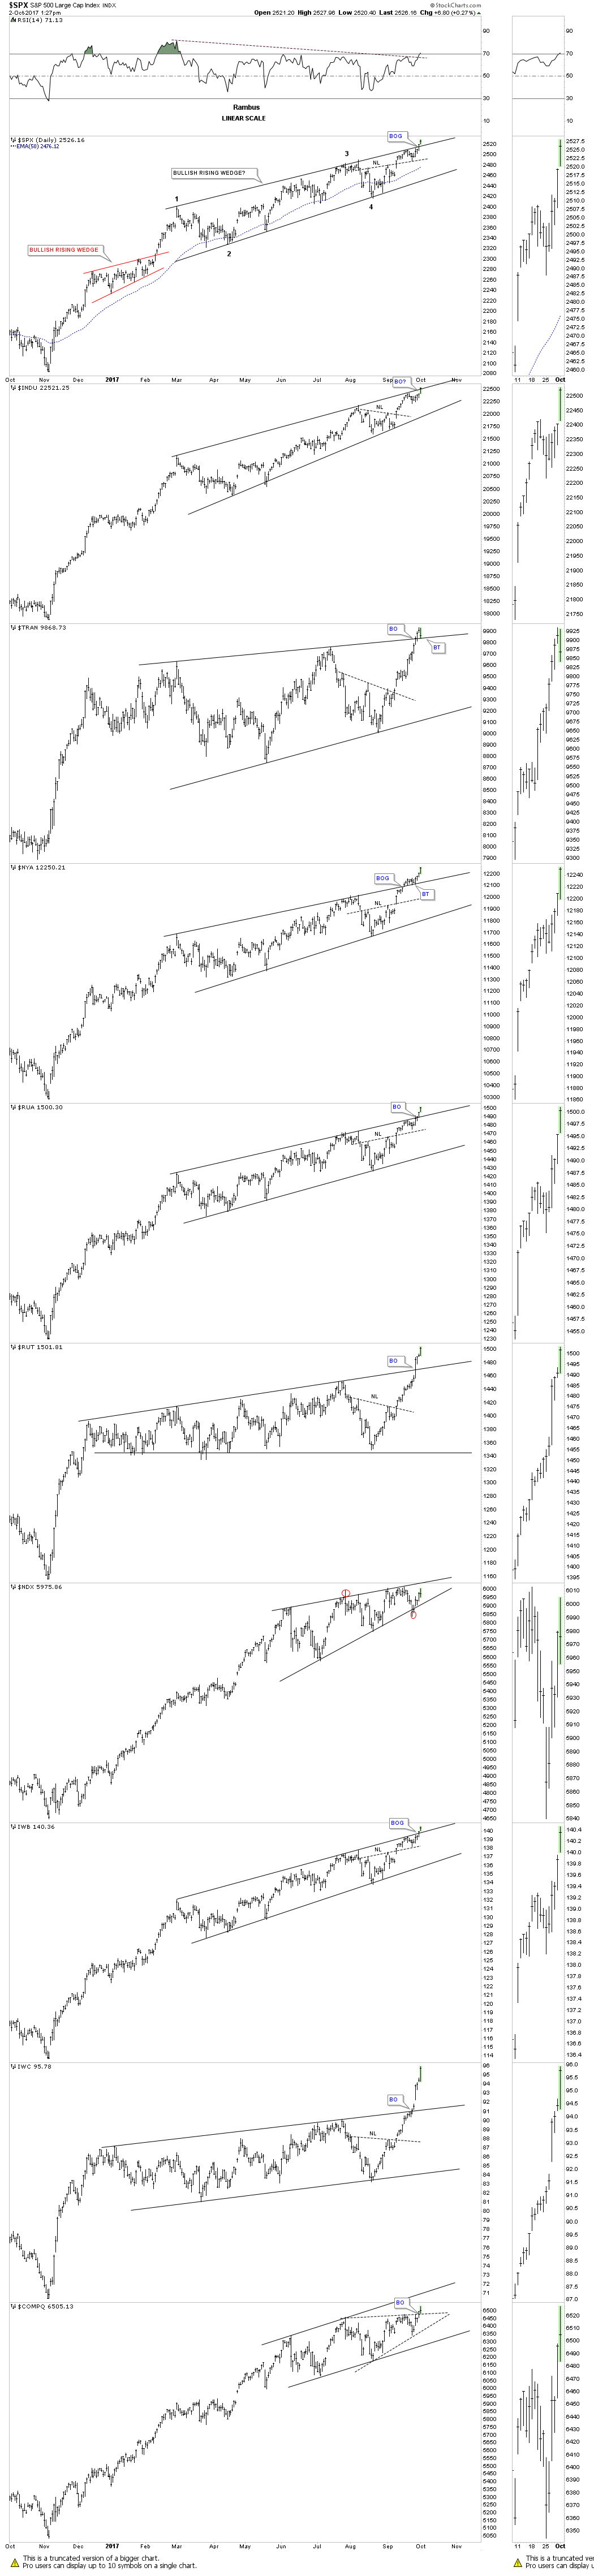
All the different stock market indexes have now broken out above the top rail of their rising patterns except for the two tech indexes. The IWC, micro caps, continues to be the strongest sector. I know it may not feel like it, but rising wedges and flags that slope up in the same direction of the uptrend tells us the uptrend is very strong.

 Investing icon Warren Buffett told CNBC on Tuesday that his Berkshire Hathaway empire is holding off on selling any stocks to see how the tax reform situation plays out in Washington.
Buffett told CNBC on Tuesday that the odds of getting a tax plan passed are higher than what most people expect, but expressed uncertainty over the reforms.
“We may or may not have a change in the tax code,” Buffett, the chairman and CEO of Berkshire Hathaway, told CNBC.
Investors are also watching out for progress on President Donald Trump’s tax reform plan, which calls for lowering corporate tax to 20 percent, Reuters reported.
…..related:
 Back in June, one of Wall Street’s more philosophical derivatives strategists, DB’s Aleksandar Kocic looked at the state of the market and postulated that far from “stable” the existing risk “equilibrium” is one which can be described as “metastable“, the result of widespread complacency, and which he compared to an avalanche where “a totally innocuous event can trigger a cataclysmic event (e.g. a skier’s scream, or simply continued snowfall until the snow cover is so massive that its own weight triggers an avalanche.” Putting it in his usual post-modernist style, Kocic said that “complacency encourages bad behavior and penalizing dissent – there is a negative carry for not joining the crowd, which further reinforces bad behavior.”
Kocic framed the current state of the market as follows:
This chart is making the rounds on Twitter right now. Liz Ann Sonders (@LizAnnSonders), Chief Investment Strategist at Charles Schwab, brought it to our attention. It shows the maximum drawdown in the S&P 500 each year going back to 1914 with our current year the shallowest in history.

Combine that with not a single US stock showing up in Ben Graham’s “deep value” screen and record levels of borrowing by individuals to buy stocks at these prices and you have an interesting set-up in the making.

-
I know Mike is a very solid investor and respect his opinions very much. So if he says pay attention to this or that - I will.
~ Dale G.
-
I've started managing my own investments so view Michael's site as a one-stop shop from which to get information and perspectives.
~ Dave E.
-
Michael offers easy reading, honest, common sense information that anyone can use in a practical manner.
~ der_al.
-
A sane voice in a scrambled investment world.
~ Ed R.
Inside Edge Pro Contributors

Greg Weldon

Josef Schachter

Tyler Bollhorn

Ryan Irvine

Paul Beattie

Martin Straith

Patrick Ceresna

Mark Leibovit

James Thorne

Victor Adair