
Stocks & Equities
If you’re not just a little bit nervous before a match, you probably don’t have the expectations of yourself that you should have. Hale Irwin
This is a topic that financial writers should cover in more depth, but it also needs to be covered accurately. From the very beginning individuals have been trained to view crashes as disasters, and in doing so, they miss an opportunity of a lifetime. One has to wonder why so many experts almost purposely go out of their way to proclaim the next crash will mark the end of everything. History is not on their side and the average person having failed to examine history is none the wiser. When experts start to make a lot of noise one has to understand that it is being done to redirect one’s attention; the masses always fall for this ploy. Stock market crashes are perfect examples of misdirection; the crowd is directed to fixate on the fear factor and not the opportunity factor. The dumb money always buys close to the top and sells close to the bottom, and the smart money always does the opposite.

Click Chart For larger version Chart provided courtesy of http://www.macrotrends.net
One of the best ways to determine optimal entry and exit points is to pay close attention to the mass sentiment. When the masses are joyous, then it is usually time to exit the markets and vice versa.
A very strong correction is going to hit this market sooner or later, and our goal is to use the trend indicator to get out close to the top. We are not going bother trying to get out at the exact top; the goal is to get out when the trend indicator starts to flash warning signals, and sentiment levels start to rise. The best lesson you could impart to your kids and grandkids is to teach them view stock market crashes through a bullish lens. This lesson is probably more valuable than anything they could ever hope to gain from the public education system.
Conclusion
Before we got off the Gold Standard, it would have been quite risky to view back breaking corrections as buying opportunities. If you look at the chart above and you take a long-term view, you can see that every back-breaking correction turned out to be a mouth-watering opportunity; this argument will hold true for the foreseeable future.
The crowd, however, will forget the opportunity factor the moment the markets start to crash They will utter these words “it’s different this time”. It is always different because fear has a way of making something look worse than it is.
In reality, nothing has changed; the crowd always reacts in the same manner. Instead of seeing opportunity, they will see disaster. Their response (as always) will be to throw the baby out with the bath water. The smart money waits for them to stampede, and when they have sold everything, they swoop in and purchase top companies for next to nothing. The masses, in turn, remain shell-shocked for years as the markets trend higher, then all of a sudden the memory of the last beating fades away and the process repeats itself again and again. This is what’s taking place now, and that is why this stock market Bull continues to trend higher than even the most ardent of bulls could have ever envisioned.

The masses have still not embraced it, but they are slowly warming up to it. Instead of a crash, the markets are more likely to experience a strong correction, as they are trading in the extremely overbought ranges. Until the crowd embraces this market with the same intensity that has gripped bitcoin, this market is unlikely to crash.
A long dispute means that both parties are wrong
Voltaire
By Sol


The BBC has come out and reported that three million savers in Britain in what is known as final-salary pension schemes only have a 50/50 chance of receiving the payouts they were promised, a study has concluded. We issued a special report on the rising Pension Crisis and it has been unfolding on schedule. The odds of those in government receiving what they were promised is probably less than 50/50 worldwide with few exceptions.
This year’s WEC we will look at how to survive this crisis now that the Year from Political Hell is coming to an eventful end as Spain sends in 16,500 troops to invade Barcelona and subjugate Catalonia proving that it is still a fascist state. The last on the list will be the Italian election and the way Germany has gone, expect more of the same.
We will address this issue in a special report for many people asking how to survive this crisis when what you thought your future would be comes crashing down. This is the crisis we face in Democracy. Government will become more Draconian as we see in Spain to retain power. To hell with human rights or even what is moral. Government will only act in its own self-interest.
 Norway – The Largest Sovereign Wealth Fund in the World
QUESTION: Martin,
There are several news stories this past week reporting that Norway’s pension fund has reached $1 trillion dollars, or $190,000 per citizen. Are there some countries like Norway that will survive the coming pension crisis?
Thank You,
Alex
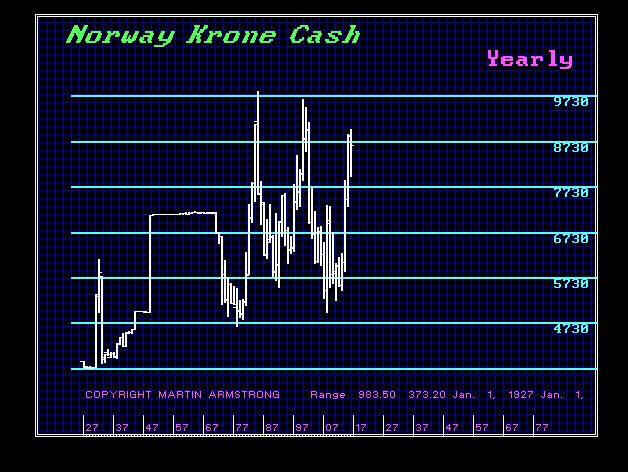
ANSWER: Not many. They are far and few between because Europe, Asia, and North America (USA/Canada) as a whole have only made promises rather than funding. Norway is the largest Sovereign Wealth Fund in the world. Norway has gotten where it is because they do NOT follow the brain-dead crowd of government debt is safe. Norway’s sovereign wealth fund has been one of the earliest to shift investment from public sector bonds to equities. They have risen to the largest fund in the world for recognizing the shift from public to private sector investments. Norway is the exception to the pension crisis.
….also from Martin:
Politicians Start to Run Away from Global Warming
A quick look at any of the US majors will show most investors that the markets have recently been pushing upward towards new all-time highs. These traditional market instruments can be misleading at times when relating the actual underlying technical and fundamental price activities. Today, we are going to explore some research using our custom index instruments that we use to gauge and relate more of the underlying market price action.
What if we told you to prepare for a potentially massive price swing over the next few months? What if we told you that the US and Global markets are setting up for what could be the “October Surprise of 2017” and very few analysts have identified this trigger yet? Michael Bloomberg recently stated “I cannot for the life of me understand why the market keeps going up”. Want to know why this perception continues and what the underlying factors of market price activity are really telling technicians?
At ATP provide full-time dedicated research and trading signal solution for professional and active traders. Our research team has dedicated thousands or hours into developing a series of specialized modeling systems and analysis tools to assist us in finding successful trading opportunities as well as key market fundamentals. In the recent past, we have accurately predicted multiple VIX Spikes, in some cases to the exact day, and market signals that have proven to be great successes for our clients. Today, we’re going to share with you something that you may choose to believe or not – but within 60 days, we believe you’ll be searching the internet to find this article again knowing ATP (ActiveTradingPartners.com) accurately predicted one of the biggest moves of the 21st century. Are you ready?
Let’s start with the SPY. From the visual analysis of the chart, below, it would be difficult for anyone to clearly see the fragility of the US or Global markets. This chart is showing a clearly bullish trend with the perception that continued higher highs should prevail.

Additionally, when we review the QQQ we see a similar picture. Although the volatility is typically greater in the NASDAQ vs. the S&P, the QQQ chart presents a similar picture. Strong upward price activity in addition to historically consistent price advances. What could go wrong with these pictures – right? The markets are stronger than ever and as we’ve all heard “it’s different this time”.

Most readers are probably saying “yea, we’ve heard it before and we know – buy the dips”.
Recently, we shared some research with you regarding longer term time/price cycles (3/7/10 year cycles) and prior to that, we’ve been warning of a Sept 28~29, 2017 VIX Spike that could be massive and a “game changer” in terms of trend. We’ve been warning our members that this setup in price is leading us to be very cautious regarding new trading signals as volatility should continue to wane prior to this VIX Spike and market trends may be muted and short lived. We’ve still made a few calls for our clients, but we’ve tried to be very cautious in terms of timing and objectives.
Right now, the timing could not be any better to share this message with you and to “make it public” that we are making this prediction. A number of factors are lining up that may create a massive price correction in the near future and we want to help you protect your investments and learn to profit from this move and other future moves. So, as you read this article, it really does not matter if you believe our analysis or not – the proof will become evident (or not) within less than 60 days based on our research. One way or another, we will be proven correct or incorrect by the markets.
Over the past 6+ years, capital has circled the globe over and over attempting to find suitable ROI. It is our belief that this capital has rooted into investment vehicles that are capable of producing relatively secure and consistent returns based on the global economy continuing without any type of adverse event. In other words, global capital is rather stable right now in terms of sourcing ROI and capital deployment throughout the globe. It would take a relatively massive event to disrupt this capital process at the moment.
Asia/China are pushing the upper bounds of a rather wide trading channel and price action is setting up like the SPY and QQQ charts, above. A clear upper boundary is evident as well as our custom vibrational/frequency analysis arcs that are warning us of a potential change in price trend. You can see from the Red Arrow we’ve drawn, any attempt to retest the channel lows would equate to an 8% decrease in current prices.

Still, there is more evidence that we are setting up for a potentially massive global price move. The metals markets are the “fear/greed” gauge of the planet (or at least they have been for hundreds of years). When the metals spike higher, fear is entering the markets and investors avoid share price risks. When the metals trail lower, greed is entering the markets and investors chase share price value.
Without going into too much detail, this custom metals chart should tell you all you need to know. Our analysis is that we are nearing the completion of Wave C within an initial Wave 1 (bottom formation) from the lows in Dec 2016. Our prediction is that the completion of Wave #5 will end somewhere above the $56 level on this chart (> 20%+ from current levels). The completion of this Wave #5 will lead to the creation of a quick corrective wave, followed by a larger and more aggressive upward expansion wave that could quickly take out the $75~95 levels. Quite possibly before the end of Q1 2018.

We’ve termed this move the “Rip your face off Metals Rally”. You can see from this metals chart that we have identified multiple cycle and vibrational/frequency cycles that are lining up between now and the end of 2017. It is critical to understand the in order for this move to happen, a great deal of fear needs to reenter the global markets. What would cause that to happen??
Now for the “Hidden Gem”…
We’ve presented some interesting and, we believe, accurate market technical analysis. We’ve also been presenting previous research regarding our VIX Spikes and other analysis that has been accurate and timely. Currently, our next VIX Spike projection is Sept 28~29, 2017. We believe this VIX Spike could be much larger than the last spike highs and could lead to, or correlate with, a disruptive market event. We have ideas of what that event might be like, but we don’t know exactly what will happen at this time or if the event will even become evident in early October 2017. All we do know is the following…
The Head-n-Shoulders pattern we first predicted back in June/July of this year has nearly completed and we have only about 10~14 trading days before the Neck Line will be retested. This is the Hidden Gem. This is our custom US Index that we use to filter out the noise of price activity and to more clearly identify underlying technical and price pattern formations. You saw from the earlier charts that the Head-n-Shoulders pattern was not clearly visible on the SPY or QQQ charts – but on THIS chart, you can’t miss it.
It is a little tough to see on this small chart but, one can see the correlation of our cycle analysis, the key dates of September 28~29 aligning perfectly with vibration/frequency cycles originating from the start of the “head” formation. We have only about 10~14 trading days before the Neck Line will likely be retested and, should it fail, we could see a massive price move to the downside.

What you should expect over the next 10~14 trading days is simple to understand.
_ Expect continued price volatility and expanded rotation in the US majors.
_ Expect the VIX to stay below 10.00 for only a day or two longer before hinting at a bigger spike move (meaning moving above 10 or 11 as a primer)
_ Expect the metals markets to form a potential bottom pattern and begin to inch higher as fear reenters the markets
_ Expect certain sectors to show signs of weakness prior to this move (possibly technology, healthcare, bio-tech, financials, lending)
_ Expect the US majors to appear to “dip” within a 2~4% range and expect the news cycles to continue the “buy the dip” mantra.
The real key to all of this is what happens AFTER October 1st and for the next 30~60 days after. This event will play out as a massive event or a non-event. What we do know is that this event has been setting up for over 5 months and has played out almost exactly as we have predicted. Now, we are 10+ days away from a critical event horizon and we are alerting you well in advance that it is, possibly, going to be a bigger event.
Now, I urge all of you to visit our website to learn more about what we do and how we provide this type of advanced analysis and research for our clients. We also provide clear and timely trading signals to our clients to assist them in finding profitable trading opportunities based on our research. Our team of dedicated analysts and researchers do our best to bring you the best, most accurate and advanced research we can deliver. The fact that we called this Head-n-Shoulders formation back in June/July and called multiple VIX Spike events should be enough evidence to consider this call at least a strong possibility.
If you want to take full advantage of the markets to profit from these moves, then join today at www.ActiveTradingPartners.com and become a member.


![]()
In This Week’s Issue:
- Stockscores Webinar – How to Profit from the Stockscores Indicators
- Stockscores’ Market Minutes Video – Risk Management Matters
- Stockscores Trader Training – Return on Capital
- Stock Features of the Week – Opportunities in ETFs
Stockscores Webinar – How to Profit from the Stockscores Indicators
There are a number of unique indicators offered through the Stockscores Market Scan and for use on Tradestation. During the presentation, Stockscores founder Tyler Bollhorn will demonstrate their use and power, and provide the back story on how they came to be. http://www.stockscores.com/trader-training/upcoming-events/#events
Stockscores Market Minutes – Risk Management Matters
It is more important to manage risk on your trades than it is to make the right trades. You won’t be right all of the time so it is essential to limit the size of your losses. When you have a winner, let it run since the winning trades have to pay for the losers. Trade of the week on $FDX. Click Here to Watch
To get instant updates when I upload a new video, subscribe to the Stockscores YouTube Channel
Trader Training – Return on Capital
A Stockscores user asked me a question that I think many people have, “If you have more trade opportunities than capital, how do you pick which trades to take?”
The short and simple answer is to take the trades that give you the most bang for your buck. Let me explain.
We size our trade positions based on the risk of the trade. The risk of the trade is the difference between the entry price and the stop loss price. Divide the risk in to your risk tolerance amount and you have the number of shares you can buy.
Consider two trade possibilities, each with strong charts that show the same potential for price appreciation. The first has an entry price of $5 with support, and therefore our stop loss point, at $4.50. That means there is $0.50 of downside, or the potential for a 10% drawdown.
The second trade has an entry price of $20 with a $19 support price and stop loss point. On this trade, if wrong, we stand to lose $1 per share or 5% drawdown, since $1/$20 is 5%.
If we are willing to risk $500 on each trade, we will buy 1000 shares of the $5 stock for a total cost of $5,000 and 500 shares of the $20 stock for a total cost of $10,000. Each trade has the same amount of risk but the second trade requires more capital because the stock is less volatile. That also means the expectation for percentage gain on the second position is also less. The price volatility on the entry signal is a good predictor of what price volatility will be in the trend.
Clearly, the first trade gives more bang for the buck. We can use less capital for the same profit potential. We may believe both trades have the potential to make $1000 but the first trade will do it with half as much money invested. For a trader with limited capital, the first trade is the one to take.
Generally, lower priced stocks will be more volatile on a percentage basis, making them a source of greater percentage gain potential. You can place less capital in to a low priced stock to get the same dollar upside as a higher priced stock trade.
I did a quick survey of this week’s best gainers to confirm this fact. I ranked the 2000 most actively traded stocks in the US last week by percentage gain and focused on the top 20 gainers. Of the top 20, 17 were under $10. The other 3 were under $20.
The lesson here is to focus on lower priced stocks if you have less capital to trade with. Many will argue that these lower priced stocks are riskier and maybe dangerous for a risk averse trader. They are actually not riskier, they are more volatile. That means you have to take a smaller position size in them so that the risk of the trade does not exceed your risk tolerance.
By adjusting position size based on the difference between the entry price and stop loss price, you can make every stock trade have the same amount of risk. If the stock is volatile buy less. If your amount of capital is insufficient for all the trades you find, focus on the lower priced stocks.
There is one caveat to this style of risk management. Lower priced stocks tend to have an added element of risk because they have a greater potential for price gaps. Lower priced stocks tend to have less established or diversified businesses which means a problem with one of their businesses can have a major impact on share price. It is much easier for a small Biotech stock to gap down 30% on bad news than it is for Pfizer to. That means the low priced stocks you trade could blow through your stop loss point if bad news brings a big price gap.
That makes it important to not put all of your capital in to just a few low priced stocks. If you are going to focus on relatively cheap stocks then you must own a number of them so that a larger than expected loss on one of them does not bring your portfolio performance down significantly.
If you have less capital to trade with than what you would like, focus on the lower priced stocks. You can adjust your Stockscores Market Scans to include a price filter for stocks under $10 or even lower if you like. Just remember to size your positions based on the volatility of the stock, the difference between the entry price and support on the chart, where you will put your loss limit. By doing that, you can match the risk of the trade to your risk tolerance and use less capital to gather the same dollar profit potential.
![]()
I am working on a developing a new strategy for investors who want to trade Exchange Traded Funds. This will utilize weekly charts and seek abnormal action through trendlines. Here is a sneak peak at the sort of ETFs that this strategy will seek out, using either the Stockscores Market Scan on the Stockscores indicators for Tradestation.
1. T.XIU
T.XIU is an ETF based on the TSX 60 index. This market has underperformed the US but the action last week indicates that T.XIU is ready to catch up to its south of the border peers. Support at $22.

2. T.XEG
T.XEG is another recent underperformer, the Canadian Energy sector ETF may finally be turning higher after drifting lower the past 7 months. Support at $10.80.

References
- Get the Stockscore on any of over 20,000 North American stocks.
- Background on the theories used by Stockscores.
- Strategies that can help you find new opportunities.
- Scan the market using extensive filter criteria.
- Build a portfolio of stocks and view a slide show of their charts.
- See which sectors are leading the market, and their components.
Disclaimer
This is not an investment advisory, and should not be used to make investment decisions. Information in Stockscores Perspectives is often opinionated and should be considered for information purposes only. No stock exchange anywhere has approved or disapproved of the information contained herein. There is no express or implied solicitation to buy or sell securities. The writers and editors of Perspectives may have positions in the stocks discussed above and may trade in the stocks mentioned. Don’t consider buying or selling any stock without conducting your own due diligence.
 The U.S. stock market’s latest run to all-time highs could be giving investors a false sense of security.
Market watcher Marc Faber, often hailed as the original “Dr. Doom,” is not backing down from his long-held correction warning — even though nothing has materialized.
“You don’t see, and I don’t see. And, nobody sees. That’s why people keep buying stocks. And yet, something will happen one day,” the publisher of “The Gloom, Boom & Doom Report” said Tuesday.
….read more or view video HERE
…also from Marc:

-
I know Mike is a very solid investor and respect his opinions very much. So if he says pay attention to this or that - I will.
~ Dale G.
-
I've started managing my own investments so view Michael's site as a one-stop shop from which to get information and perspectives.
~ Dave E.
-
Michael offers easy reading, honest, common sense information that anyone can use in a practical manner.
~ der_al.
-
A sane voice in a scrambled investment world.
~ Ed R.
Inside Edge Pro Contributors

Greg Weldon

Josef Schachter

Tyler Bollhorn

Ryan Irvine

Paul Beattie

Martin Straith

Patrick Ceresna

Mark Leibovit

James Thorne

Victor Adair