
Stocks & Equities

![]()
In This Week’s Issue ending September 19, 2017
- Stockscores Webinar – How to Create a Trading Strategy
- Stockscores’ Market Minutes Video – Beware of Parabolic Trends
- Stockscores Trader Training – The Economics of Trading
- Stock Features of the Week – Abnormal Breaks
Stockscores Free Webinar – How to Create a Trading Strategy
Stockscores Founder Tyler Bollhorn will show the steps and thought process to create a new trading strategy, whether you are looking to day, swing or position trade.
Click here to register. http://www.stockscores.com/trader-training/upcoming-events/#events
Stockscores Market Minutes – Beware of Parabolic Trends
This week, a look at what a parabolic trend is in stocks or markets, and the importance of understanding how they affect your trading. Plus, my weekly market analysis and my trade of the week on Ballard Power ($BLDP).
To get instant updates when I upload a new video, subscribe to the Stockscores YouTube Channel
Trader Training – The Economics of Trading
I am often asked, “How much money can you make day trading the stock market?” I understand why people ask the question but it is a question that is hard to answer because there are so many variables. It is like asking, “How much money can you make playing hockey?” For some, it is millions, for others, it only costs them money.
Of course, trading skill is the most important factor. Trading is not complicated, in fact, it is the simple things that work the best. This is not to say that trading is easy; it is actually quite hard but not because it is intellectually demanding. It is just hard for most people to disconnect themselves from their emotional attachment to money.
The rules for most of my trading strategies could be written down on the back of a napkin – they are simple. Executing them properly takes practice and emotional control. For some, that is not too hard. For others, it can be close to impossible.
You do not have to be exceptionally smart to be a good stock trader; I think most people are smart enough. It does take more determination and hard work than a lot of people are willing to invest but the great thing about both of those things is that neither is exclusive. No matter what your age, gender, looks, intelligence, nationality or social status, hard work and determination are achievable.
Before I go in to the economics of trading, let me first explain a few important concepts. The first is risk, the difference between the price you buy a stock and the stop loss point. If you buy a stock at $20 and have a stop loss at $19, you are risking $1 a share.
The reward is the difference between the entry price and the profitable exit price, assuming you are not stopped out with a loss. That stock you bought at $20 has a reward of $5 if you sell it at $25.
The reward for risk is the reward divided by the risk. In this example, the reward for risk is 5 since the profit was $5 for a risk of $1. How much you actually make depends on what your risk tolerance is.
If you are willing to lose $500 on a trade then you would have bought 500 shares in this example. $500 of risk tolerance divided by $1 of risk demands you buy 500 shares. With an exit at $25, you earn $2500 or five times your risk.
How much money did it take to make the $2500? 500 shares of a $20 stock costs you $10,000, assuming you only use your capital. If you use leverage, which most brokerages will give you at 2 to 1 and some brokers will give you at 3 to 1, you lower the capital requirement. With 2 to 1 leverage, you need $5000 to make the $2500 profit. With 3 to 1, you only need $3333. With more leverage, the percentage return goes up but so too does the potential percentage loss.
Now, what can you expect to make in terms of reward for risk? This is where there are variables outside your control that have a big effect on performance. If the market is hot, it is much easier to find winning stocks and the size of those winners will be greater than if the stock is dead. No matter how hard you work or how skilled you are as a trader, you cannot control how many opportunities the stock market is going to give you.
As a general guideline, I think that a skilled trader in a reasonable market can earn an average of 10 times risk in a week. So, if you risk $500 on each trade, you should be able to make $5000. I want to stress, however, that your skill and the state of the market are two very important variables in this calculation.
The final question is how much capital do you need to risk $500 on each trade? Again, the state of the market is an important part of this equation. There are times when the hot sector of the market is the low priced stocks. The size of your position in these stocks tends to be smaller because these stocks are more volatile. You may be able to take $500 or risk with a $5000 position (which with leverage may require less than $2000 of your capital).
In a market where the large cap stocks are the hot area you could need 10 times as much capital to achieve the same amount of risk.
As a general rule, take your risk tolerance and multiply it by 100 to get the required capital, before leverage. So, if you risk $500 you will need $50,000 of capital to take the trades that come to you. If the stocks you trade are smaller, more volatile names, that amount could be a lot less.
Above all else, none of this works if you are a person who approaches the market with a gamblers mentality. Losses are part of trading and you have to be prepared to take the small loss when the market leads you astray. When you get a winner you have to be willing to let the profit run so that the winners can pay for the losers and still leave you some overall profit.
![]()
This week, I ran Abnormal Breaks US scan in search of stocks making strong price gains that were breaking long term downward trend lines. Here are two that look like they may be reversing their downward trends.
1. LLNW
LLNW is breaking out from a short consolidation and should continue its long term upward trend from here. Support at $3.64.

2. DHT
DHT breaking its long term downward trend with strong volume and price action. Support at $3.89.

References
- Get the Stockscore on any of over 20,000 North American stocks.
- Background on the theories used by Stockscores.
- Strategies that can help you find new opportunities.
- Scan the market using extensive filter criteria.
- Build a portfolio of stocks and view a slide show of their charts.
- See which sectors are leading the market, and their components.
Disclaimer
This is not an investment advisory, and should not be used to make investment decisions. Information in Stockscores Perspectives is often opinionated and should be considered for information purposes only. No stock exchange anywhere has approved or disapproved of the information contained herein. There is no express or implied solicitation to buy or sell securities. The writers and editors of Perspectives may have positions in the stocks discussed above and may trade in the stocks mentioned. Don’t consider buying or selling any stock without conducting your own due diligence.

3:00 Pacific. Monday September 18, 2017
DOW + 63 on 384 net advances
NASDAQ COMP + 6 on 623 net advances
SHORT TERM TREND Bullish
INTERMEDIATE TERM Bullish
STOCKS: There is not a lot to analyze about the action on Monday. We thought it might pull back a bit as a reaction to the quadruple expiration on Friday, but no such luck.
There seems to be a group of institutional investors who have missed this rally and they are in a bit of a panic mode. They feel the need to buy every dip no matter how minor. Today for instance, the S&P 500 actually went negative late in the session, but it was bought.
On a fundamental basis, there is anticipation that the recent hurricanes are going to spur buying and repair work, thus increasing corporate profits in companies like Home Depot.
GOLD: Gold was down $14. The Wall Street Journal online attributed it to strength in the greenback. I’m not sure about this. The dollar wasn’t all that strong.
CHART: Sometimes analysts can over think the markets. They forget the “ultimate indicator”. And what is that? Price itself. Just look at the chart. Is that an uptrend? It surely looks like it to me and it has been going on for almost a year. Yes, it’s overbought, but in a bull market, it can stay that way for an extended period.

BOTTOM LINE: (Trading)
Our intermediate term system is on a buy.
System 7 We are in cash. Stay there for now.
System 8 We are in cash. Stay there for now.
System 9 We are in cash.
NEWS AND FUNDAMENTALS: The Housing market index came in at 64, lower than the expected 66. On Tuesday we get housing starts.
INTERESTING STUFF: Happiness is a choice that requires effort at times.—— Aeschylus
TORONTO EXCHANGE: Toronto was up 64.
BONDS: Bonds resumed their decline.
THE REST: The dollar had a minor bounce. Crude oil was down slightly.
Bonds –Bearish as of September 11.
U.S. dollar – Bullish as of September 13.
Euro — Bearish as of September 13.
Gold —-Bearish as of Sept. 11.
Silver—- Bearish as of Sept. 11.
Crude oil —-Bullish as of September 13.
Toronto Stock Exchange—- Bearish as of June 14, 2017.
We are on a long term buy signal for the markets of the U.S., Canada, Britain, Germany and France.

Monetary conditions (+2 means the Fed is actively dropping rates; +1 means a bias toward easing. 0 means neutral, -1 means a bias toward tightening, -2 means actively raising rates). RSI (30 or below is oversold, 80 or above is overbought). McClellan Oscillator ( minus 100 is oversold. Plus 100 is overbought). Composite Gauge (5 or below is negative, 13 or above is positive). Composite Gauge five day m.a. (8.0 or below is overbought. 13.0 or above is oversold). CBOE Put Call Ratio ( .80 or below is a negative. 1.00 or above is a positive). Volatility Index, VIX (low teens bearish, high twenties bullish), VIX % single day change. + 5 or greater bullish. -5 or less, bearish. VIX % change 5 day m.a. +3.0 or above bullish, -3.0 or below, bearish. Advances minus declines three day m.a.( +500 is bearish. – 500 is bullish). Supply Demand 5 day m.a. (.45 or below is a positive. .80 or above is a negative). Trading Index (TRIN) 1.40 or above bullish. No level for bearish.
No guarantees are made. Traders can and do lose money. The publisher may take positions in recommended securities.
 Back in mid-July, we called for the market to top within 3 weeks between 2487-2500. And, 3 weeks later, the market topped at 2490SPX within one day of the topping date we expected. And, since we struck that high, the market has followed through in an almost textbook fashion for the entire month of August, as we caught just about every twist and turn during the month.
Coming into the last week of August, we were expecting the market to drop down to support within the 2425-2430SPX region, and then rally back towards the 2465-2475 region, before it set up to drop back down to the 2400SPX region. As we now know, dropped hard and bottomed early that week at 2428SPX, and then rallied back to 2480SPX. When the market topped out at 2480 on September 1st, our expectation was that we would see a drop down to the 2400SPX region next.
While the market dropped 34 points from that level within the next trading day, when it came back up through 2460SPX I posted to all our members that we now have opened the door to the 2500-2510SPX region, rather than an immediate continuation down to the 2400SPX region. The main reason was that when the market did not follow through on our Fibonacci Pinball set up towards 2400SPX and came back up through the 2460SPX region, the market provided us with a strong warning that the downside follow through was much less likely. As of Friday, we have finally struck the 2500SPX region.
As I write my weekly articles about how one should ignore exogenous factors such as news or geo-political events when analyzing the markets, I always get a number of people who will argue with me. They see a single news event coincide with a directional move in the market and are absolutely convinced that the particular news event was the “obvious” cause of that market move. They then extrapolate this experience and believe that news and geo-politics are always what drives the markets.
Yet, I remain steadfast in my belief that maintaining such expectations is intellectually dishonest, as it requires you to ignore the many times that markets do not act in the manner most would believe based upon the news or geo-political events.
When the market was whipsawing around in August, and we were catching most of the turns, many of these commenters would proclaim:
“in this instance there is no doubt the driver here is Korea”
“Korea matters”
These people, who believe the market is driven by exogenous factors, have a real problem today.
If you were paying attention over the last two weeks since the market broke back over 2460SPX, we have had two of the worst weather events in recent times, which have caused damage estimating over $200 billion dollars. To put the true extent of this damage into perspective, this is reportedly about half of the combined costs of all hurricanes over the past 50 years, including Katrina ($133 billion), Sandy ($75 billion) and Andrew ($46 billion).
Moreover, during the past two weeks, we have faced further terrorist attacks along with further provocation by North Korea. Yes, the same North Korea that is “no doubt the driver” of the market.
To be more specific, not only did the hours between the Thursday evening market close and Friday morning market open see another North Korean rocket fire over Japan, we also witnessed yet another terrorist attack in London.
For those counting, that is two major negative geo-political events occurring while the market was closed before its Friday morning open. And, anyone that was so certain that “there is no doubt the driver here is Korea” was likely looking for a major red opening on Friday morning, especially when you couple it with the terrorist attack occurring before the open too.
Yet, what did the market do after it opened on Friday morning? You got it! We rallied to hit new all-time highs, and finally eclipsed the 2500SPX mark.
Again, those that believe in exogenous causation for market moves must be stumped. How can this be possible? Surely, the market must be manipulated, right? I mean, this really can’t happen in real life!?
So, allow me to remind you about some studies I like to post every now and then:
In a 1988 study conducted by Cutler, Poterba, and Summers entitled “What Moves Stock Prices,” they reviewed stock market price action after major economic or other type of news (including major political events) in order to develop a model through which one would be able to predict market moves RETROSPECTIVELY. Yes, you heard me right. They were not even at the stage yet of developing a prospective prediction model.
However, the study concluded that “[m]acroeconomic news . . . explains only about one fifth of the movements in stock market prices.” In fact, they even noted that “many of the largest market movements in recent years have occurred on days when there were no major news events.” They also concluded that “[t]here is surprisingly small effect [from] big news [of] political developments . . . and international events.” They also suggest that:
“The relatively small market responses to such news, along with evidence that large market moves often occur on days without any identifiable major news releases casts doubt on the view that stock price movements are fully explicable by news. . . “
In August 1998, the Atlanta Journal-Constitution published an article by Tom Walker, who conducted his own study of 42 years’ worth of “surprise” news events and the stock market’s corresponding reactions. His conclusion, which will be surprising to most, was that it was exceptionally difficult to identify a connection between market trading and dramatic surprise news. Based upon Walker’s study and conclusions, even if you had the news beforehand, you would still not be able to determine the direction of the market only based upon such news.
In 2008, another study was conducted, in which they reviewed more than 90,000 news items relevant to hundreds of stocks over a two-year period. They concluded that large movements in the stocks were NOT linked to any news items:
“Most such jumps weren’t directly associated with any news at all, and most news items didn’t cause any jumps.”
But, I can assure you that the great majority will simply shrug this off for whatever reason they want to believe. They will don their blinders, and simply ignore the actions over the last few weeks, since it does not fit their overall perspective about markets. In other words, they will continue to fool themselves. After all, Ben Franklin put it quite well when he noted:
“So convenient a thing is it is to be a reasonable creature, since it enables one to find or to make a reason for everything one has a mind to do.”
If these past few weeks were not enough to convince you that exogenous factors to not drive the market, about a month ago, I provided you with a list of all the “reasons” most market participants have been expecting the stock market to crash:
Brexit – NOPE
Frexit – NOPE
Grexit – NOPE
Italian referendum – NOPE
Rise in interest rates – NOPE
Cessation of QE – NOPE
Terrorist attacks – NOPE
Crimea – NOPE
Trump – NOPE
Market not trading on fundamentals – NOPE
Low volatility – NOPE
Record high margin debt – NOPE
Hindenburg omens – NOPE
Syrian missile attack – NOPE
North Korea – NOPE
Yet, the market has clearly had other ideas. As you can see, none of these reasons have mattered, as the market has simply melted up towards our longer-term target of 2500SPX, which we pointed towards several years ago, despite much disbelief.
So, either you learn the lessons clearly taught by Mr. Market over the last several years, or, continue donning those blinders while muttering to yourself “it just can’t be.”
I believe the coming week will present the market with an important short-term test. If the 2507/10SPX region holds as resistance, and we turn down to break 2480SPX, I believe we will drop to retest the 2400SPX region again. And, this is my preference at this point in time. However, if we are unable to turn down at 2507/10SPX, or if we are unable to strongly break below 2480SPX, then the market is sending us a message that it wants to head to at least the 2545SPX region, and potentially even a bit higher before wave (3) completes.
See charts illustrating the wave counts on the S&P 500.
Avi Gilburt is a widely followed Elliott Wave technical analyst and author of ElliottWaveTrader.net (www.elliottwavetrader.net), a live Trading Room featuring his intraday market analysis (including emini S&P 500, metals, oil, USD & VXX), interactive member-analyst forum, and detailed library of Elliott Wave education.
The S&P 500 has had quite a run since the early 2016 lows, not experiencing even a slight pullback of 5% or more, leading many to believe that the market would wobble during the seasonally weak period of August and September. Over the last twenty years, the market has rallied only 55% of the time during August and only 50% of the time during September, losing on average 1.0% and 0.80%, respectively, in those two months before strengthening into the final three months of the year.

This is the Short version:
On the 2 hour charts I’ve spotted several small H&S bottoms building out on some of the stock market indexes. It wasn’t until Monday of this week that they began to show themselves when several broke out above their necklines. Some of these small H&S bottoms are part of a bigger pattern that has been building out for most of this year. At a minimum their price objectives should get some of the stock market indexes back up to the top of their 2016 uptrend channels.
Lets start with a 2 hour chart for the SPX which shows it gapped above its neckline on Monday of this week and closed at a new all time high today. A backtest to the neckline would come in around the 2482 area.
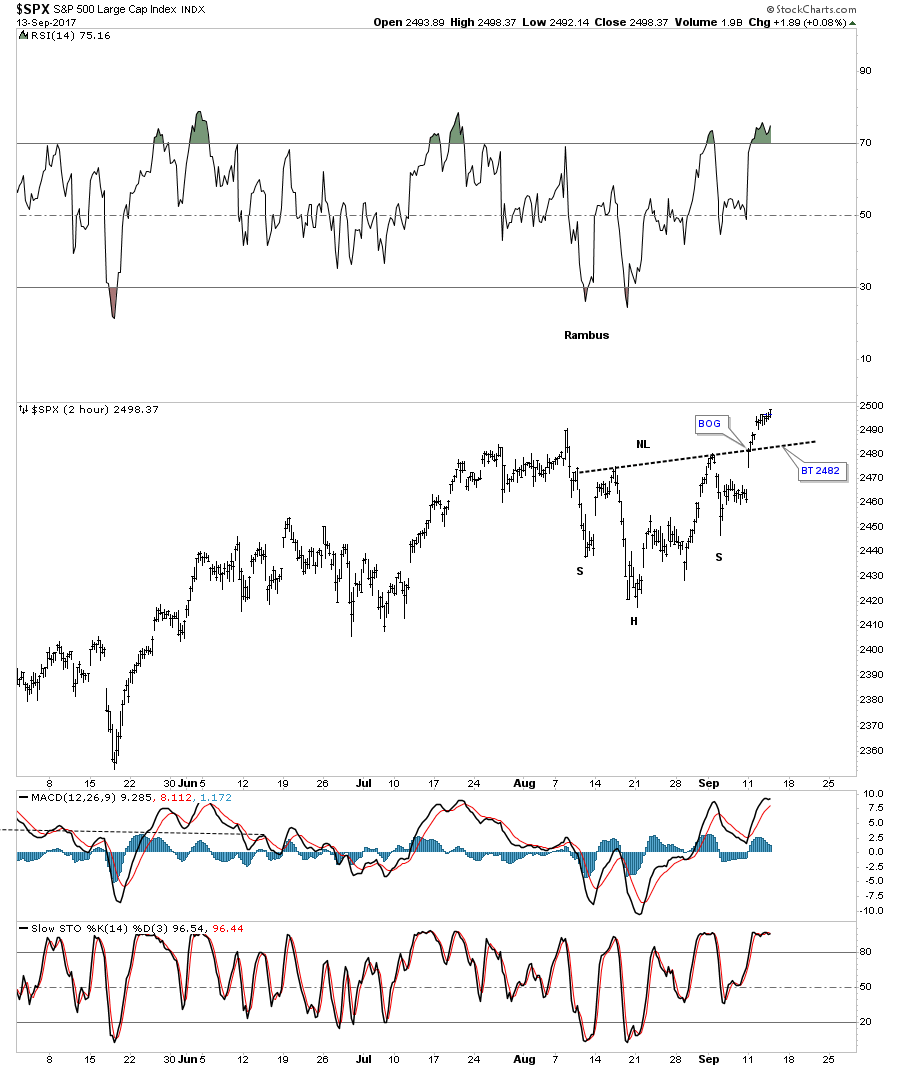
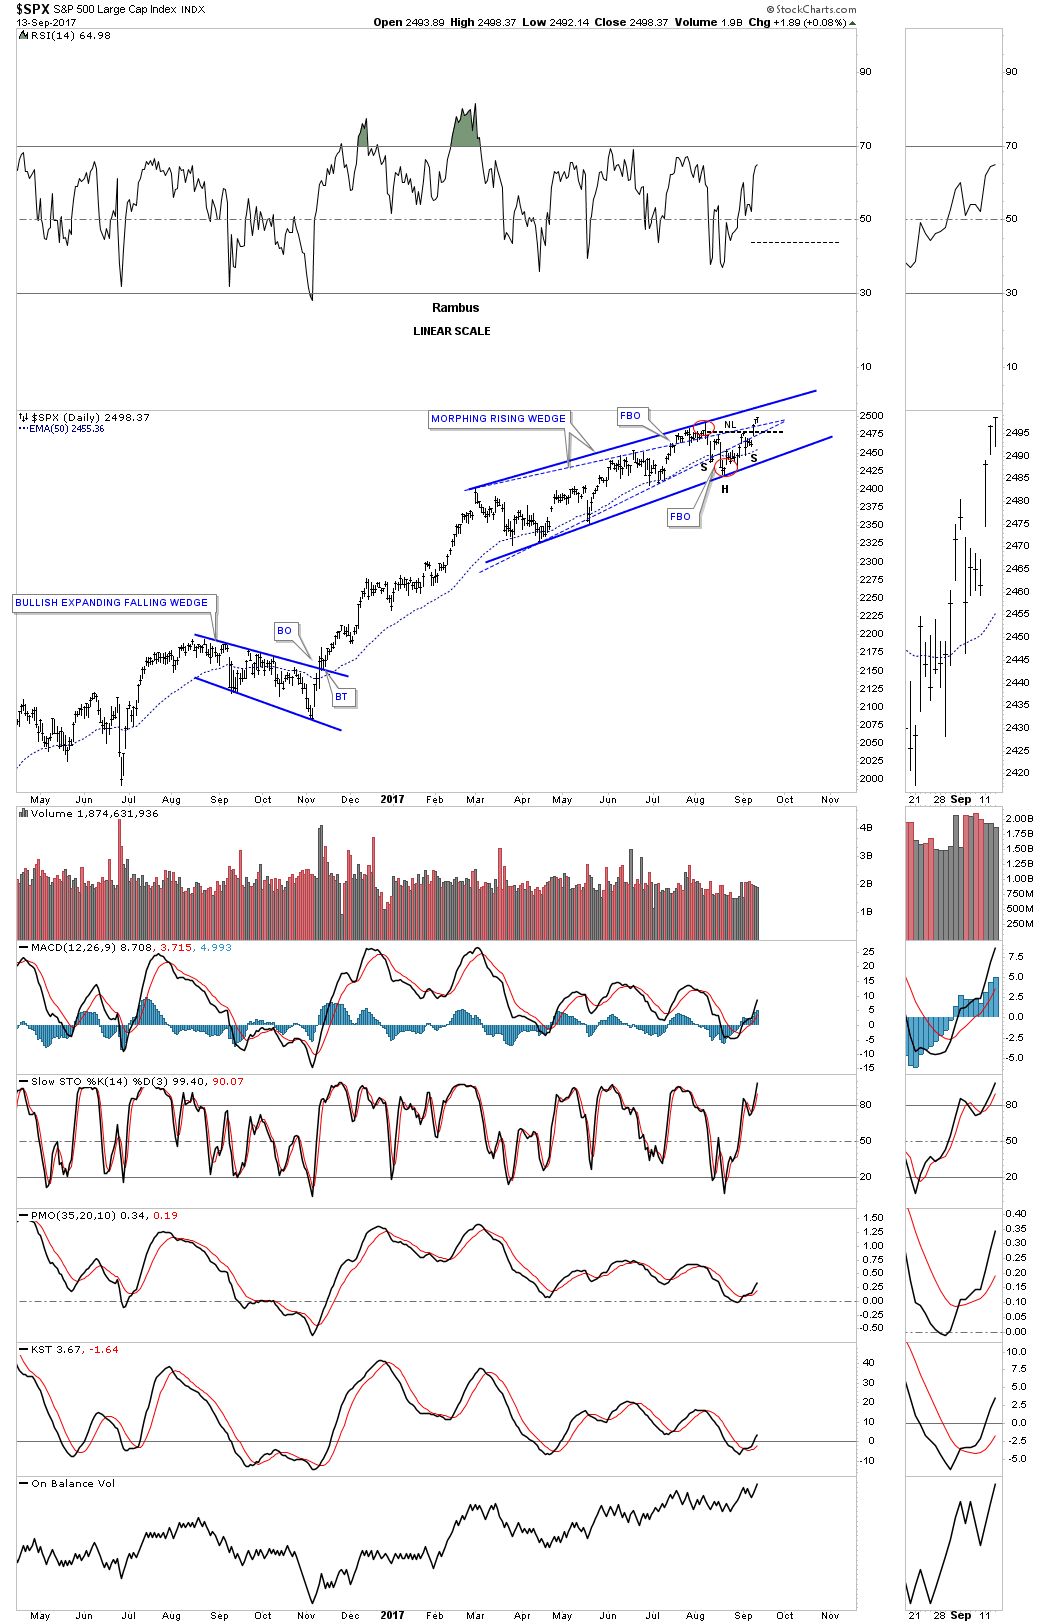
Several weeks ago I posted this chart which was showing how the original rising wedge, blue dashed trendiness, was morphing into a bigger pattern as shown by the red circles with a symmetry false breakout of the top and bottom blue dashed rails. It’s getting pretty busy in the apex, but you can see how the small H&S bottom fits into the bigger pattern that began building out back in February of this year. If that little H&S bottom plays out it strongly suggests the SPX is going to breakout topside from that 7 month morphing rising wedge in a new impulse leg up.
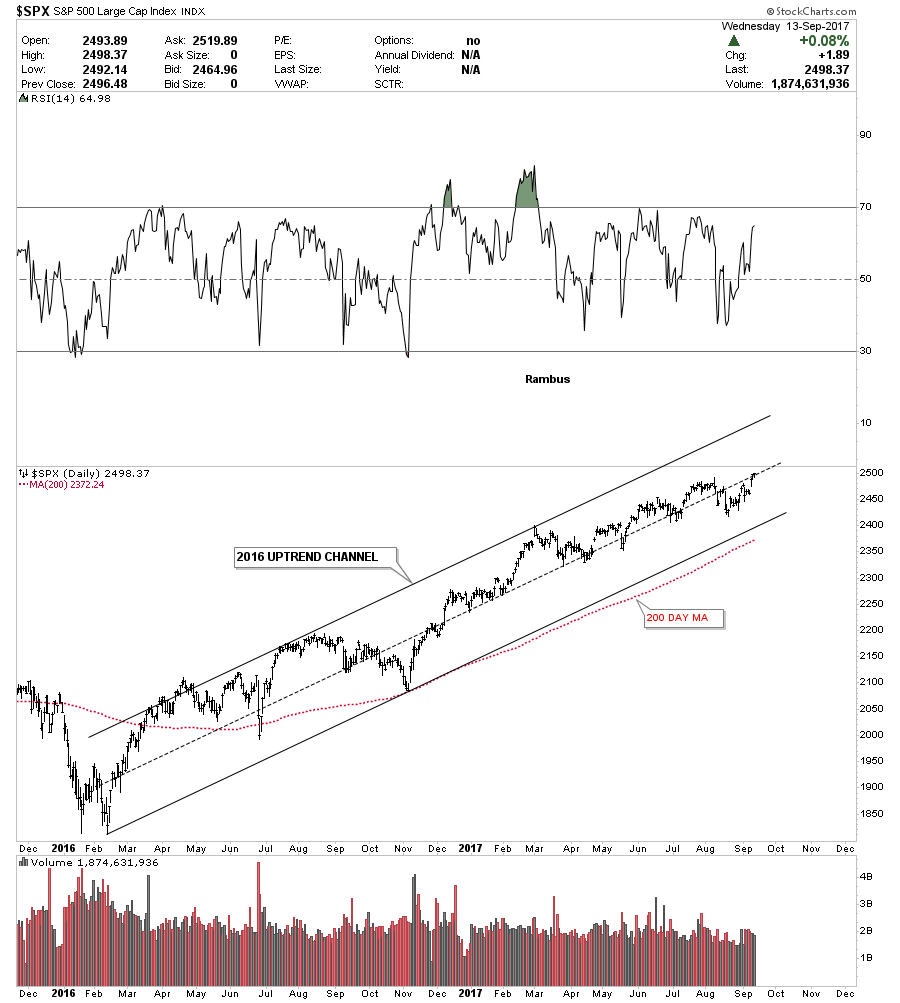
Below is a 2 year daily chart for the SPX which just shows its 2016 uptrend channel. On many of the stock market indexes the 200 day moving average does a good job of showing you the angle of the uptrend channel.
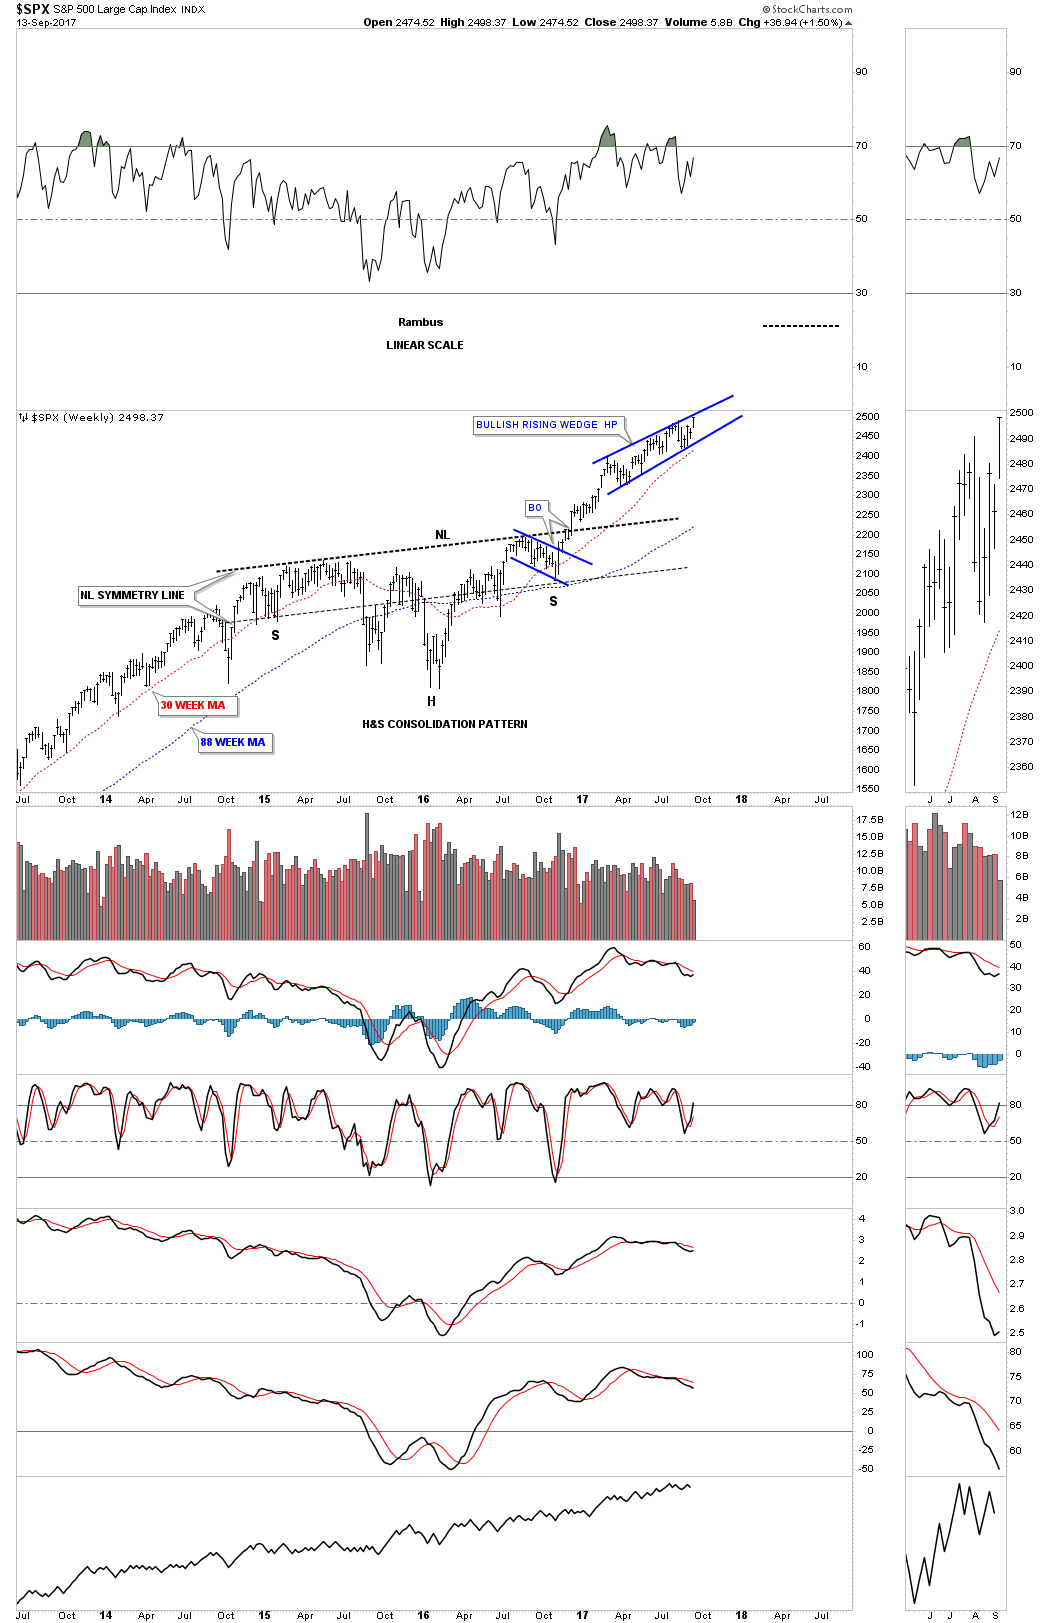
Perspective is everything when you discover what may be an important chart pattern. The weekly chart below shows the 2 year H&S consolidation pattern that corrected the last impulse move up. Now you can see how the blue morphing rising wedge fits into the very big picture. Keep in mind the rising wedge hasn’t broken out yet so the pattern isn’t complete. The reason I think the rising wedge is going to breakout topside is because we are in a bull market and patterns like this tend to form in strong bull markets. If we do get the upside breakout from the rising wedge I would view it as a halfway pattern that would have formed between the neckline and the ultimate price objective.
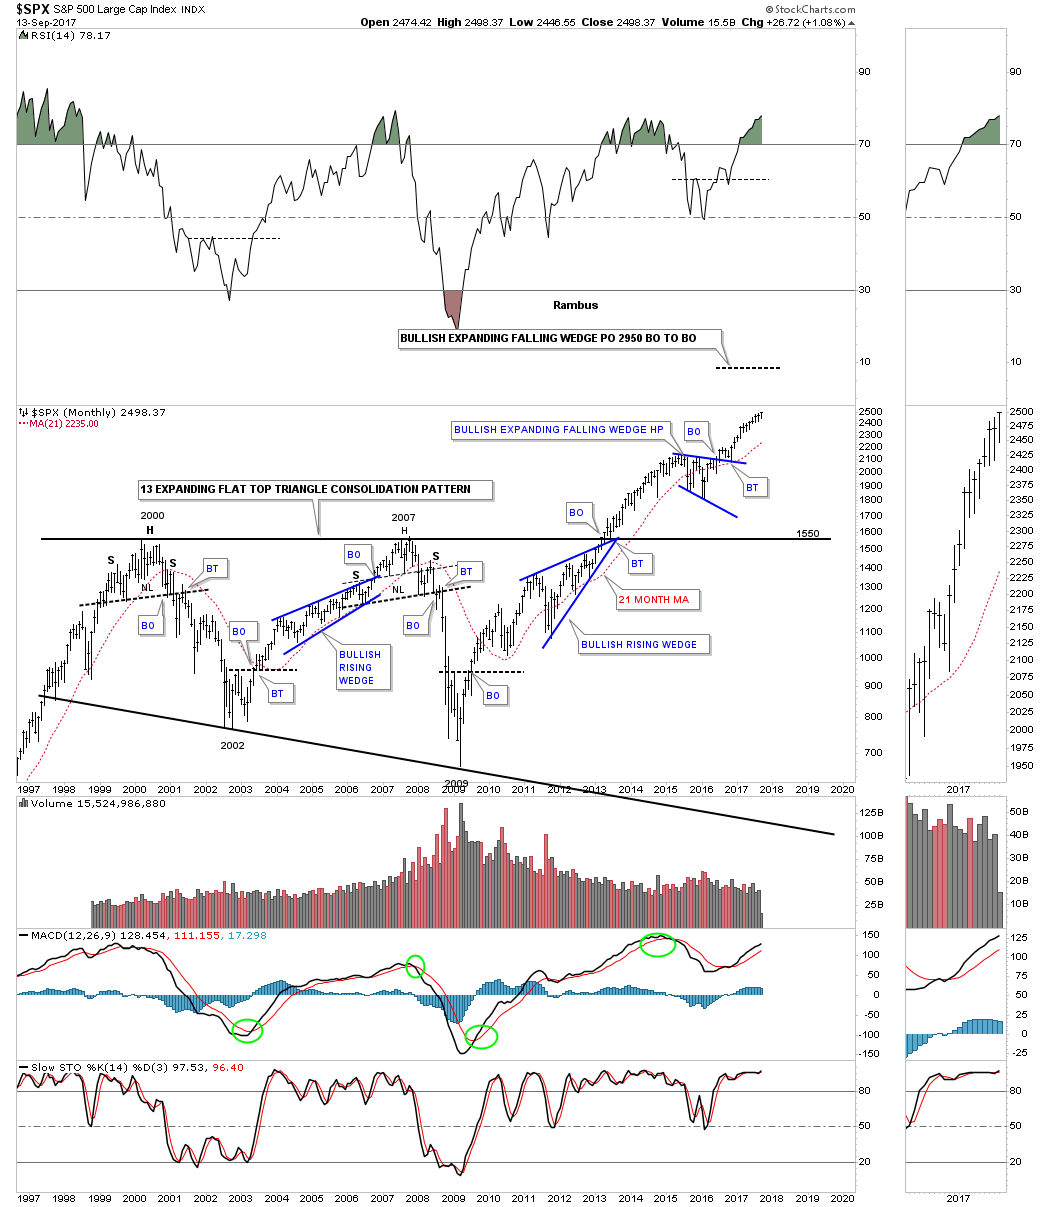
As I mentioned earlier perspective is everything. Below is a 20 year monthly chart for the SPX which we’ve been following before the top rail of the 13 year expanding flat top triangle consolidation pattern was broken. On this chart I’m showing the 2014 and 2015 consolidation period as a bullish expanding falling wedge halfway pattern. I have to tell you that it has been pretty lonely being a long term bull, but it has even been harder over the last several months as the rising wedge has been developing on the daily charts above. It’s these long term charts that take out all the noise that give me the confidence to hang in there when most say the bull market can’t keep going up. This chart shows you the wall of worry since the breakout from the blue bullish expanding falling wedge.
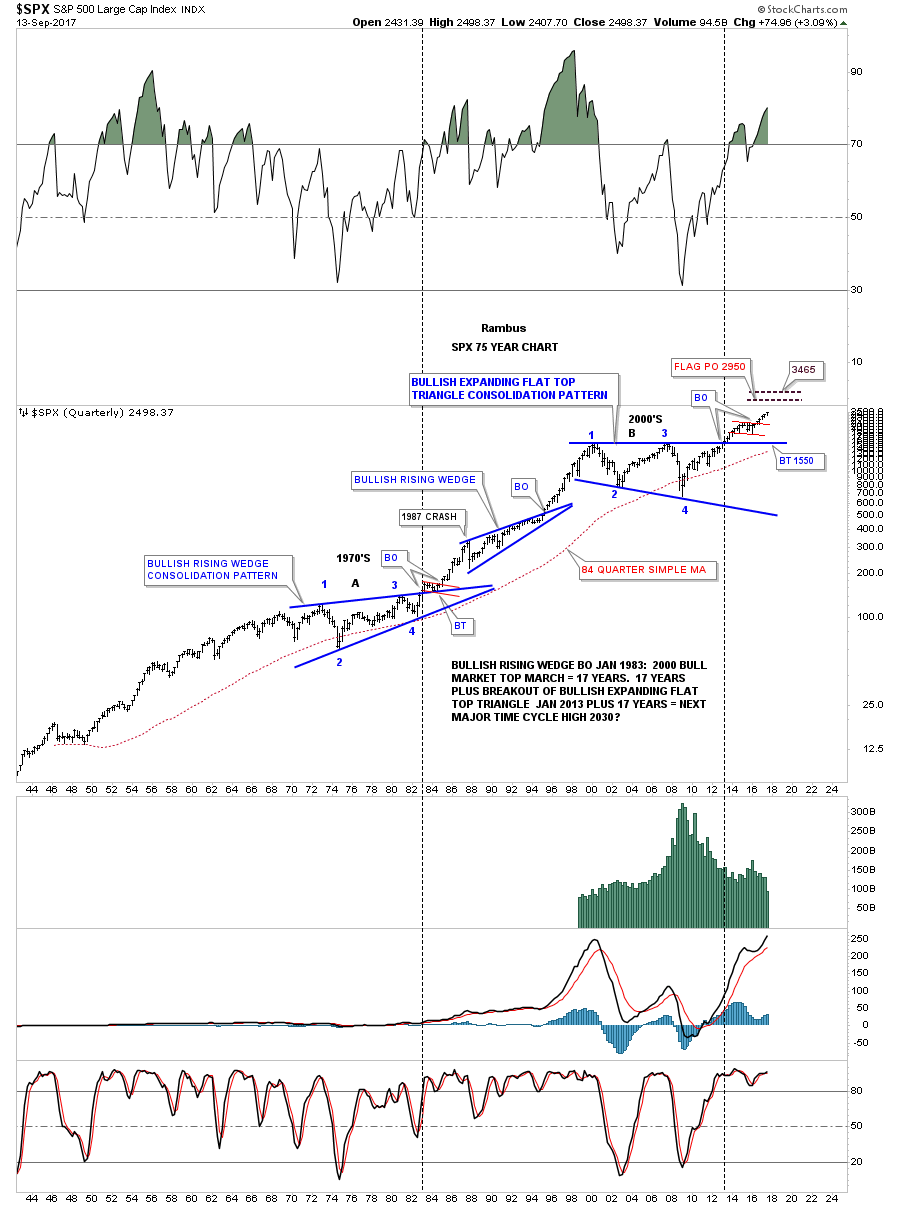
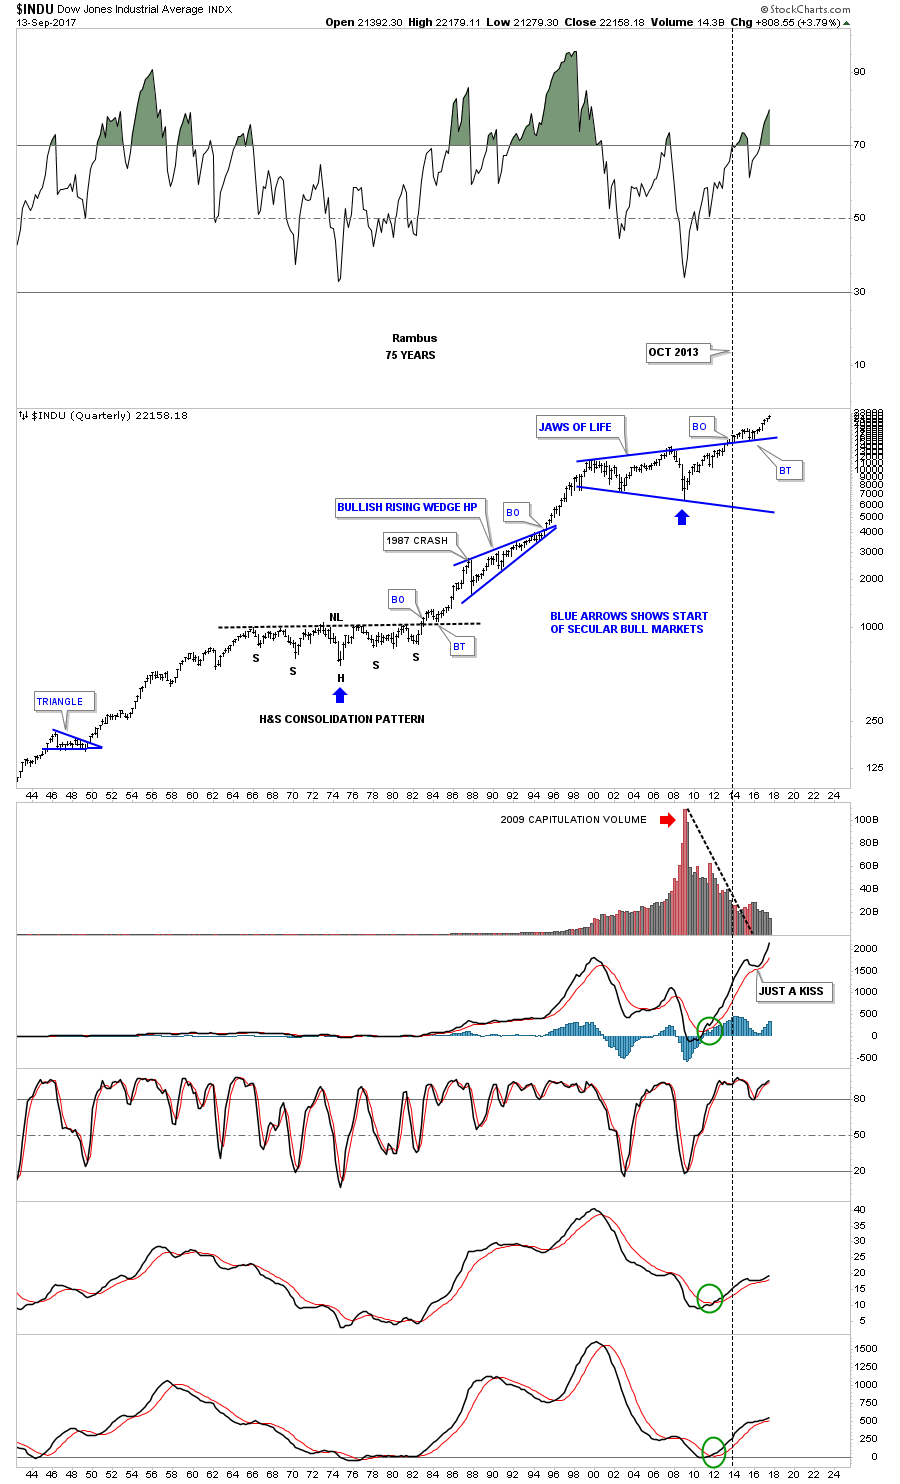
Again perspective is everything when you look at this 75 year quarterly chart for the SPX. The blue expanding falling wedge on the chart above is the small red consolidation pattern at the top of this chart. This chart along with the Jaws of Life on the INDU has given us a look into the future that few want to believe. For whatever reason investors love to hear bad news or that the markets are going to crash. Fear sells where bullish scenarios go by the wayside. For all the reasons this bull market that began in March of 2009 can’t keep going up, it keeps going up regardless of all the reasons it can’t, and there are a millions reasons why it can’t keep going up. The price action above all else has the final say when everything else is boiled away.
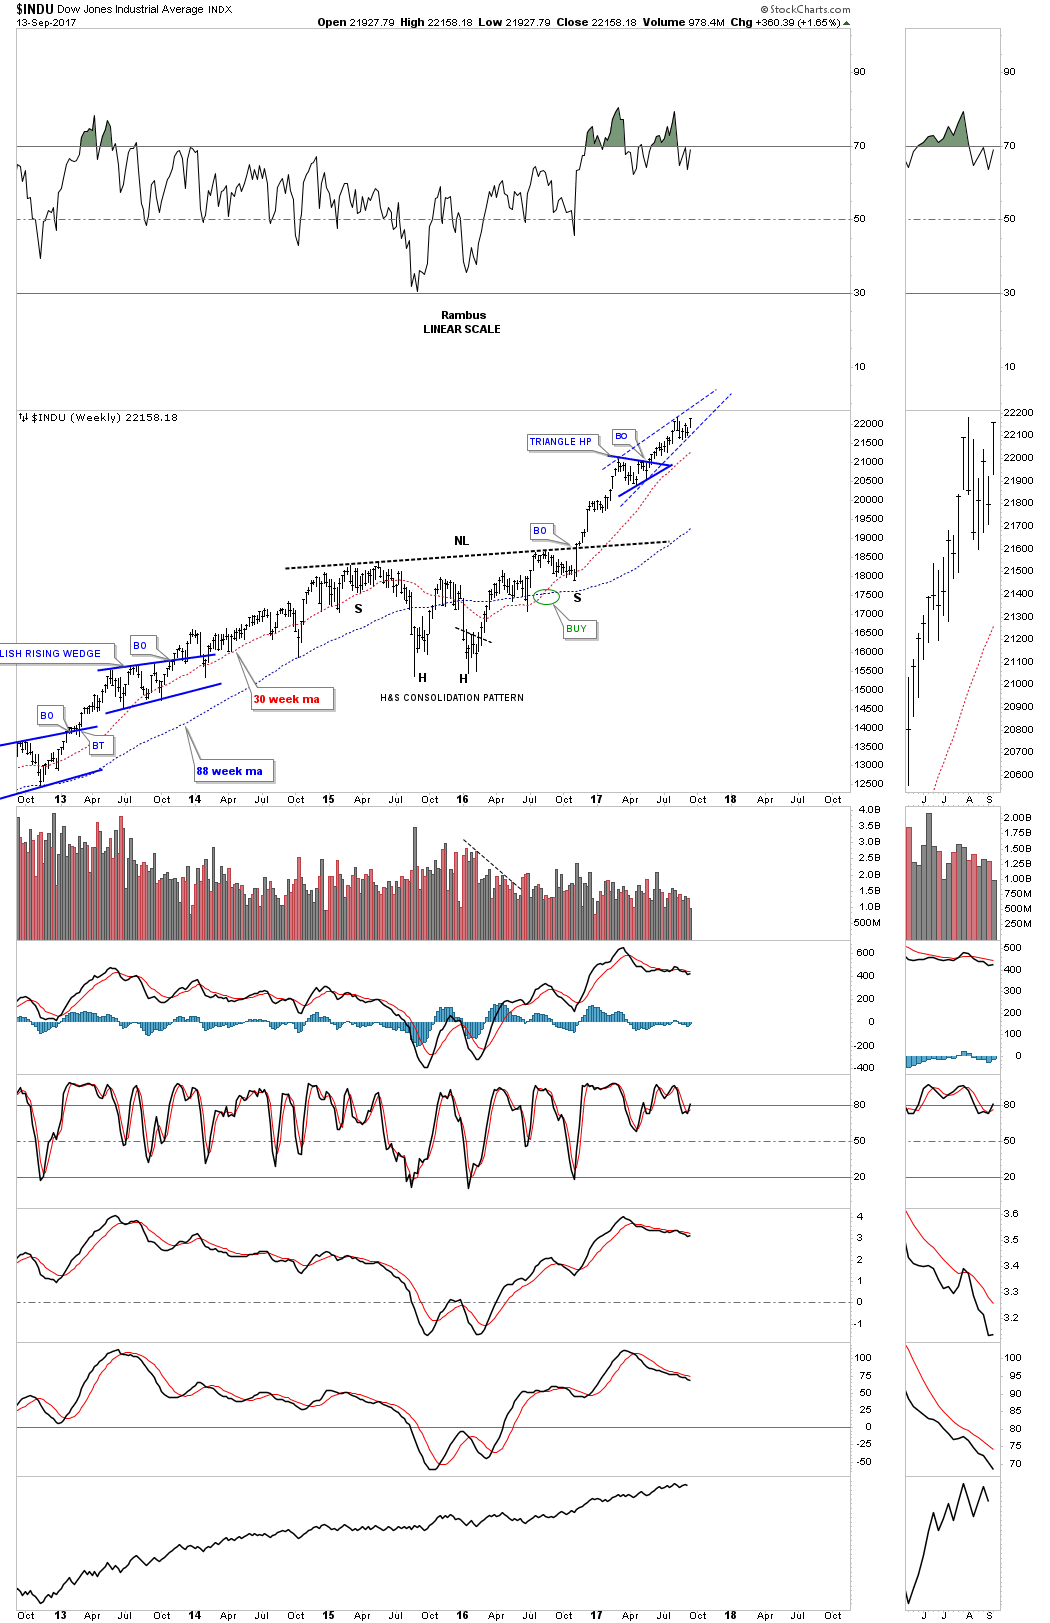
This weekly chart shows the INDU’s H&S consolidation pattern with the breakout and impulse move higher.
The monthly line chart for the Jaws of Life.
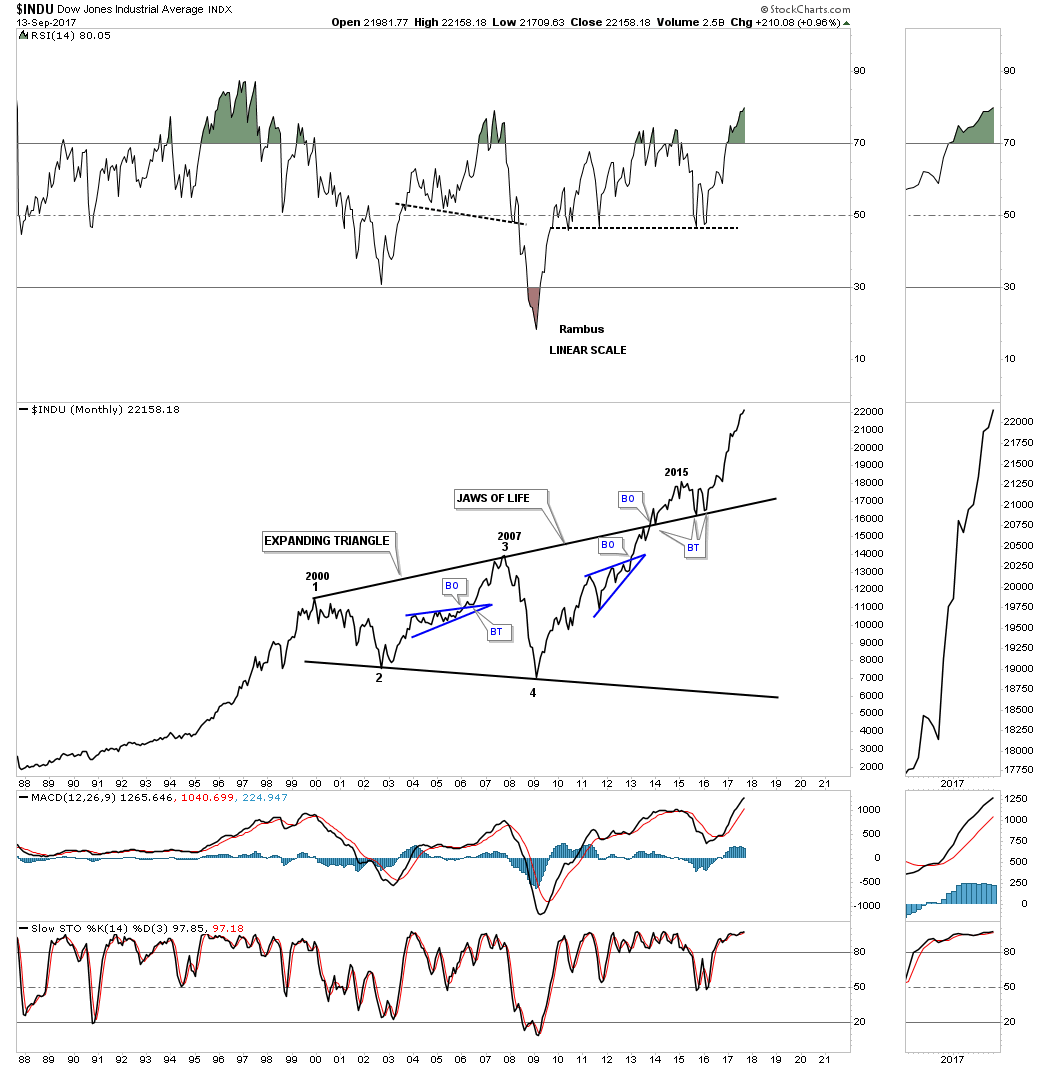
Below is the 75 year chart for the INDU which shows the Jaws of Life and a glimpse into the future.
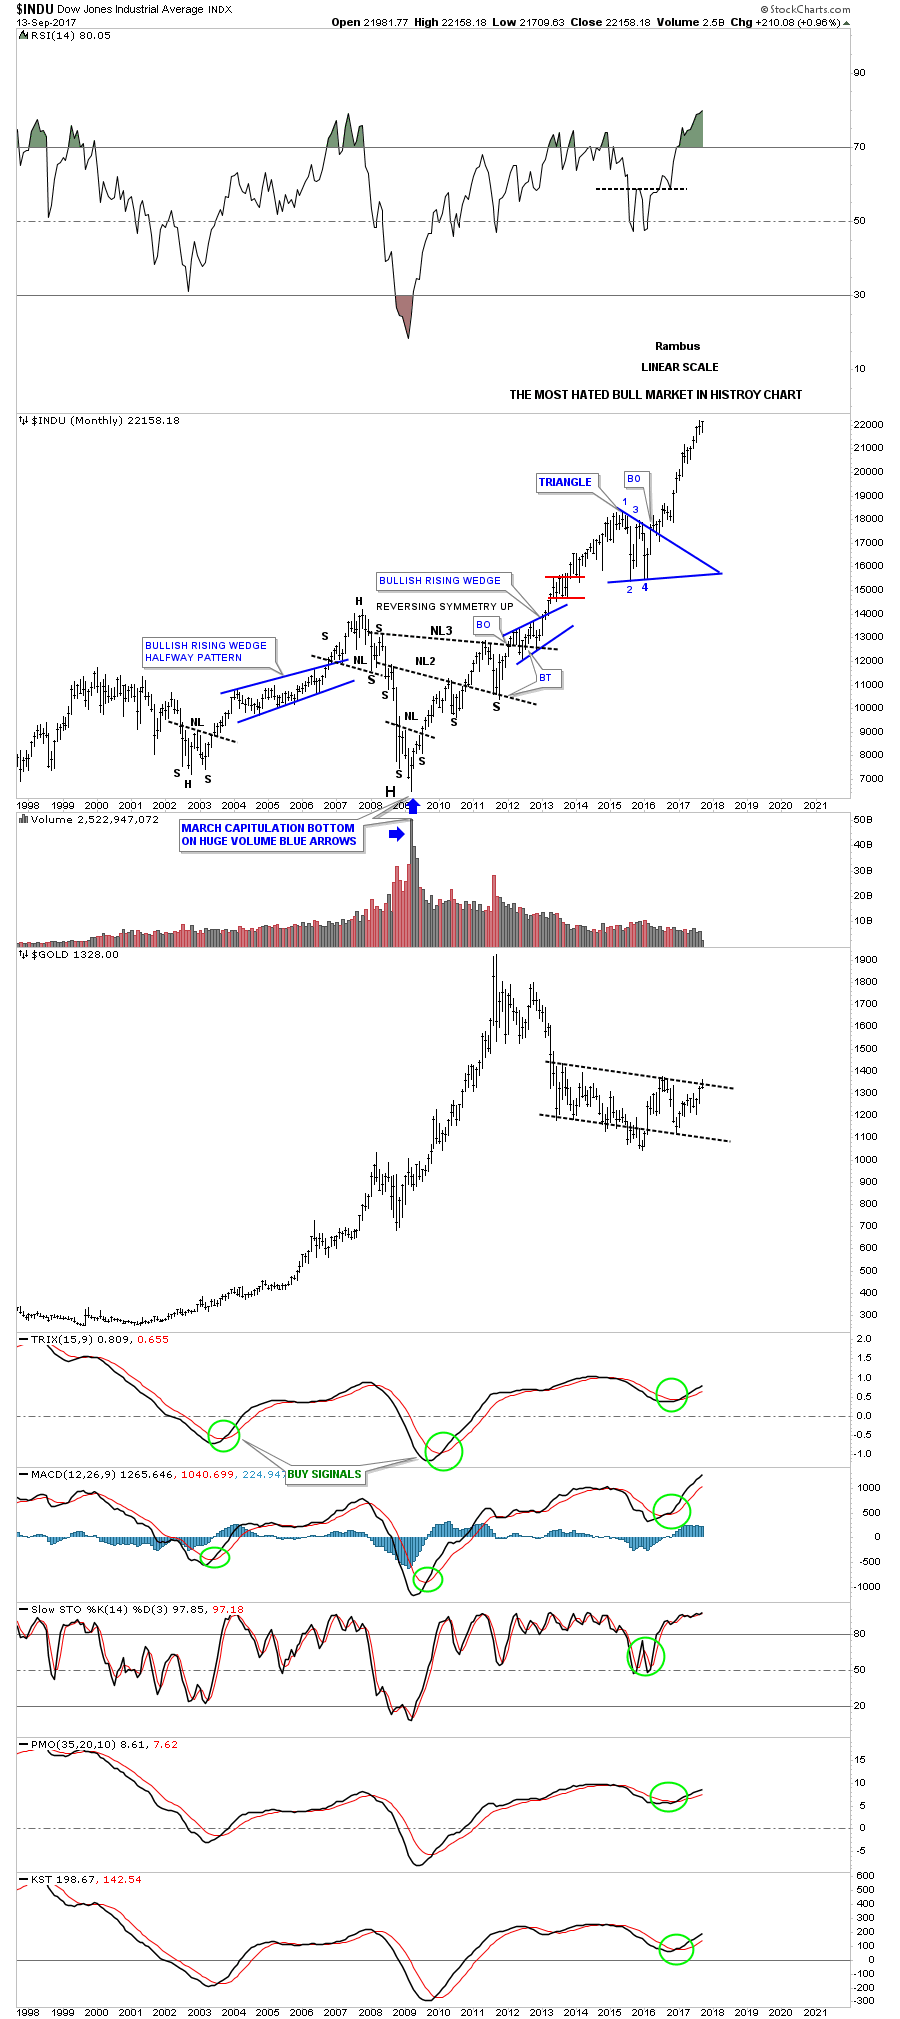
The Most Hated Bull Market in History chart for the INDU.
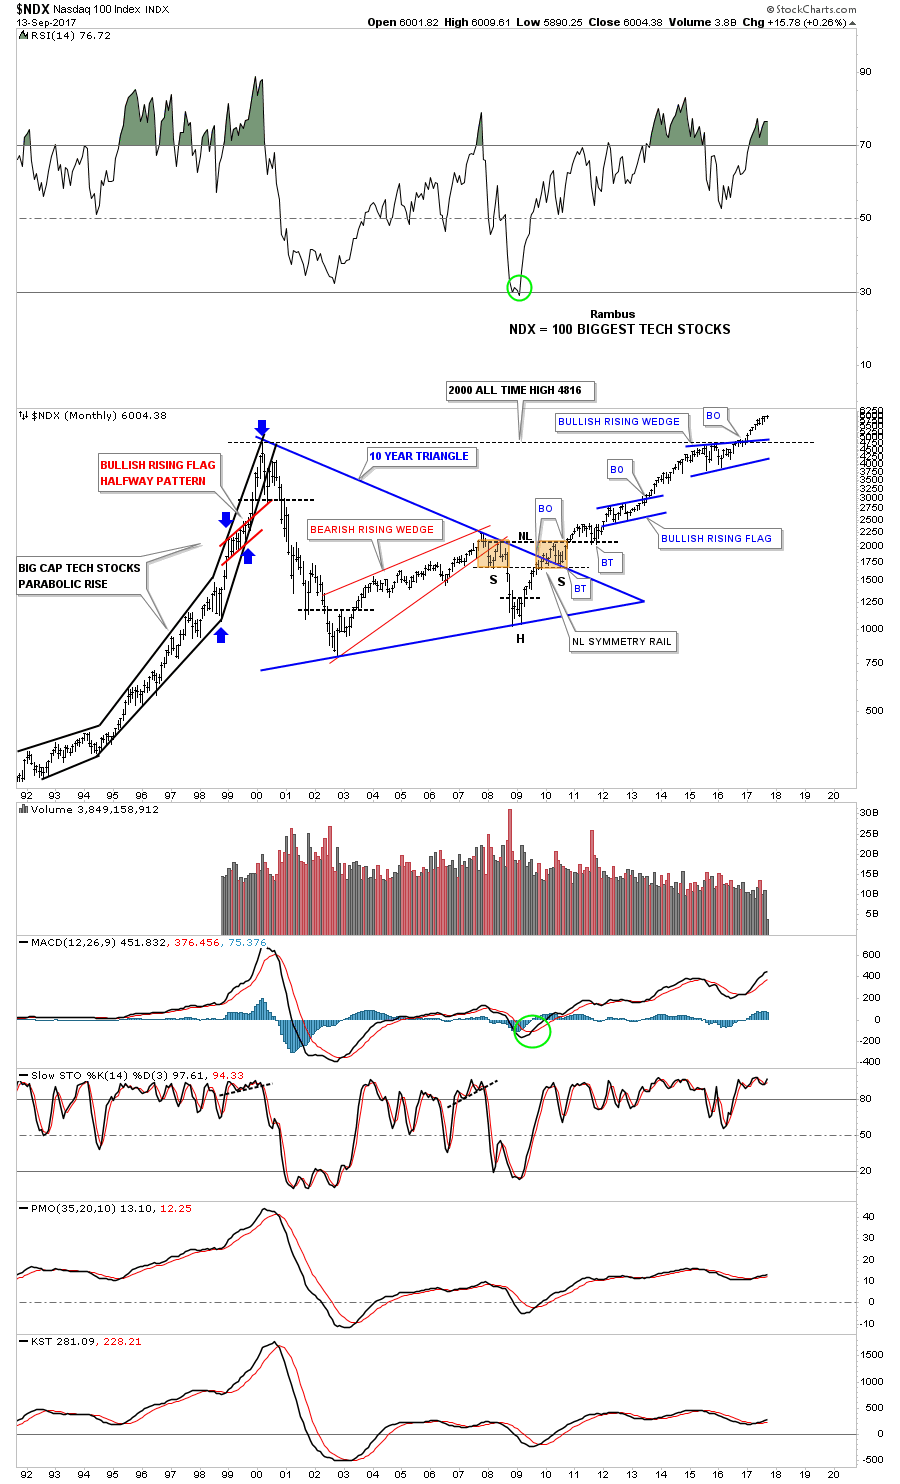
Below is a 25 year look at the NDX which shows some beautiful Chartology. Note the bullish rising wedge which formed just below the all time highs that gave the NDX the energy it needed to finally move on to all time highs. Classic Chartology
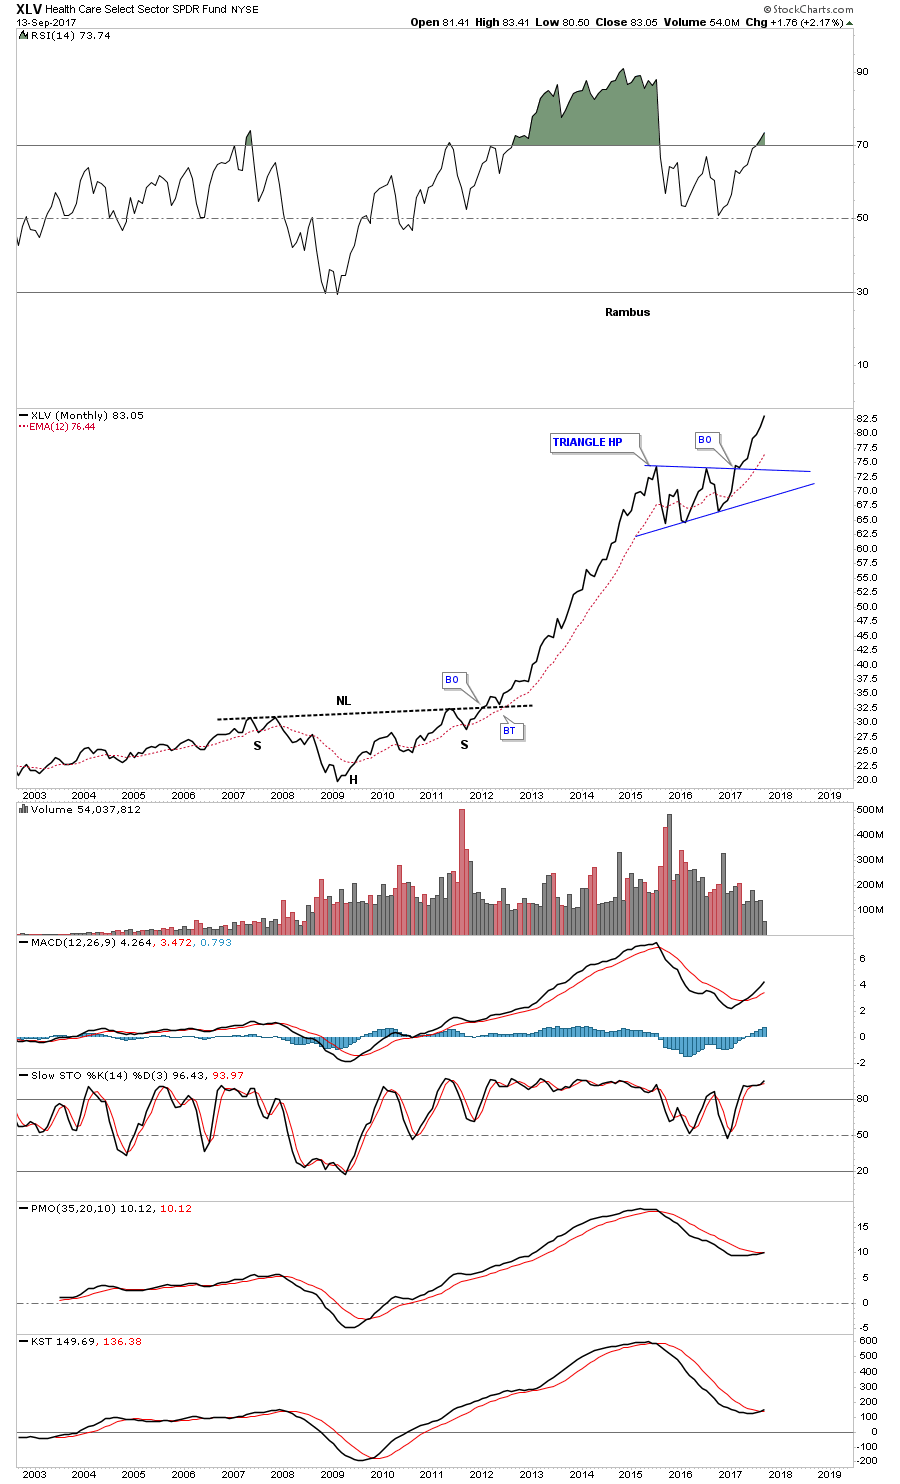
There’s always a bull market In healthcare
This next chart is for our many long term holders that don’t like to trade every little wiggle a stock makes and are looking for something to hold on to. This was one of the big leaders during the first leg up and then built out the blue triangle consolidation pattern.

The long term monthly line chart. Think of the blue triangle as a halfway pattern
I had planed on showing you some charts on oil, but I’ve run out of time. The bottom line is that until something changes the bull market, it is what it is and all the negativity about the economy or fundamentals or whatever one uses to gauge the health of the stock markets is not going to make you a dime. Trying to short a bull market is one of the hardest things to do as many have found out. Realize that everybody who has tried to catch THE Top of the Most Hated Bull Market in History since 2009 has lost money.
It’s much easier to go with the price action and what it’s telling you to do than to fight it. Maybe we crash into October like so many are predicting, but on the other hand what if we don’t? All the best…Rambus


-
I know Mike is a very solid investor and respect his opinions very much. So if he says pay attention to this or that - I will.
~ Dale G.
-
I've started managing my own investments so view Michael's site as a one-stop shop from which to get information and perspectives.
~ Dave E.
-
Michael offers easy reading, honest, common sense information that anyone can use in a practical manner.
~ der_al.
-
A sane voice in a scrambled investment world.
~ Ed R.
Inside Edge Pro Contributors

Greg Weldon

Josef Schachter

Tyler Bollhorn

Ryan Irvine

Paul Beattie

Martin Straith

Patrick Ceresna

Mark Leibovit

James Thorne

Victor Adair