
Stocks & Equities
There is no question that the stock market is richly valued and the economic expansion since the 2008 mortgage debt panic has endured far longer than normal cycles. Recent pessimism has arisen with major banks and analysts warning that the sky may start falling soon. Increased negative forecasts can be a positive contrary opinion signal, so let’s look at some of the concerns the major bulge banks are propagating.
Recently, $30 billion in funds flowed out of US equities and the current mid-2017 outflow is at record levels, which is being portrayed as a scary signal of impending doom. Oddly, past extreme spikes in fund outflows were good times to begin buying stocks. In particular, the two most impressive rush for the exits occurred in mid-2004 and early 2016. In hindsight, these were a couple excellent points to buy stocks hand over fist. Apparently, many institutions equate this extreme proxy of equity fund outflow and today’s high priced stock market as a valid correlation when their own evidence would indicate otherwise.


Briefly:
Intraday trade: Our Friday’s neutral intraday outlook has proved accurate. The S&P 500 index extended its short-term consolidation. The market may continue to fluctuate today. There have been no confirmed positive signals so far. On the other hand, the S&P 500 index remains above support level marked by last week’s Tuesday’s daily gap up of 2,430.58-2,433.67, and there is no clear short-term downtrend. Therefore, we prefer to be out of the market today, avoiding low risk/reward ratio trades.
Our intraday outlook remains neutral, and our short-term outlook is bearish, as we expect downward correction. Our medium-term outlook remains bearish:
Intraday outlook (next 24 hours): neutral
Short-term outlook (next 1-2 weeks): bearish
Medium-term outlook (next 1-3 months): bearish
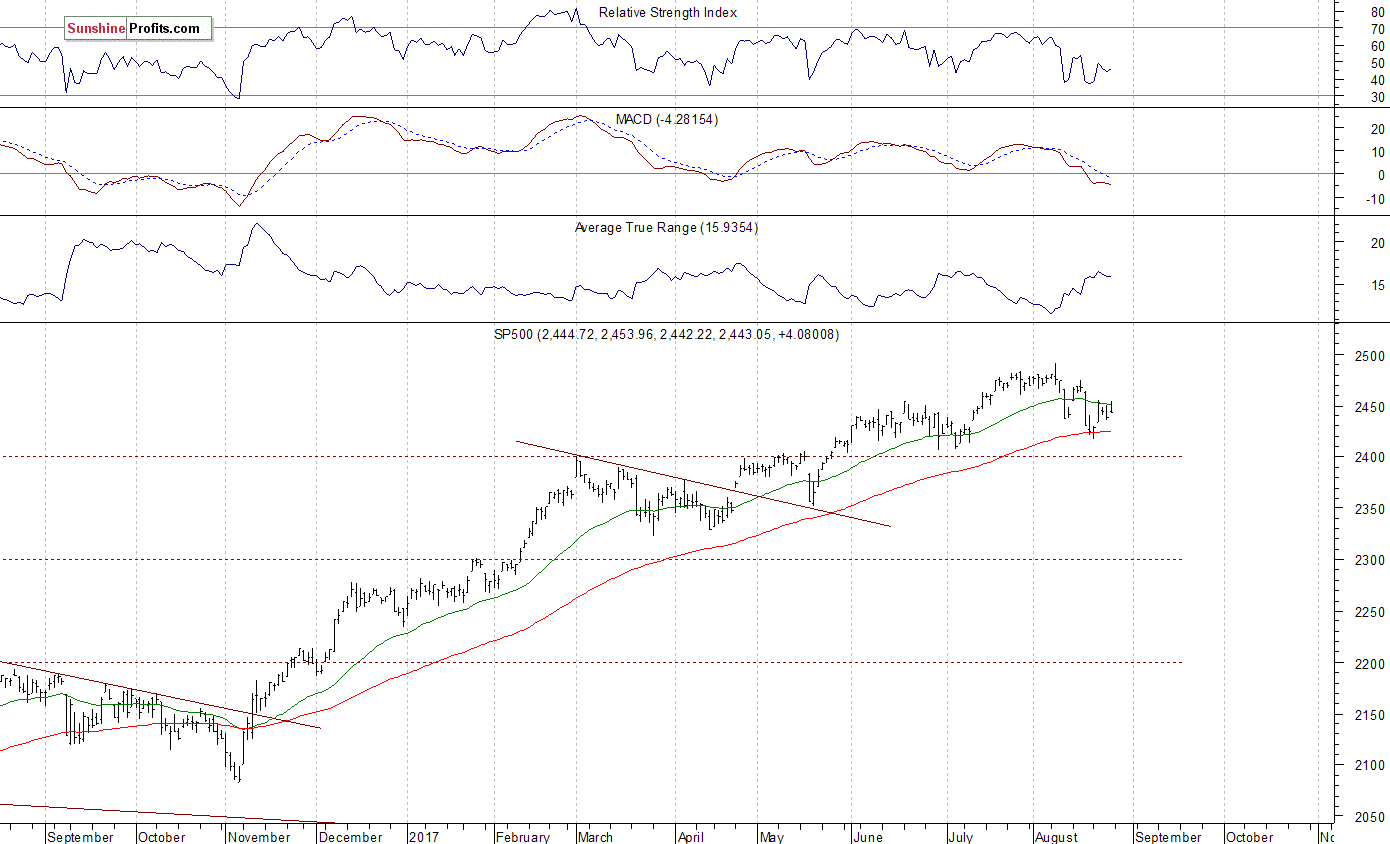
The U.S. stock market indexes were mixed between -0.1% and +0.2% on Friday, extending their recent fluctuations, as investors reacted to economic data announcements, Jackson Hole Economic Policy Symposium speeches. The S&P 500 index remained within a relatively narrow trading range, as it traded along the level of 2,450. It is currently 1.9% below the August 8 all-time high of 2,490.87. The Dow Jones Industrial Average remains close to 21,800 mark, and the technology Nasdaq Composite trades 3.0% below its record high of 6,460.84. The nearest important level of resistance of the S&P 500 index remains at 2,450-2,455, marked by last week’s Tuesday’s local high. The next resistance level is at 2,465-2,475, marked by previous support level and local highs. The resistance level is also at 2,490-2,500, marked by the above-mentioned all-time high. On the other hand, support level is at 2.430-2,435, marked by Tuesday’s daily gap up of 2,430.58-2,433.67. The next support level remains at 2,400-2,420. The market retraced some of its recent downtrend on Tuesday, but then it failed to extend its short-term uptrend. There have been no confirmed positive signals so far. We still can see some negative technical divergences. But will they lead to medium-term downward correction? The S&P 500 index continues to trade within a medium-term consolidation following early June breakout above 2,400 mark, as we can see on the daily chart:
More Fluctuations?
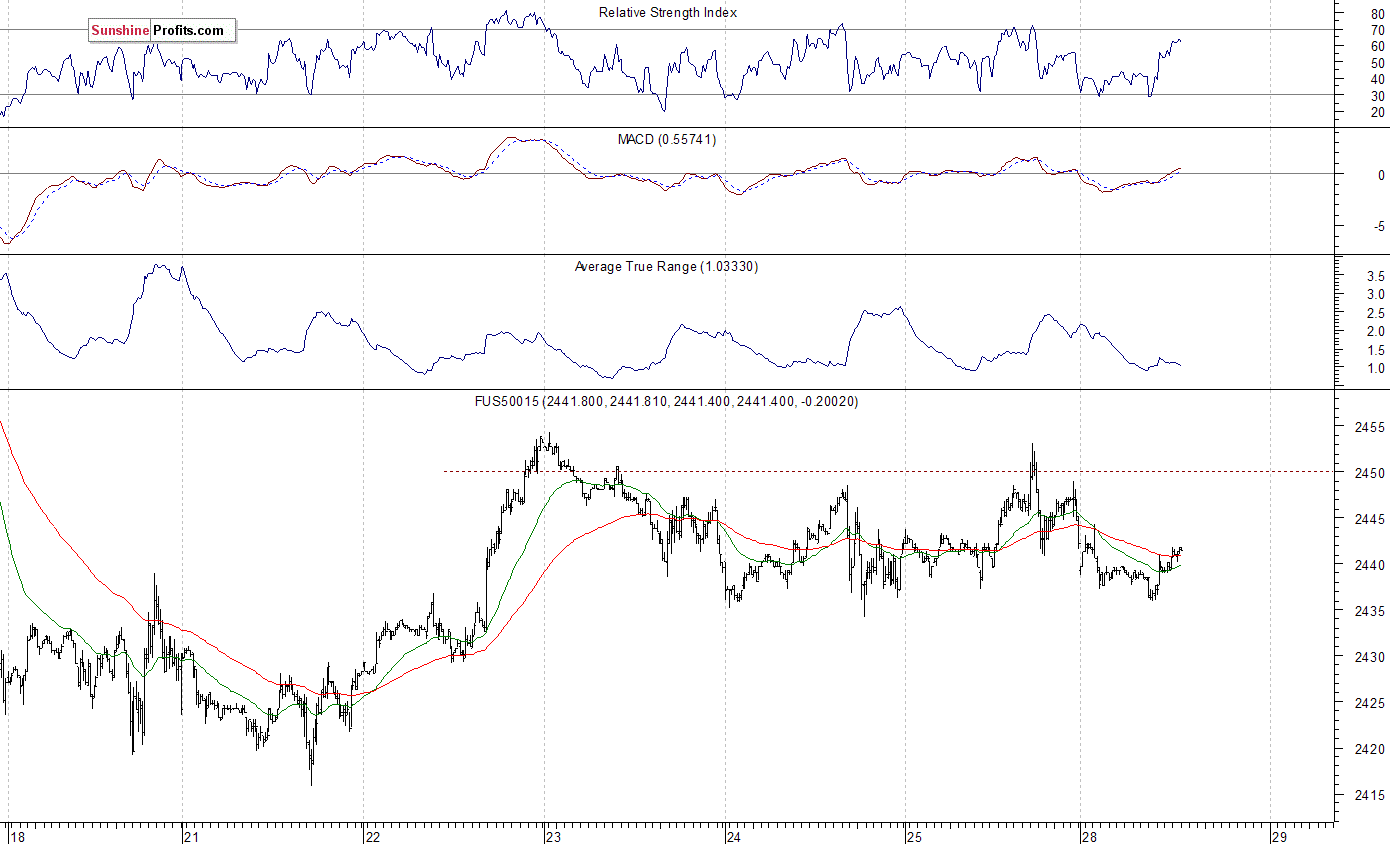
Expectations before the opening of today’s trading session are virtually flat, with index futures currently down 0.1% vs. their Friday’s closing prices. The European stock market indexes have lost 0.1-0.5% so far. Investors will now wait for the Wholesale Inventories number release at 8:30 a.m. The market expects that it grew 0.8% in July. The S&P 500 futures contract trades within an intraday uptrend following an overnight move down. The nearest important level of resistance is at around 2,445-2,450, marked by short-term local highs. The next resistance level is at around 2,455, marked by last Tuesday’s local highs. On the other hand, support level is at 2,430-2,435, marked by previous level of resistance and some local lows. Will the market continue its last week’s Tuesday’s rally?
Nasdaq Relatively Weaker
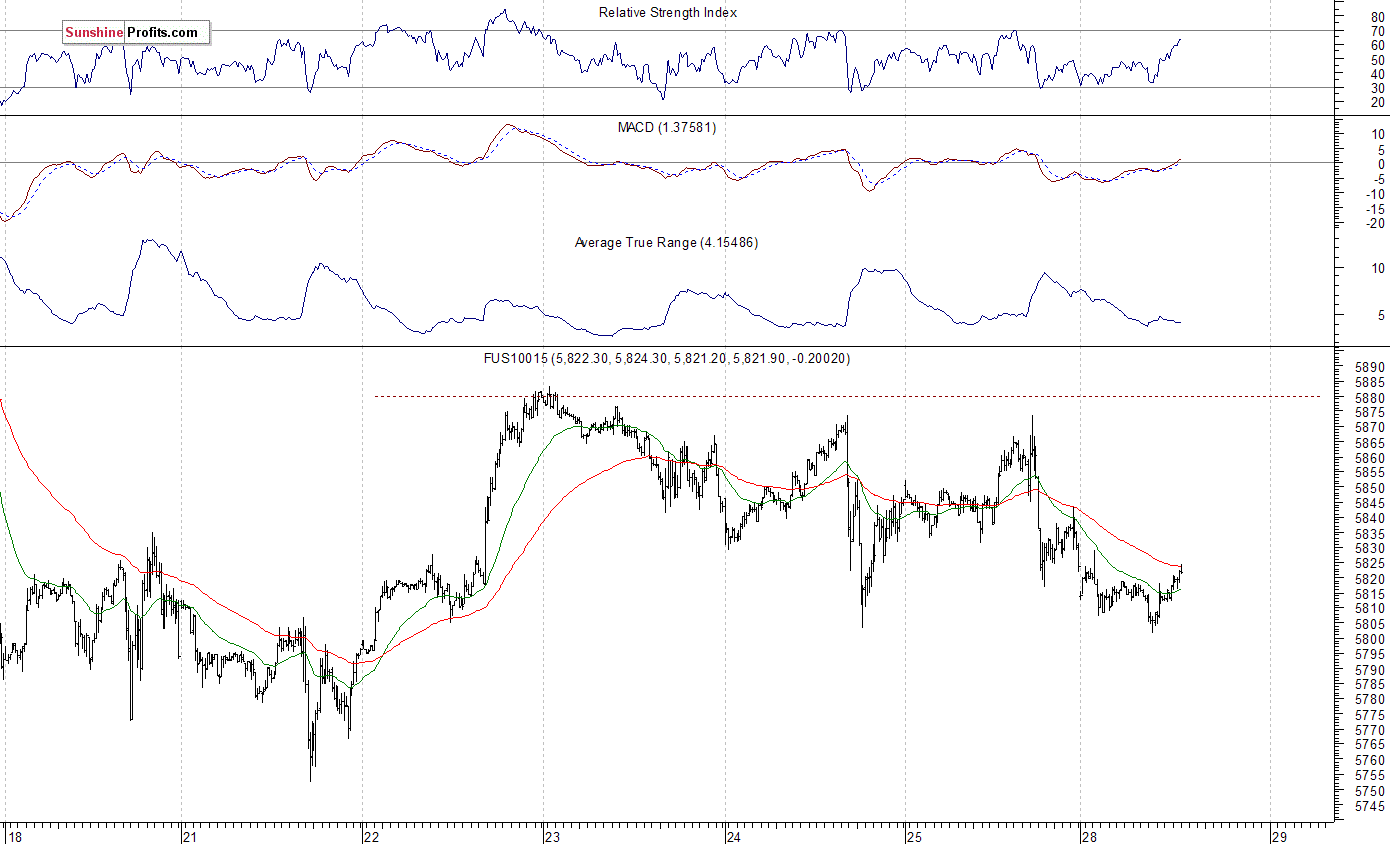
The technology Nasdaq 100 futures contract trades within an intraday uptrend, as it retraces an overnight move down. The nearest important level of resistance remains at 5,830-5,840, marked by some short-term local highs. The next level of resistance is at 5,850-5,870, among others. On the other hand, support level is at 5,800, marked by local lows. The market trades within a short-term consolidation following last week’s Tuesday’s rally, as the 15-minute chart shows:
Concluding, the S&P 500 index remained within short-term consolidation on Friday, following Tuesday’s rally. Is this a new uptrend or just more consolidation after November-August move up? There have been no confirmed short-term positive signals so far. We still can see some medium-term overbought conditions along with negative technical divergences.
If you enjoyed the above analysis and would like to receive free follow-ups, we encourage you to sign up for our daily newsletter – it’s free and if you don’t like it, you can unsubscribe with just 2 clicks. If you sign up today, you’ll also get 7 days of free access to our premium daily Gold & Silver Trading Alerts. Sign up now.
Thank you.
Paul Rejczak
Stock Trading Strategist
Stock Trading Alerts
Back on July 15th, the title to my weekend update to members of my market analysis service was “Market Will Likely Top Within The Next Three Weeks.” My initial target region for this top was between 2487-2500SPX. One of the factors I considered in my timing for this potential top was Luke Miller’s Bayesian Timing model, which was looking for a top to our wave (3) on August 9th. And, as we know, the market topped on August 8th at 2491SPX, and we seem to have begun the multi-month pullback/consolidation we have been expecting.
For those old enough to remember, Ranger Smith of the “Yogi Bear” cartoon used to constantly tell visitors at Jellystone Park not to feed bears. So, consider me your Ranger Smith.

You see, people can’t help themselves but be bearish. In fact, it seems we are genetically predisposed to being bearish, as the following article explains:
Sentiment Speaks: Your Human Brain Makes You Bearish, Not The Market Or News
This is why bearishness sells. As one commenter to a perpetually bearish author recently put it:
The material might not be helpful, and even harmful. But, it gets more clicks, as people are very drawn to scary viewpoints, and many take comfort and consolation in believing that the gains that they have missed by being more cautious will be wiped out when the big crash comes. . . Scary stuff sells. It does not need to stand up to careful examination. Most people will never look carefully at the facts, and will believe what they want to believe.
Read his last two sentences again, as it rings of the sad truth in the market.
And, Ben Franklin explained why:
“So convenient a thing is it is to be a reasonable creature, since it enables one to find or to make a reason for everything one has a mind to do.”
As I explained in my article above, we are predisposed to bearishness. So, we will ALWAYS find a reason to be bearish. ALWAYS. This is why bearish article writers receive constant praise despite the fact that they have been wrong for years.
Their supporters heap praise upon them due to the fact that they have “opened their eyes to the reasons why the market will not go any higher.” Yet, amazingly, the market has continued much higher. And, the higher we go, the more they thank the bearish article writers for “saving them from the inevitable crash.” Mind you, they have missed the last 40% rally in order to protect themselves from the next 5-10% downside.
To be brutally honest, it is much tougher to be a contrarian than it is to be a bear. To be a bear means you are simply following your nature. And, to be a bear in the stock market means that you will likely be wrong the great majority of the time. Moreover, if you follow your nature, it means that you likely have significantly under-performed the market.
Does that mean you should turn bullish right now? No, it does not. But, it does mean that you have to recognize your mistakes over the last several years, and understand why you made those mistakes. I sincerely hope you consider your perspective quite strongly before you are presented with another opportunity to take a long position in the equity market in the coming months.
Another truth in the market is that many of you will never be able to admit that you were wrong and the market was right. To put it simply, price it truth, and you must learn to accept that. Anything that tries to explain why price is false is, by definition, pure falsehood. Yet, many of you will simply continue to list all the reasons that you are right and the market is wrong. Do you really think that fighting the market is going to help you attain your financial goals?
And, here is one last shocking fact that may make your fur stand on end: It is due to your bearishness that the market has continued higher and higher. Yes, that is the truth. Until the market, as a whole, is convinced that this bull market will never end, the market will continue to climb that wall of worry that each of you bears have helped to build these last 8 years. And, based upon my analysis, we still have several more years until the bears are placed on the extinction watch list, which will then be the time that this bull market that began in 2009 will finally come to an end. So, until that time, us contrarians (along with our investment accounts) sincerely thank you for pushing this market far beyond your expectations.
Again, I want to remind those willing to listen that 4th wave pullback/consolidations are the most variable of the entire Elliott 5 wave structure. That means the market will continue to whipsaw traders until this 4th wave has run its course over the next few months.
But, as long as all “bounces” we now experience remain below 2465-80SPX resistance, I view us as being in a whipsaw-type of market, ultimately making our way down to the 2300-2350SPX support region before this pullback/consolidation has completed in the coming months.
While there is a 15-20% probability that we can still strike the 2500-2520SPX region, even in that lower probability scenario, we will still likely resolve down to the 2300-2350 before we are able to rally to 2600SPX, likely into 2018.
See charts illustrating the wave counts on the S&P 500.
Avi Gilburt is a widely followed Elliott Wave technical analyst and author of ElliottWaveTrader.net (www.elliottwavetrader.net), a live Trading Room featuring his intraday market analysis (including emini S&P 500, metals, oil, USD & VXX), interactive member-analyst forum, and detailed library of Elliott Wave education.
A new Hindenburg signal was generated on August 16th. This follows the signal in May and its confirmation in June. That combination resulted in a minor correction to the 50-day moving average in the S&P.
The current signal comes on the heels of what was a very close call on August 8th when only one ingredient was missing from the strict rules. If the S&P can’t hold at the 50-day ema then we should be prepared for a deeper break to the 150-day average (2388).
See the June 28th report for further background information in the Hindenburg Omen.
Click Image For Larger Version

Opinions in this report are solely those of the author. The information herein was obtained from various sources; however, we do not guarantee its accuracy or completeness. This research report is prepared for general circulation and is circulated for general information only. It does not have regard to the specific investment objectives, financial situation and the particular needs regarding the appropriateness of investing in any securities or investment strategies discussed or recommended in this report and should understand that statements regarding future prospects may not be realized.
Investors should note that income from such securities, if any, may fluctuate and that each security’s price or value may rise or fall. Accordingly, investors may receive back less than originally invested. Past performance is not necessarily a guide to future performance. Neither the information nor any opinion expressed constitutes an offer to buy or sell any securities or options or futures contracts. Foreign currency rates of exchange may adversely affect the value, price or income of any security or related investment mentioned in this report. In addition, investors in securities such as ADRs, whose values are influenced by the currency of the underlying security, effectively assume currency risk. Moreover, from time to time, members of the Institutional Advisors team may be long or short positions discussed in our publications.
BOB HOYE, INSTITUTIONAL ADVISORS
EMAIL bhoye.institutionaladvisors@telus.net WEBSITE www.institutionaladvisors.com
Here’s what to do if they’re right…
 When it comes to the stock market, everything’s always all good… until it isn’t.
And it’s been all good: U.S. stocks have been rallying for nine years, making successive all-time highs, with only sporadic bouts of profit-taking by the Nervous Nellies along the way.
But now, some huge investors – marquee names – are getting nervous.
And they’re letting people know about it, too…
Between them, these giants are pushing around close to $1.7 trillion in capital – more than enough for them to be able to make waves wherever they go.
I’m going to show you what to do if these whales are right; they just might be…
Meet the (Very Wealthy and Powerful) Bears
Ray Dalio, founder of Bridgewater Associates LP, the world’s largest hedge fund with more than $150 billion under management, believes the “magnitude” of the next downturn will be epic. “We fear that whatever the magnitude of the downturn that eventually comes, whenever it eventually comes, it will likely produce much greater social and political conflict than currently exists,” he recently said.
Former “Bond King” Bill Gross, founder of PIMCO LLC and now legendary portfolio manager at Janus Henderson, says, we’re at the highest risk levels since 2008 because “investors are paying a high price for the chances they’re taking.”
Naturally, founder and CEO of DoubleLine Capital Jeff Gundlach – the new “Bond King” – advises “moving toward the exits.” Gundlach’s reducing his positions in junk bonds, emerging-market debt, and lower-quality investments, because he believes investor sentiment will turn negative. “If you’re waiting for the catalyst to show itself, you’re going to be selling at lower prices,” he told Bloomberg.
Wall Street icon Carl Icahn, who regularly loads up on stocks and hits it out of the park, warns he isn’t seeing opportunities given how much stock prices have run up. “I really think now, I look at this market and you just say, ‘look at some of these values,’ and you have to wonder,” he lamented in a CNBC interview in June.
Oaktree Capital founder Howard Marks has been talking about “too-bullish territory.” The billionaire warns “aggressive investors are ‘engaging in willing risk-taking, funding risky deals, and creating risky market conditions.’”
Legendary hedge fund guru George Soros, who in 1992 “broke the Bank of England” and pocketed more than $1 billion doing it, recently sold stocks and bought gold… after a near 10-year hiatus. Just to give you an idea, the last time Soros made a big play was in 2007, when he placed bearish trades on housing in the run-up to the meltdown.
Appaloosa Management’s David Tepper warns investors to stockpile some cash and says he’s “on guard.”
“Everything is expensive and we are late in the business cycle,”Sebastien Page, head of asset allocation at T. Rowe Price, said in an interview with Bloomberg. “That introduces fragility for risk assets, and there isn’t much buffer.”
So, that’s a lot of negativity. But don’t let it ruin your day. Do this instead…
How to Stay Invested and Sleep at Night
Individual investors would be foolish to not heed warnings from so many successful investors.
But that doesn’t mean sell everything. In fact, no one’s saying that, and that’s not a good idea.
 Sure, the market is in nosebleed territory, but it has been for a long time, and it still manages to keep going higher.
If it keeps going higher, the last place investors would want to be is on the sidelines.
Too many would-be investors are on the sidelines and have been there since the market started rallying back in 2009, perpetually afraid the rising market is due for a big correction.
So, is the next “Big One” coming? It might be. But, then again, it may only lookscary up here.
Here’s what you want to do about it… and the way I’d play it: have sell orders ready and waiting.
That means putting down “sell-stop” orders on your positions.
If outright selling overtakes the market, it could be too late to take good profits you’re sitting on.
When markets fall they can do so hard and fast, leaving invested individuals with nothing more than hope that their bleeding positions will find a bottom and bounce back into profitability.
I don’t play the game that way.
I always use stop-loss orders to exit my positions with plenty of profits. I want to sell my shares if they drop to a level I’m uncomfortable with.
That level is different for every stock.
I use two metrics to determine where to place my stops.
First, I look at the stock’s chart. I look for “support” below where the stock’s trading currently.
 Support is a price level where the stock saw a lot of buying. It could be a level where the stock came down to in the past before bouncing back up. Or, it could be a level where there was a lot of sideways movement in the stock before it took off higher. Those levels are indicative of past buying – that’s why they’re called “support levels.”
If the stock breaks below support, you have to figure other investors, who bought the stock at a lower price and saw it break through a resistance level, are also watching that happen.
At the same time, you have to reckon other investors might’ve bought at that support level, or even higher, and are now watching the stock come down.
Either way, they could be freaking out and thinking hard about an exit if it can’t hold support.
In that way, support levels are psychological levels for investors – and especially for traders.
I don’t put my stop orders down right at support levels. Instead, I put them down about 2% to 5% (not percentage points) below where I see support. That’s because aggressive traders often try and push stocks down through support levels so stop-loss orders resting there get triggered. Guess who’s buying your shares from you then? Those big aggressive traders, that’s who. I know, because I used to trade that way in my hedge funds, and believe me, it is a very lucrative game to play.
But, if there’s something wrong with my stock or with the market that breaks support by 2% to 5%, I want out.
The other consideration you have to have when using a stop-loss order is to let the stock move.
If you put a stop-loss order down too close to where the stock is trading, it will probably get hit and you’ll sell your stock, and all too often you’ll be left to watch it rocket higher without you.
I look at the stock’s range of motion over a month. I want to know what kinds of swings up and down it makes. Whatever that range is (say, a 5% range or a 10% range), I’ll place my stop just outside that range, maybe 6% or 11% below where the stock’s trading.
For me, if my stock’s going up and up, and the obvious support is getting further and further away (meaning it’s way below where the stock is now), I’ll keep raising my stop, so I get out if the stock breaks below the range I’ve given it to bounce in.
I always raise my stops after a good up-move.
First and foremost, I look for a new support level; that’s where I prefer to have my stops, just below there. If the stock’s been on a tear, and there’s no real support below where the stock’s come from, I’ll raise my stop to just below the outside range I’ve seen the stock bounce around in.
In other words, if the stock’s going pretty much straight up and isn’t bouncing much, I’ll have a tighter stop because there isn’t much bouncing and not much of a range to measure. That’s okay, because a stock that goes up like that can come down in a hurry too, and I want to capture as much profit as I can.
Using stops is about saving money on the downside and ringing the cash register on the way up.
If your stock has a big move up and you get stopped out with a big profit, that doesn’t mean you can’t buy back into the stock.
No sweat. I do that all the time.
Once you ring the register, you’ve then got fresh capital to apply. You can apply it back into the stock you just got stopped out of if you feel the stock’s going higher. So what if you have to pay up a little more? The stock’s rising, it’s doing what you want it to do.
Just like everyone, I listen to what big investors throwing around billions of dollars are saying and doing. In the end, I do my own thing. But, it would be foolish not to understand what they’re thinking, what they’re investing in or getting out of. It’s information. Use it.
And with stop-loss orders, you can be in the game and sleep at night without worrying if the sky falls on the market tomorrow, or next year, or never.
Shah Gilani is the editor of Zenith Trading Circle. Just click here to check it out…


-
I know Mike is a very solid investor and respect his opinions very much. So if he says pay attention to this or that - I will.
~ Dale G.
-
I've started managing my own investments so view Michael's site as a one-stop shop from which to get information and perspectives.
~ Dave E.
-
Michael offers easy reading, honest, common sense information that anyone can use in a practical manner.
~ der_al.
-
A sane voice in a scrambled investment world.
~ Ed R.
Inside Edge Pro Contributors

Greg Weldon

Josef Schachter

Tyler Bollhorn

Ryan Irvine

Paul Beattie

Martin Straith

Patrick Ceresna

Mark Leibovit

James Thorne

Victor Adair