
Stocks & Equities
Long credit cycles like the current one always end with a crash. But first they deteriorate. The headline numbers remain positive while under the surface a growing list of sectors start to falter. It’s only when the latter reach a critical mass that market psychology turns dark.
How far along is this process today? Pretty far, it seems, as some high-profile industries roll over:
Deep’ Subprime Car Loans Hit Crisis-Era Milestone
(Bloomberg) – Amid all the reflection on the 10-year anniversary of the start of the subprime loan crisis, here’s a throwback that investors could probably do without.
There’s a section of the auto-loan market — known in industry parlance as deep subprime — where delinquency rates have ticked up to levels last seen in 2007, according to data compiled by credit reporting bureau Equifax.
“Performance of recent deep subprime vintages is awful,” Equifax said in a slide show on second-quarter credit trends.
Analysts have been warning for years that subprime car loans pose a threat to lenders as delinquency rates have edged higher since reaching a post-recession low in 2012. But it wasn’t until last quarter that the least creditworthy borrowers started to show the kinds of late payment profiles that accompanied the start of the financial crisis.
“We’re seeing an increase in delinquencies across all credit scores, but in deep subprime, the rise is more substantial. What stood out to me was the issuers. Those that have been doing this for a decade or more were showing the ‘better’ performance, while those that were relative newcomers were in the ‘worse’ category.”

Used Car Prices Crash To Lowest Level Since 2009 Amid Glut Of Off-Lease Supply
(Zero Hedge) – The U.S. auto market is at an interesting crossroads with used car prices crashing to new lows every month while new car prices continue to defy gravity courtesy of a somewhat ‘frothy’, if not suicidal, lending market that has seemingly decided that anyone with a pulse is financially qualified for a $0 down, 0% interest, 80 month loan on a brand new $40,000 luxury vehicle of their choice.
As the Labor Department’s consumer-price index data showed last Friday, used car prices once again dropped in July to the lowest level since the ‘great recession’ of 2009. In fact, since the end of 2015, the cost of used vehicles has dropped in all but three months and are now roughly 10% off their 2013 high.

Junk Bonds Slump as Morgan Stanley Sees a Bigger Unwind Ahead
(Bloomberg) – It could be the beginning of the end for an 18-month rally in junk bonds.
A high-yield bond fund run by BlackRock Inc. slumped on Thursday to its lowest level since March, a day after Morgan Stanley warned a correction may already be underway. The cost of protecting speculative-grade bonds against default in the credit-default swap market climbed to its highest level since July 6. Investors demanded the most extra yield in almost a month to buy junk debt, according to a Bloomberg Barclays index fixed late Wednesday.
Morgan Stanley added its voice to a growing chorus of skepticism surrounding debt valuations, with Pacific Investment Management Co. writing in a report released Wednesday that investors should pare relatively expensive assets like corporate bonds in favor of safer investments like Treasuries. Echoing that view, T. Rowe Price Group Inc.’s Sebastien Page, head of asset allocation, said “everything is expensive.”
“This softness has a good chance of turning into a legitimate correction,” strategists led by Adam Richmond wrote in their note. “Complacency is too elevated.”

The worst is yet to come for retail stocks, says former department store executive Jan Kniffen
(CNBC) – Retail stocks are only going to get uglier, former department store executive Jan Kniffen said Monday.
“I said last year the fourth quarter is going to be the toughest quarter for retailing,” the CEO of consulting firm J. Rogers Kniffen Worldwide Enterprises told CNBC. “It’s not better this year.”
The S&P consumer discretionary sector has fallen about 2.6 percent from one month ago versus the S&P 500’s loss of less than half a percent.
Kniffen said on “Squawk on The Street” that many stores will post bad traffic and same-store sales comparisons this year. Even Black Friday won’t be enough to save many struggling companies, he said.
All of this is being driven by “things going online,” Kniffen added.
Kniffen said he expects many more bankruptcies, including Sears as early as next month, and said more strategic mergers are likely.
—————-
U.S. Stock Buybacks Are Plunging
(Bloomberg) – U.S. stocks have been able to hit fresh highs this year despite a dearth of demand from a key source of buying.
Share repurchases by American companies this year are down 20 percent from this time a year ago, according to Societe Generale global head of quantitative strategy Andrew Lapthorne.

Ultra-low borrowing costs had encouraged large firms to issue debt to buy back their own stock, thereby providing a tailwind to earnings-per-share growth.
“Perhaps over-leveraged U.S. companies have finally reached a limit on being able to borrow simply to support their own shares,” writes Lapthorne.
Whether this is enough to break through the complacency won’t be known until after the fact. But it does fit the historical peak-cycle pattern of sub-sectors faltering before the broader economy. Stay tuned.
‘

Last week’s Market Update – Showtime! – announced that the time had come for a sell-off in equities and we were not disappointed as the Dow lost over 234 points (worst week since March). Internal indicators now point to a pause in the decline. It’s now time for a short Intermission.

One of those indicators is the total number of unchanged issues divided by the total number of issues traded (NYSE). It reached a low on Thursday indicating a low in equities.

A 21-week cycle low is due the week of August 21 (solar eclipse!). Unless equities reach the 38.2% retracement of the 2016 rally near 2,220 by then, I doubt that will be the end of the decline. Rather, it will likely be the beginning of an intermediate bounce in a bigger seasonal decline.
By Ed Carlson
Our recent analysis suggests we may be setting up to repeat history in an odd and dangerous manner. As market technicians, part of our job is to work with numbers, find patterns and attempt to predict future price moves in US and Global markets. As you can imagine, it is not always easy to accurately predict the future. Still, we take on the challenge and truly enjoy being able to find and share trading strategy concepts with our ActiveTradingPartners newsletter. As such, we are sharing this recent technical research data with your today.
Recently, the ActiveTradingPartners research team identified a unique pattern in the VIX that allowed us to accurately predict the June 29 VIX Spike nearly 3 weeks in advance. Also, on July 30th, we predicted a big decline in the NASDAQ during August. It also allowed us to know that VIX Spikes were possible on other future dates – such as the most recent date near August 4th. Even though the current VIX Spike did not hit exactly on the August 4th cycle date, the actual VIX Spike move happened only two trading days after our predicted date and the VIX has rallied over 90% from recent lows. Sometimes, analysis like this allows us to know months in advance that a cycle or critical event may have a higher probability of happening. This allows us to plan and profit from our research.
Today’s research correlates to the recent price moves in the XCI index (Computer Technology), NASDAQ and US Majors. The premise of this research is that the past 4+ years have resulted in a global investment in Technology firms as a result of lower ROI in most other sectors. This focus on technology investing is uniquely similar to the XCI Index DOT COM rally from the late 1990s and early 2000s. We are attempting to verify our presumptions and analysis by using core technical analysis techniques as well as fundamental price analysis.
We’ll start by looking at the price activity leading up to the 2000 DOT COM bubble burst. Initially, our analysis focused on the similarities in price action setting up this price move. The Accumulation, Exuberation/Pause, Hype and eventual CRASH phase. In 1995, the Accumulation phase initiated after a nearly 95% rally from 13+ months earlier (1994 – 462 days total). Currently, the Accumulation phase initiated after a 100%+ rally from 13+ months earlier (2009 – 427 days total). Subsequently, the Accumulation phase lasted 1057 days resulting in a 238%+ advance in 1998. The current Accumulation phase lasted 1456 days resulting in a 77%+ advance in 2014. Interestingly, the 1998 advance totaled 472.50 pts while the 2014 advance totaled 594.00 pts – resulting in a 125% advance size increase.
The Exuberation/Pause phase in 1999 lasted 252 days and resulted in a 207.19 pt move (+31.51%). The Exuberation/Payse phase in 2016 lasted 889 days and resulted in a 288.26 pt move (+21.15%). The more recent phase took 3.5x longer (time) to result in 139% greater price advance (which was actually a reduced percentage move of only 67% of the 1999 advance.
I advanced the term WEEKS where is should have been days.
Many analysts may be quietly stating, “all of this can be attributed to relationships of percentage values vs higher price valuations”, which is of course true. Our attempt at dissecting these moves is to try to understand the propensity and strength of any future moves.
Lastly, the HYPE phase lasted 39 weeks in 2000 ending with an advance of 895.23 pts (+97.94%) from the PAUSE/FLAG breakout in 1999. The current HYPE phase lasted 53 weeks ending with an advance of 674.54 pts (+40.26%) from the PAUSE/FLAG breakout in 2016. The resulting current HYPE price advance is 25% lesser than the 2000 move and results in a nearly 60% decrease related to the total percent swings.
2000 DOT COM – XCI Index Chart

2017 DOT COM – XCI Index Chart
The 2000 total phase advance lasted 220 weeks and resulted in a price advance of +1607.53 pts (+802.39%). The 2017 total phase advance lasted 436 weeks and resulted in a price advance of +1878.21 (+402.97%). The percent values of each move represent vastly different results, yet the total price moves differ by only 17%. We are certain some of these values and percentage representations are sparking interest in some of you as you may understand Fibonacci, Gann and other price analysis techniques.
The key to understanding these similarities is to understand the price sometimes moves in similar, not exact, setups and that we should never discount the possibility that markets are setting up for another massive move. Considering these price and relationship values, it is our perception that any global event, liquidity collapse or massive terrorist event could present a scenario that may result in a repeat of the 2000 DOT COM market collapse. Our premise is that the US has been an investment safe harbor for many and that Technology (FANGs and others) have benefited greatly from the global market weakness over the past 7+ years. It is our opinion that the capital that has been allocated into these global technology giants has, as in the past, setup a potential for history to repeat itself (given the right type of events/circumstances).
COMBINED DOT COM – XCI Index Charts

Our recent VIX Spike analysis shows we should expect future VIX Spikes on Aug 23rd, Sept 11th or 12th and finally Sept 28th or 29th. Assuming the relationship between the current price setup and the past setup is relative to the types of relationships we’ve studied so far, we can predict the following :
The initial swing low after the ultimate high (2000) resulted in a 572.02 pt move (a 31.62% correction over 10 weeks). Any current correction could result in an 8~15.5% price correction over 7~15 weeks. This would put our estimates of a price low near 2152~1980 on or near Sept 25th or Oct 23rd. This price low would be followed by 4~12 weeks of price advance setting up a right shoulder near 2150~2256 (possibly). Following that, we would see the low price rotation broken by extreme selling pressure and ultimate low target near 770~581 (resulting in a 63~69% correction from the highs).
Do we know this WILL happen? NO. Can we estimate the probability of it happening as we predicted? NO. How can we tell if this will play out as we are predicting? If the market continues to break down and begins to form the right shoulder, then we would consider, at least this first phase, to be technically accurate. If it fails to move lower to establish this move, then we would consider this a technical breach of our research and attempt to reevaluate our theories.
Thus, what we can do at this point is alert you to the potential that a massive Head-n-Shoulders formation may be setting up in the global/US markets related to a potential Tech Bubble. The proof will come with confirmation of our analysis or the failure of our analysis as price plays out over the next few weeks.
Still, the correlation of the VIX SPIKE dates, Aug 23rd, Sept 11th or 12th and finally Sept 28th or 29th, are interesting because our initial analysis of any price low indicates a potential low price date range near September 25th. Should this become true, an 8~15% correction in the XCI would clearly result in a 4~9%+ correction in the NQ and would correlate with our VIX Spike analysis almost perfectly.
The only thing we can do is be aware of these relationships and price patterns that are setting up and plan our trades properly. Every trade includes risk, attempting to manage that risk is the objective of most traders. At this point, Aug 23rd, Sept 11th or 12th and finally Sept 28th or 29th are critical dates to keep in mind as the future plays out before us. Watching for these moves and being aware that they could be setting up for a massive price swing lower are important factors to consider and being able to protect open LONG positions would not be a bad idea over the next few months.
The only way one can tell if predictions of the future are going to be accurate or not is to wait for the future to get here and see how well these predictions worked out. So, we wait with the understanding that we are watching for confirmation or failure of our analysis with each week.
If you like our research and analysis and want to learn more about our forecasting and trade alert services, to see what we can offer you. We provide daily market updates, clear and concise trading triggers/signals, advanced research and analysis of the US and global markets and more.
Chris Vermeulen

The loss, of the leadership of the banking and financial sector, BKX ETF:( http://etfdb.com/index/kbw-bank-index/), is now a major warning signal which is what is required in order to move the SPX much HIGHER, at this time!

The divergence which is currently being seen between the Dow Industrials and Dow Transportation indexes will be coming into play in the upcoming weeks.

The U.S. dollar has declined to a 52-week low. When stocks have been at a high and the dollar at a low, historically, the SPX showed a positive return within six months to one year, almost without exception. I see support in the 92.50 area.

I would expect to see a very quick “oversold” bounce in GLD, then a correction to the 105 to 107 areas as the final “washout bottom” is put into place.

My approach to the markets is to be flexible enough to handle the possibilities of much stronger and weaker sustained trends than what we have seen in our investment lifetimes.
Our portfolio has outperformed the SPY by over 114% this year. Quite a feat when you consider the SPY is up nearly 9% this year and has almost gone straight up since January 2017.
We like to ask our clients and viewers this question, “isn’t it time you invested in your future?”. We would really like to help you achieve greater success and find greater opportunities in the markets, but you have to subscribe for this to happen.
Conclusion:
In short, active traders should be defensive over the next few days as we could have one more bout of selling in stocks and a spike in the vix. I feel the best plays right now will be short metals, short oil, long dollar.
By Chris Vermeulen
Our intraday outlook is bearish, and our short-term outlook is bearish, as we expect downward correction. Our medium-term outlook remains neutral:
Intraday outlook (next 24 hours): bearish
Short-term outlook (next 1-2 weeks): bearish
Medium-term outlook (next 1-3 months): neutral
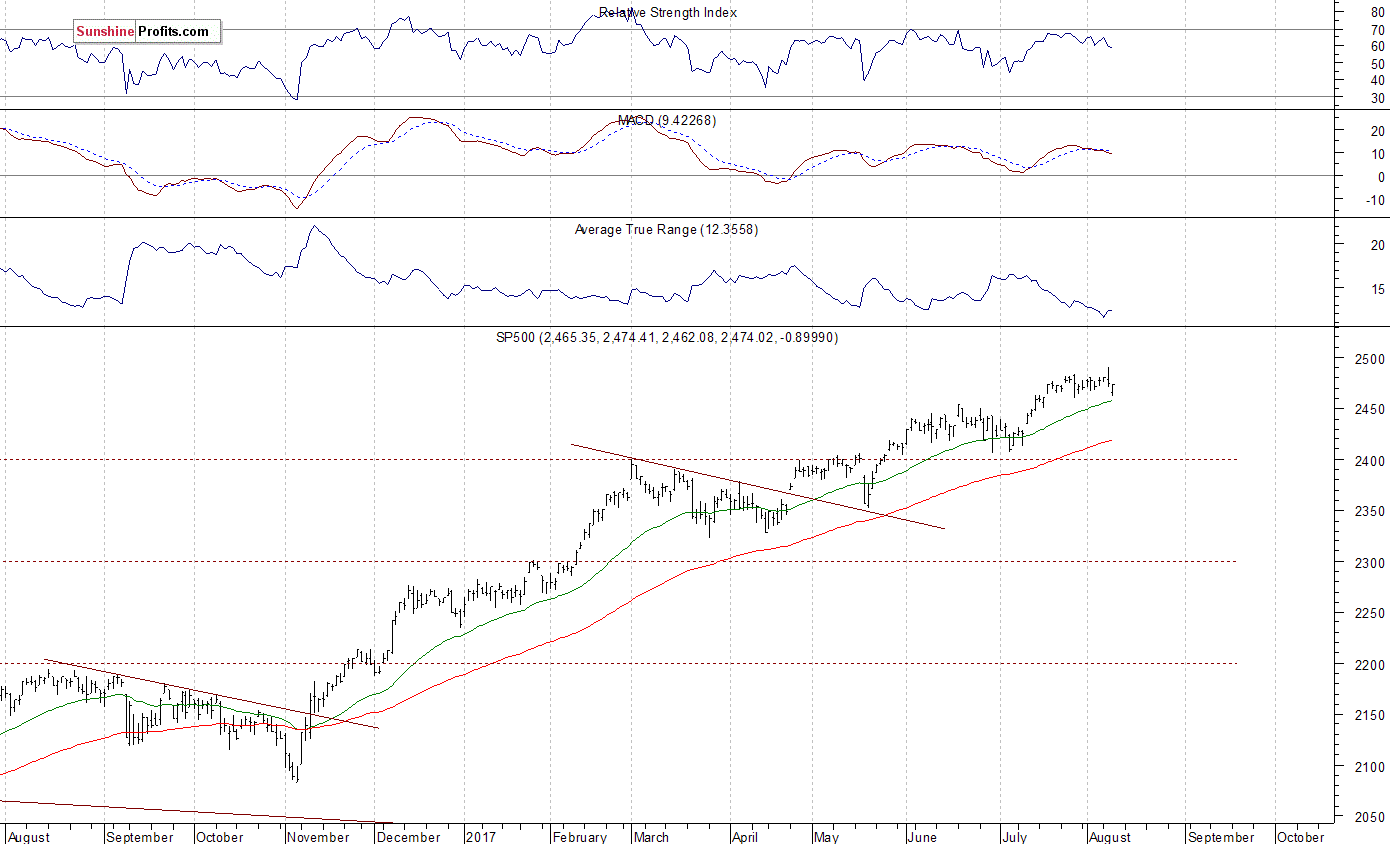
The U.S. stock market indexes were mixed between -0.3% and 0.0% on Wednesday, extending their short-term fluctuations, as investors continued to take profits off the table following some negative geopolitical news, among others. The S&P 500 index has reached new all-time high at the level of 2,490.87 on Tuesday, before reversing lower. The broad stock market gauge bounced off resistance level at around 2,490-2,500. The Dow Jones Industrial Average lost 0.2% yesterday, as it extended its Tuesday’s move down off new record high. The technology Nasdaq Composite lost 0.3%, as it was relatively weaker than the broad stock market again. The nearest important support level of the S&P 500 index remains at 2,460-2,465, marked by July 19 daily gap up of 2,460.92-2,463.85 along with yesterday’s daily low of 2,462.08. The next level of support is at 2,450-2,455, marked by June 19 local high. The support level is also at 2,430-2,435, marked by July 12 daily gap up of 2,429.30-2,435.75. On the other hand, level of resistance is at 2,485-2,490, marked by all-time high along with previous local high. The next resistance level is at 2,500 mark. There have been no confirmed negative signals so far. However, we can see medium-term overbought conditions and negative technical divergences. The S&P 500 index trades within an almost month-long consolidation, as we can see on the daily chart:
Futures Lower
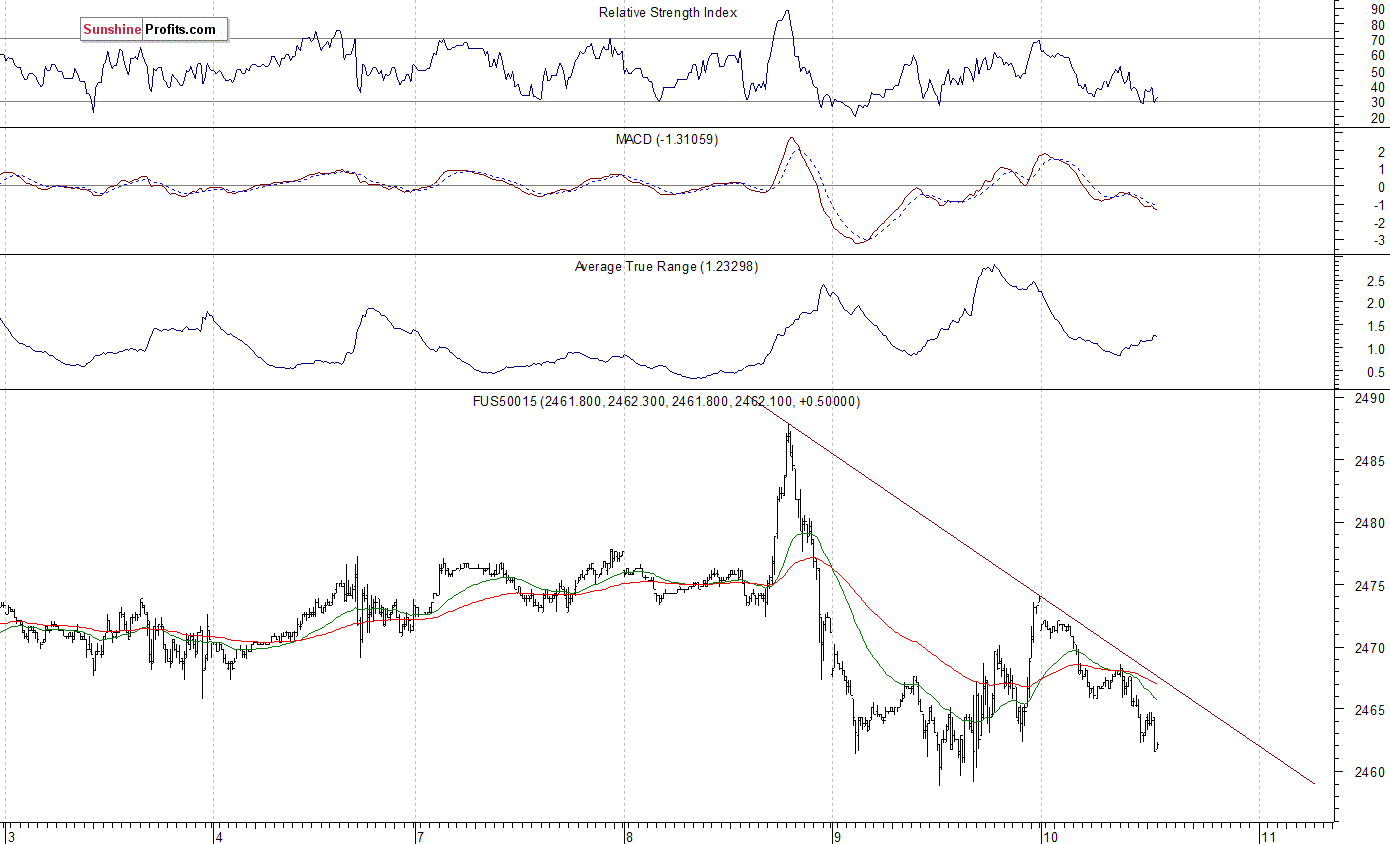
Expectations before the opening of today’s trading session are negative, with index futures currently down between 0.2% and 0.6% vs. their Wednesday’s closing prices. The European stock market indexes have lost 0.4-1.2% so far. Investors will now wait for some economic data announcements: Producer Price Index, Initial Claims at 8:30 a.m. The market expects that Producer Price Index grew 0.1% in July, and Initial Claims were at 240,000 last week. The S&P 500 futures contract trades within an intraday downtrend, as it retraces yesterday’s intraday move up. The market trades within a short-term consolidation following Tuesday’s intraday reversal. The nearest important level of resistance is at around 2,470-2,475, marked by local high. The next resistance level remains at 2,480-2,490, marked by record high. On the other hand, support level is at 2,460, marked by short-term local low. The next support level remains at 2,450, among others. Will the market break below this short-term consolidation? It is currently trading close to lower consolidation band:
Nasdaq Still Weaker
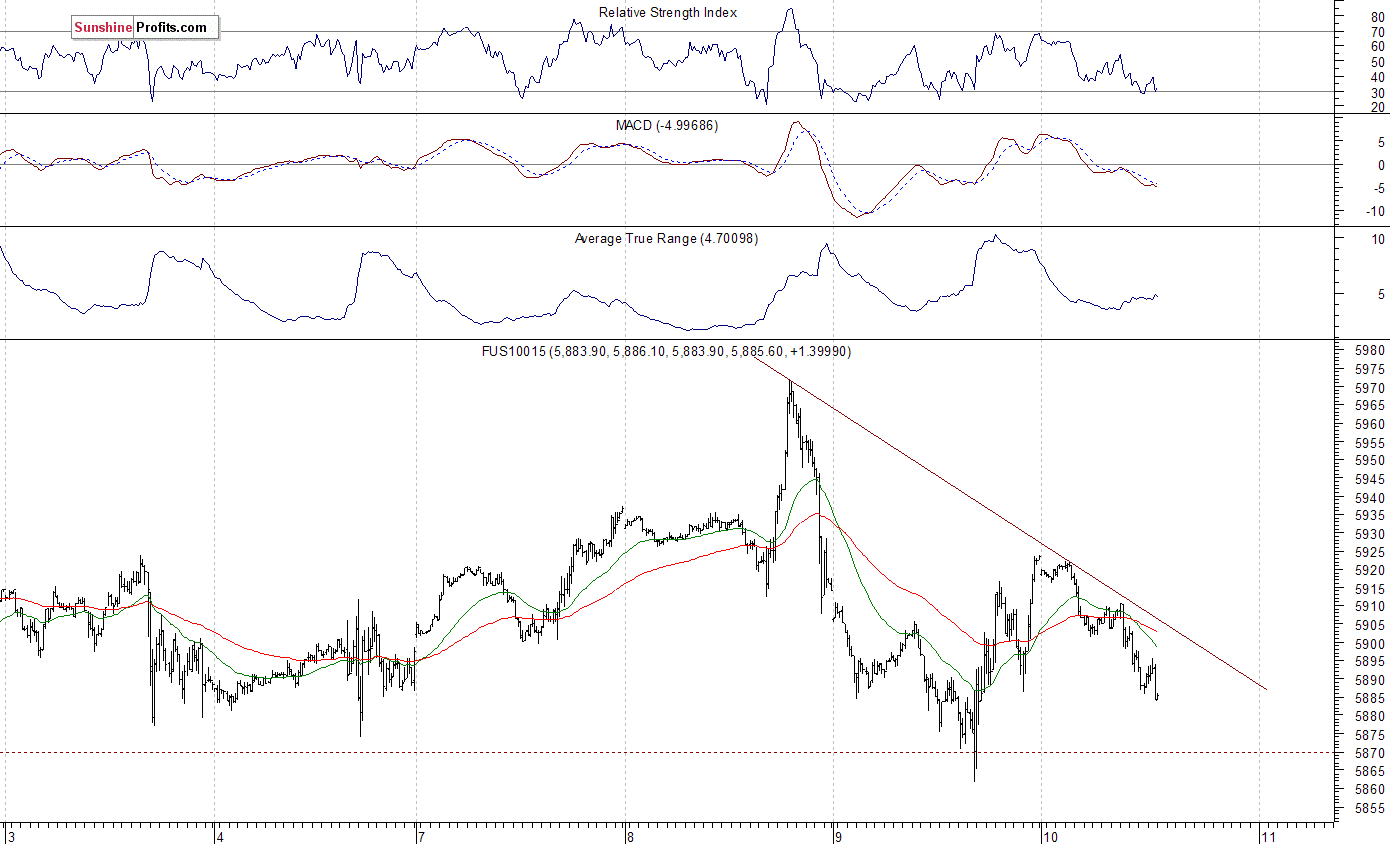
The technology Nasdaq 100 futures contract follows a similar path, as it retraces some of yesterday’s intraday rebound off support level at around 5,860. The market remains within a few-week-long trading range along new record high, slightly below the level of 6,000. The nearest important level of resistance is at around 5,920-5,930, marked by short-term local highs. The next resistance level remains at 5,950-6,000. On the other hand, support level is at 5,850-5,870, marked by short-term local lows, as the 15-minute chart shows:
Concluding, the S&P 500 index continued to fluctuate on Wednesday, as it retraced some of Tuesday’s decline. Is this a short-term bottom or just pause before another leg down? The index extends its almost month-long consolidation following early July move up. Is this just flat correction before another leg up or some medium-term topping pattern? There have been no confirmed medium-term negative signals so far. However, the market remains technically overbought. We can also see some negative technical divergences.
If you enjoyed the above analysis and would like to receive free follow-ups, we encourage you to sign up for our daily newsletter – it’s free and if you don’t like it, you can unsubscribe with just 2 clicks. If you sign up today, you’ll also get 7 days of free access to our premium daily Gold & Silver Trading Alerts. Sign up now.
Thank you.
Paul Rejczak
Stock Trading Strategist

-
I know Mike is a very solid investor and respect his opinions very much. So if he says pay attention to this or that - I will.
~ Dale G.
-
I've started managing my own investments so view Michael's site as a one-stop shop from which to get information and perspectives.
~ Dave E.
-
Michael offers easy reading, honest, common sense information that anyone can use in a practical manner.
~ der_al.
-
A sane voice in a scrambled investment world.
~ Ed R.
Inside Edge Pro Contributors

Greg Weldon

Josef Schachter

Tyler Bollhorn

Ryan Irvine

Paul Beattie

Martin Straith

Patrick Ceresna

Mark Leibovit

James Thorne

Victor Adair