
Stocks & Equities

Last month I told you about the upcoming rebalance of the hugely popular VanEck Vectors Junior Gold Miners ETF (GDXJ), and how it would distress shares of junior, small-cap mining stocks. I said then that the rebalance could create some excellent opportunities for astute investors to accumulate high-quality, well-managed producers at discount prices.
That day has finally arrived, bringing with it a tsunami in the junior resource space, as I told Collin Kettell on Palisade Radio the week before. It’s a buyer’s market—if you know what you’re looking for. The last time the GDXJ underwent a rebalance of this magnitude was in December 2014, so I see this as a rare event savvy investors shouldn’t miss out on.
But first a reminder of what’s been happening with the GDXJ. Basically, it had become too massive for its underlying index—composed mostly of Canadian junior gold producers—with assets rising close to $5.5 billion earlier this year, up from $1 billion only last year.
Mo Money Mo Problems
Normally this wouldn’t be such a concern. But the GDXJ was getting precariously close to owning a 20 percent share of several names in its index, which would have triggered all sorts of regulatory and tax conundrums in Canada and the U.S.
So the fund made several adjustments to its methodology, including raising the market cap threshold of allowable companies to $2.9 billion, up sharply from $1.6 billion. This means it can now hold large producers that don’t appear in its index, the MVIS Global Junior Gold Miners Index. It also means that a number of smaller constituents were down-weighted or divested altogether, giving investors less exposure to junior miners than what the fund’s name implies.
Before any of this took effect, though, many investors, hedge funds and other market participants acted on the rebalance news by indiscriminately selling down their junior mining assets. This introduced fresh volatility to underlying stocks and depreciated prices.
The selloff, I might add, was done mostly without regard for the phenomenal fundamentals and growth profiles some of these companies reported.
These Miners Get High Grades
Take one of our favorite names, Wesdome Gold Mines. The Toronto-based producer has been operating in Canada for 30 straight years as of 2017 and currently carries no debt. Two of its mines, Eagle River and Mishi, are among Canada’s highest-grade gold mines. Last summer, the company made headlines when it discovered gold at its Kiena property in Quebec, sending its stock up an amazing 49 percent to $2.24 on August 25.

When Wesdome was added to the GDXJ in March, it cast newfound attention on the $417 million company. Only a month later, the rebalance was announced, and since then, its stock has eased about 19 percent.
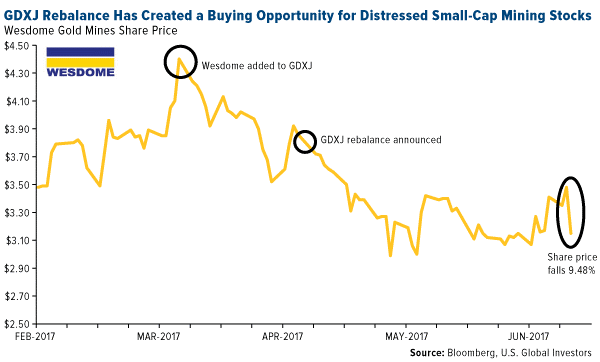
I see this as a can’t-miss opportunity for retail and institutional investors to start nibbling on Wesdome and other junior miners that have been similarly knocked down only because of fund flows.
That includes Gran Colombia Gold, the largest gold and silver producer in Colombia, and Klondex Mines, whose Fire Creek Mine in Nevada was estimated to be the highest-grade underground gold mine in the world. (According to IntelligenceMine, Fire Creek averaged 44.1 grams per metric ton (g/t) in 2015, double the ore grade of the world’s number two project, Kirkland Lake Gold’s Macassa Mine, at 22.2 g/t.)
Gran Colombia announced last week that it produced 15,444 ounces of gold in May, representing a new monthly record for the company. This brings the total amount for the first five months of the year to 68,783 ounces, an impressive 21 percent increase over the same period last year. The Canadian-based producer has a very attractive convertible bond that pays monthly.
I’ve frequently praised Klondex for its frugality, strong revenue growth and exceptional management team. The last time I visited Vancouver, I had the opportunity to chat one-on-one with its president and CEO, Paul Andre Hurt, who has 30 years of experience in high-grade mining. Not only is Paul a highly-respected chief executive in the mining space, he’s also a devoted father of five.
A Golden Opportunity
The GDXJ rebalance represents a rare opportunity to accumulate high-quality junior producers at discount prices. I always recommend a 10 percent weighting in gold—5 percent in gold stocks or mutual funds, 5 percent in bars, coins and jewelry.
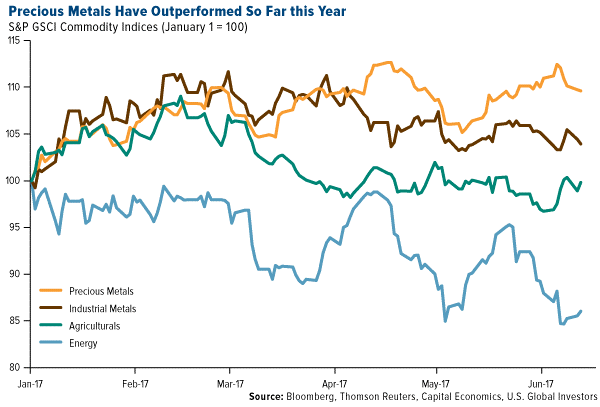
Commodity prices have lately underperformed equities mostly on subdued oil demand growth, with the S&P GSCI commodity index falling about 4 percent over the last month. If we separate the index components, however, we see that precious metals have posted positive gains year-to-date along with industrial metals.
As I mentioned recently, gold imports in China and India, the world’s top two consumers of the yellow metal, have advanced strongly this year on safe haven demand. China boosted its gold purchases from Hong Kong as much as 50 percent this year to 1,000 metric tons, the most since 2013. India’s imports rose fourfold in May compared to the same month last year as traders fear a higher tax rate on jewelry.
With the GDXJ down-weighting junior producers, investors might wonder how they can get broad exposure to small-cap mining stocks.
Explore one such opportunity by clicking here!

In my most recent Money and Markets articles, I’ve put you on the inside track about a rapidly growing, yet mostly still under-the-radar, industry. One that the world’s super-rich are quietly funding with their own money, in pursuit of potentially eye-popping investment returns.
I then told you that industry was the legal cannabis business.
What’s more, I reported that, according to reputable market research, the legal marijuana industry in the U.S. was a $3.4 billion business in 2015. In 2016, this market doubled to $7.1 billion.
Now, two major studies show that legal marijuana sales will top $40 billion in the U.S. over the next five years. That number could surge to $50 billion over the next decade … or sooner.
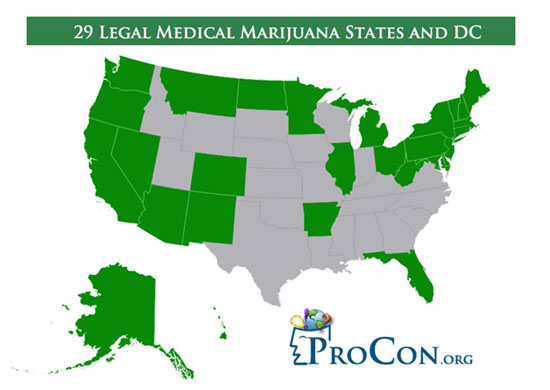
Marijuana is legal in more than half of the states in the U.S., for medicinal and even recreational use. With marijuana going mainstream, some of corporate America’s most-profitable and high-profile industries are recognizing the threat marijuana poses to their profits.
And they are starting to fight back in a big way …
Last week, you learned that the marijuana industry’s biggest enemy is not the Trump administration or U.S. Attorney General Jeff Sessions.
Rather, it’s the Big Pharma companies like Teva Pharmaceuticals (TEVA), Pfizer (PFE), Johnson & Johnson (JNJ) and Allergan (AGN). Companies with big stakes in the pain-treatment game.
But the legal-pot business faces another formidable foe.
Just like Big Pharma, the booze business is scrambling to protect billions of dollars of its own revenue.
Yes, ironically, that’s the very same industry that made Joe Kennedy Sr. rich. If you’ll remember from my May 26 article, alcohol sales funded the Kennedy family fortune when Prohibition was repealed in the U.S. in the 1930s.
And now, the big players in the alcohol business are beginning to push back on the marijuana legalization initiative.
Here’s why …
If the estimated yearly demand for marijuana is in the right ballpark, then more Americans crave cannabis than cabernet or candy bars.
This puts the potential market for recreational marijuana in the Big Three of America’s vices … trailing only cigarettes and beer, as shown below.

The booze business’s paranoia seems to be justified, according to data from well-regarded Wall Street investment research firm Cowen & Co.
That’s because the number of drinkers who also smoke cannabis has increased over the past decade. At the same time, the number of cannabis smokers who drink has declined.
Indeed, Cowen analyst Vivien Azer said the alcohol industry is the group that could lose the mostif marijuana is legalized at the federal level.
All told, Cowen estimates that the recreational pot industry will reach $50 billion in sales by 2026.
“There is real risk to alcohol consumption,” Azer said. “If consumers are going to dual use, I would expect that they would moderate their alcohol consumption to accommodate the addition of a second social lubricant.”
“We believe alcohol could be under pressure for the next decade, based on our data analysis covering 80 years of alcohol and 35 years of cannabis incidence in the U.S.,” Azer wrote in a note to clients. “Since 1980, we have seen three distinct substitution cycles between alcohol and cannabis; we are entering another cycle.”
Following on, she noted that during the three most recent cycles of alcohol consumption, there was a “notable inverse correlation with cannabis use.”
Moreover, alcohol consumption in the 18- to 25-year-old demographic has declined for five straight years (through 2015). Meanwhile, marijuana usage has increased.
Here’s a chart that Azer used to make her point …

Armed with this information, Cowen recently lowered its rating on Molson Coors (TAP) from “Outperform” to “Market Perform.” It also reduced its TAP price target to $105 from $120, saying the beer company’s sales will suffer due to increasing marijuana use in Canada.
But there’s even more bad news for the booze industry …
Some 27% of beer drinkers said they have already substituted cannabis for beer … or would make that switch if marijuana was legal in their state.
That’s according to a recent report from the Cannabiz Consumer Group (C2G). C2G is a market research firm that specializes in forecasting the impact of cannabis on consumer spending.
C2G says that brewers — who in 2015 sold more than $105 billion worth of beer — stand to lose the most from the trade-off between alcohol and marijuana. Specifically, about $2 billion annually. They also note that wine and hard-spirits sales will be affected.
Ultimately, their research analysts project, “Cannabis will cost beer 7% of its market and create a new $50 billion industry.”
$50 billion is nothing to take for granted!
And with $50 billion at stake, it’s no wonder the alcohol industry has been caught multiple times lobbying to keep pot illegal.
Since it’s likely only a matter of time before consumers decide to “fire one up” instead of “turning one up,” you should consider adding some marijuana stocks to your portfolio.
But with more than 200 marijuana stocks currently available on the publicly traded markets, you’ll need to do your homework, be selective and carefully consider your own risk profile.
Best wishes,
Bill Hall

The Life Expectancy of Economic Expansions
Introduction
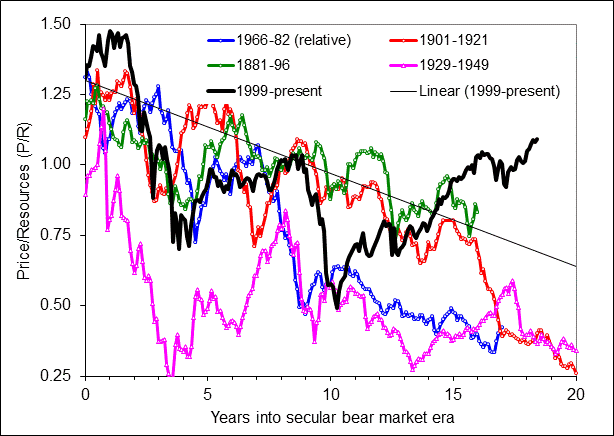
Two years ago, I wrote an article forecasting a large decline in the stock market in the next three years.[1] The focus of the article was on the forecasted size of the anticipated bear market and the justification for this forecast. There was no discussion of when such a decline might happen. In fact, the only mention of timing was in the title, which implied that it would start within the next three years. This three-year figure was the result of no deep analysis, I simply noted that the current business cycle had been going on for 7½ years and the longest business cycle on record lasted about 10½ years. The three years were simply the difference between these two. As the figure at the top shows, P/R had started to fall around the time of the article and continued to do so for nearly a year. Since then a new rally has ensued and the market has moved to higher valuations.
The new advance raises the question of just when is this decline going to happen, or is the analysis simply wrong? Since the anticipated large bear market would be accompanied by a recession, this question can be reframed as when will this expansion end, or, just how long do economic expansions last?
Analysis
The best evidence for a natural length for expansions is the fact that none of the 17 peacetime expansions before 1933 lasted longer than 36 months. Figure 1 plots the probability that one of these expansions was still in progress as a function of length. The dotted line is a linear regression fit, which implies these expansions had a natural lifespan of just over three years.
Figure 1. Distribution of business expansion lengths (data from NBER)

Three quarters of business expansions since 1933 have been longer than 36 months suggesting that something changed around that allows business expansions to survive longer today. One possibility is government policy. The economic expansions during the Civil War and World War I, at 46 and 44 months respectively, were longer than any of the other expansions before 1933. The reason for this is easy to understand, while the war lasts and the government is buying massive quantities of war materiel, recession is unlikely. In the aftermath of the 1929-1933 economic depression, the Roosevelt administration engaged on a program of massive monetary stimulation, by suspending the gold standard, followed by creation of a series of government job-creation and welfare programs. These programs provided a program of government spending like that during a war. As a result, the federal deficit averaged over 4% from 1933 to 1937, when spending was cut, bringing the budget back into balance in 1938. This expansion, at 49 months was the longest in history up to that time.
The US entered World War II during the next expansion, which then lasted until 1945, establishing a new record length of 80 months. Furthermore, this expansion was not followed by a deep depression that undid much of the employment gains made during the WW I and New Deal expansions. This experience led to changes in economic belief systems symbolized by the 1946 Employment Act, which authorized the government to promote maximum employment, production, and purchasing power and established the council of economic advisors.[2] The economic views of political and economic elites became more favorably disposed towards countercyclical policy intended to moderate the business cycle. Economic expansions grew longer as policymakers gained experience. The record-long WW II expansion was exceeded by business cycles in the 1960’s, 1980’s, 1990’s, and today. Fifteen years ago, I noted this 1933 shift in length in an article on the relation between business cycles and longer economic cycles in which I classified the periods before and after 1933 as unregulated and regulated eras.[3]
The fact that the last expansion ended quite early compared to adjacent cycles suggests that policymakers have not yet conquered the business cycle, economic expansions still end, and lengths have not been monotonically increasing. To this end the analysis of economic expansion longevity presented earlier still seems appropriate. Figure 1 also shows a plot of the 13 expansions in the regulated era. Two regression lines were needed to fit the data. Extrapolation of the second implies a lifespan for regulated expansions of just under 11 years.
Another way to think about this is in terms of the probability of recession as a function of length or in terms of the number of years an expansion can be expected to last given its age. Table 1 shows the results of calculations of these statistics for the regulated era. Shown is the probability of recession in the next year for expansions in regulated era. Also shown is the expected length of expansion as a function of its current age. The values for expansion lengths beyond 10 years (the longest one ever) is based on the extrapolation of the regression line shown in Figure 1.
Table 1. Expansion mortality rate and life expectancy of expansions as a function of age
| Year | Recession Probability (%/yr) | Life Expectancy (yrs) |
| 4 | 15 | 7.4 |
| 5 | 17 | 7.9 |
| 6 | 21 | 8.4 |
| 7 | 26 | 8.9 |
| 8 | 35 | 9.4 |
| 9 | 55 | 9.9 |
| 10 | 73 | 10.4 |
When I wrote the June 2015 article, the current expansion was 6 years old, for which Table 1 implies it would last another 2½ years. Since the stock market typically peaks about six months before the economy, this suggests a peak around two years later, or about now. Such an expectation is consistent with the three years given in the article title. But given that the business expansion is now 8 years old, Table 1 projects a median value of 1½ additional years of expansion, corresponding to a bull market peak about a year from now. That is, there is now a 50% probability that the current bull market will end more three years after June 2015. Based on the 11-year projected lifespan, this expansion could last as long as another three years. Assuming the median expectation of another year for the bull market, extrapolation of the post-election rally projects a level approaching 25000, implying a much larger decline than the 10000-point forecast in 2015.
References:
[1] Alexander, M. A., 10000 point decline in the Dow in the cards over the next three years, Safehaven, June 10, 2015. (http://www.safehaven.com/article/37933/stock-cycles)
[2] De Long, J. Bradford, 1996, Keynesian, Pennsylvania Avenue Style: Some Economic Consequences of the Employment Act of 1946, Journal of Economic Perspectives, 10(3), 41-53. http://www-personal.umich.edu/~kathrynd/JEP.DeLong.pdf
[3] Alexander, M. A., Generations and Business Cycles – Part I, Safehaven, November 6, 2002. (http://www.safehaven.com/article/85/generations-and-business-cycles-part-i)
A few stocks stand out in the 133 names on our list of monthly Upside Exhaustions as of June 5th; Facebook, Amazon, Netflix, Google and Microsoft.
Microsoft has a thirty-year history with six such signals and downside breaks of 12% to 35% before bottoming:
7/13/90 35% 4/19/91 22% 1/17/92 26%
7/21/95 26% 1/31/97 12% 11/14/14 19%
These corrections/consolidations lasted two to six months. Therefore, it would be appropriate for long- term investors to consider selling call options against current holdings. Traders should maintain tight stops.

The complete list of monthly Exhaustions as of June 5th in order of descending price:
NVR, AMZN, GOOGL, GOOG, ISRG, MTD, EQIX, CCL.B.TO, ULTA, BCR, MELI, AVGO, RE, BIO, MTN, TFX, GD, BDX, UNH, TMO, IDXX, NFLX, ROK, SVXY, LRCX, ANET, FB, MCD, SOXX, SYK, ITW, CB, ADBE, NEE, EFX, SHOP.TO, TAL, WCN.TO, AON, BABA, DE, FISV, ESLT, EA, ADSK, ALB, TQQQ, DTE, DGX, KLAC, CNR.TO, JKHY, SOXL, AFG, BMA, ACGL, WCN, V, CGNX, GPN, RACE, SUI, IDA, PNW, Q, FSV.TO, CBOE, SMH, FIS, ELS, ALL, MCHP, ATO, TXN, EIX, HTHT, TTWO, BR, EDU, SNPS, APH, MSFT, NEN, PCG, TTC, TMUS, RAI, PF, PAM, DOX, VVC, ATVI, BAX, WPK.TO, NFI.TO, AEE, AOS, BIP.UN.TO, CSX, PYPL, CHD, ANTX, GRT.UN.TO, EMA.TO, XEL, GGAL, CMS, AMAT, INFO, AGR, TRU, MZOR, ROL, PGR, GDDY, CMCSA, LNT, LOGI, TSM, TER, CDNS, MFI.TO, MU, BSX, NI, SQ, BLX.TO, ZPIN, CAS.TO, TGS, STM, TH.TO, AAR.UN.TO


BOB HOYE, INSTITUTIONAL ADVISORS
EMAIL bhoye.institutionaladvisors@telus.net WEBSITE www.institutionaladvisors.com
Opinions in this report are solely those of the author. The information herein was obtained from various sources; however, we do not guarantee its accuracy or completeness. This research report is prepared for general circulation and is circulated for general information only. It does not have regard to the specific investment objectives, financial situation and the particular needs regarding the appropriateness of investing in any securities or investment strategies discussed or recommended in this report and should understand that statements regarding future prospects may not be realized.
Investors should note that income from such securities, if any, may fluctuate and that each security’s price or value may rise or fall. Accordingly, investors may receive back less than originally invested. Past performance is not necessarily a guide to future performance. Neither the information nor any opinion expressed constitutes an offer to buy or sell any securities or options or futures contracts. Foreign currency rates of exchange may adversely affect the value, price or income of any security or related investment mentioned in this report. In addition, investors in securities such as ADRs, whose values are influenced by the currency of the underlying security, effectively assume currency risk. Moreover, from time to time, members of the Institutional Advisors team may be long or short positions discussed in our publications.
Alert originally sent to subscribers on June 8, 2017, 6:56 AM
Our intraday outlook is now bearish, and our short-term outlook is bearish. Our medium-term outlook remains neutral, following S&P 500 index breakout above last year’s all-time high:
Intraday outlook (next 24 hours): bearish
Short-term outlook (next 1-2 weeks): bearish
Medium-term outlook (next 1-3 months): neutral
Long-term outlook (next year): neutral
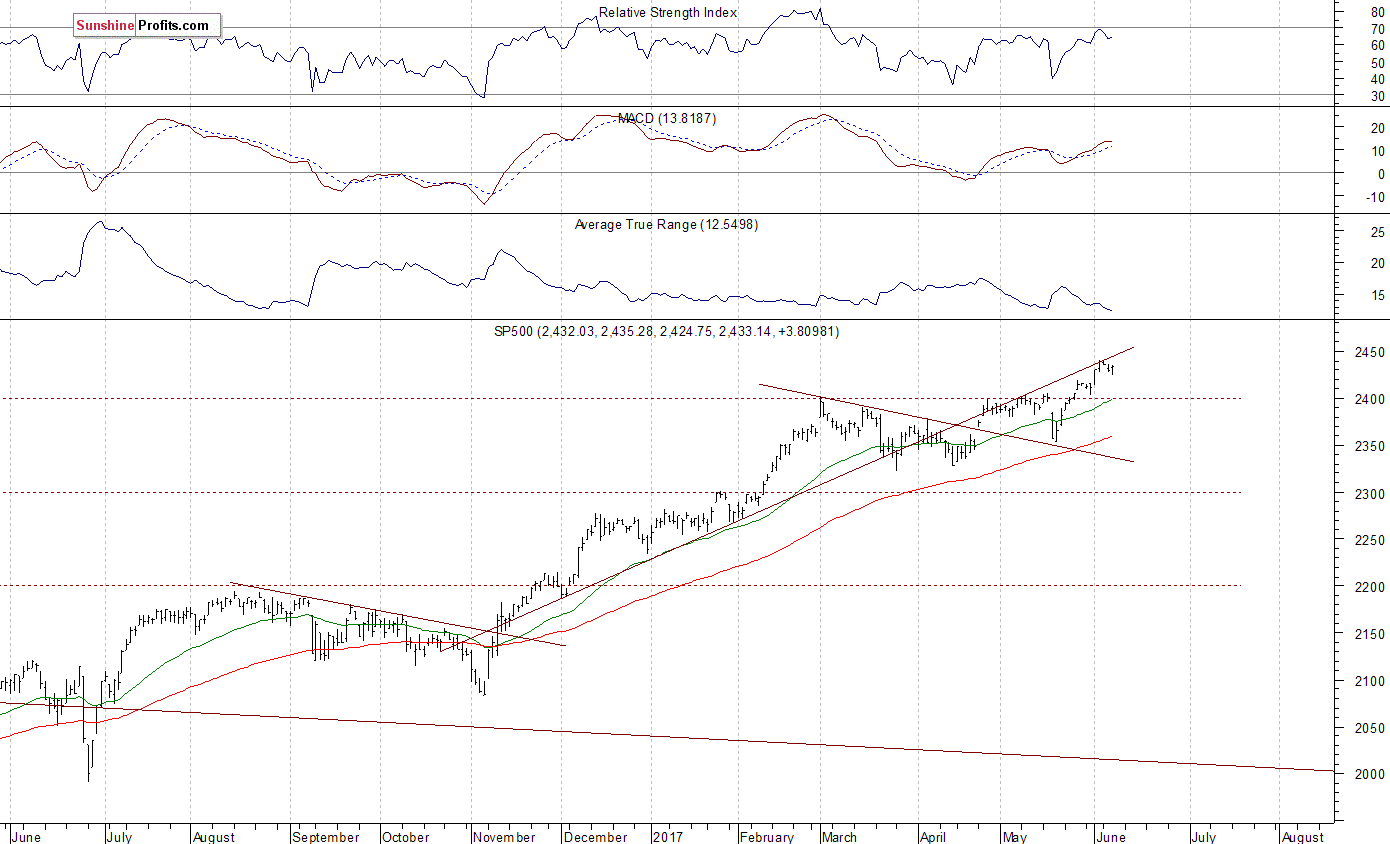
The main U.S. stock market indexes gained 0.2-0.4% on Wednesday, extending their short-term consolidation, as investors continued to hesitate following recent rally. The S&P 500 index trades just 0.3-0.4% below its last Friday’s new all-time high of 2,440.23. It has broken above week-long consolidation along 2,400 mark recently. Stocks have rebounded strongly after their mid-May quick two-session sell-off. They continue their over eight-year-long bull market off 2009 lows. The Dow Jones Industrial Average remained below the level of 21,200 on Wednesday, following last Friday’s advance to new record high of 21,225.04. The technology Nasdaq Composite remains relatively stronger than the broad stock market, as it continues to trade along the record level of 6,310.6. The nearest important resistance level of the S&P 500 index is at around 2,440-2,450, marked by new record high, among others. On the other hand, support level is currently at around 2,415-2,420, marked by previous resistance level. The next support level is at 2,400-2,410, marked by the May 25 daily gap up of 2,405.58-2,408.01, among others. The support level is also at 2,390-2,395, marked by some short-term local lows. Will the uptrend continue towards 2,500 mark? There have been no confirmed negative signals so far. However, we can see some overbought conditions and negative technical divergences. The S&P 500 index is currently trading close to its November-April upward trend line, as we can see on the daily chart (click all charts for larger version)
Positive Expectations Following Yesterday’s Rebound
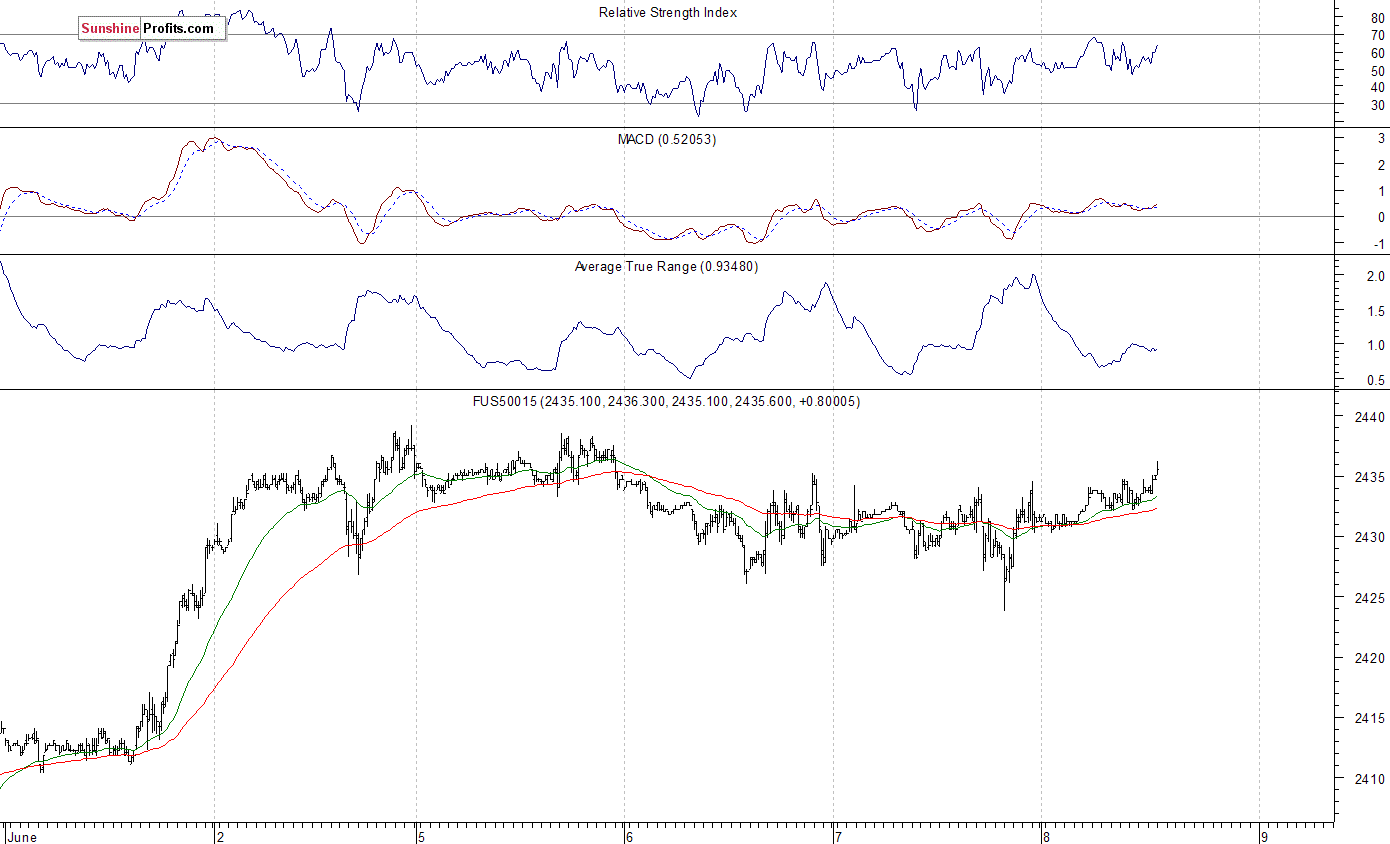
Expectations before the opening of today’s trading session are positive, with index futures currently up 0.2% vs. their Friday’s closing prices. The European stock market indexes have been mixed so far. Investors will now wait for the Initial Claims number release at 8:30 a.m. The market expects that it was at 240,000 last week. The S&P 500 futures contract trades within an intraday consolidation, following an overnight move up. It continues to trade relatively close to Friday’s new record high along the level of 2,440. The nearest important resistance level is at around 2,435-2,440. On the other hand, support level is at 2,425-2,430, marked by recent local lows. The next support level remains at 2,400-2,410. The market trades within a short-term uptrend, as it is above the early March local high. There have been no confirmed negative signals so far. However, we can see some short-term overbought conditions, along with negative technical divergences:
Technology Stocks Remain Relatively Very Strong
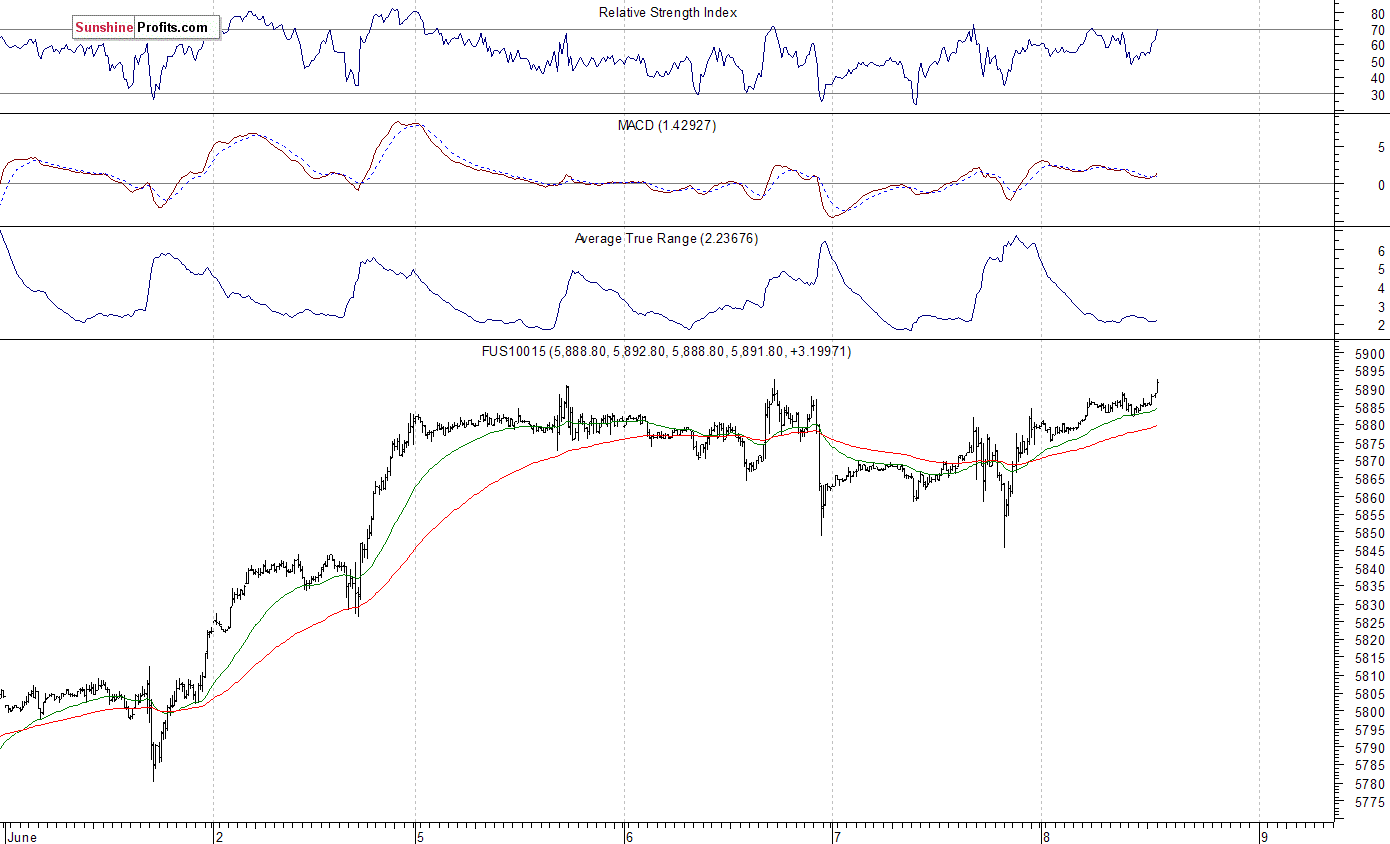
The technology Nasdaq 100 futures contract follows a similar path, as it currently trades within an intraday consolidation along the level of its all-time high. The market extended its six-week-long rally following late April breakout above the level of 5,500. The nearest important level of resistance is at around 5,890-5,900. Potential level of resistance is also at 6,000 mark. On the other hand, the nearest important level of support is at around 5,830-5,850, marked by recent fluctuations. The next support level is at 5,800-5,820, marked by short-term consolidation. There have been no confirmed negative signals so far. But will technology stocks continue their rally despite some short-term overbought conditions? We can see some negative technical divergences:
Concluding, the S&P 500 index continued to trade within a short-term consolidation on Wednesday, as investors remained uncertain following recent rally. The broad stock market extended its gains after a breakout above early March high along the level of 2,400. But will the uptrend continue despite some negative technical divergences along with overbought conditions? Is this some topping pattern before downward reversal or just another flat correction within an uptrend? There have been no confirmed negative signals so far.
If you enjoyed the above analysis, we invite you to check out our other services. We focus on fundamental analysis in our monthly Market Overview reports and we provide daily Gold & Silver Trading Alerts with clear buy and sell signals. If you’re not ready to subscribe yet and are not on our mailing list yet, we urge you to join our gold newsletter today. It’s free and if you don’t like it, you can easily unsubscribe.
Thank you.
Paul Rejczak
Stock Trading Strategist
Stock Trading Alerts

-
I know Mike is a very solid investor and respect his opinions very much. So if he says pay attention to this or that - I will.
~ Dale G.
-
I've started managing my own investments so view Michael's site as a one-stop shop from which to get information and perspectives.
~ Dave E.
-
Michael offers easy reading, honest, common sense information that anyone can use in a practical manner.
~ der_al.
-
A sane voice in a scrambled investment world.
~ Ed R.
Inside Edge Pro Contributors

Greg Weldon

Josef Schachter

Tyler Bollhorn

Ryan Irvine

Paul Beattie

Martin Straith

Patrick Ceresna

Mark Leibovit

James Thorne

Victor Adair