Stocks & Equities

Plunge Protection Team Is No Myth, But Now Is Not It’s Time

Does-this-rally-look-like-it-needs

Zillionaire Asher Edelman was quoted on ZeroHedge the other day saying he has ‘no doubt’ that the Plunge Protection Team is behind the stock market’s steep rally since the election. With all due respect for Mr. Edelman and others who believe this, it is conspiracist poppycock. Yes, the Plunge Protection Team, which is officially known as the Working Group on Financial Markets, does exist, having been created under President Reagan. And I have no doubt that it will be pressed into action some day when the inevitable avalanche hits Wall Street. But the source of the stock market’s ongoing buoyancy at present is not the PPT, which has no reason to act unless there’s a crisis, but rather the unlimited sums of credit available at zero or near-zero interest rates to institutional investors and to companies that continuously buy back their own stock to artificially inflate earnings per share.

This dynamic is quite sufficient to keep stocks buoyant as long as the easy-money spigot remains open. Moreover, the bullish effect on stocks is powerfully augmented by short-covering, the most urgent source of buying — indeed, the only source of buying sufficiently powerful to push the broad averages through heavy layers of supply en route to new record highs.  With that kind of boost the stock market hardly needs the Plunge Protection Team to keep the bull market going. Ultimately, however, and as anyone familiar with the history of the stock market could tell you, when the forces of nature usher in a bear market, as is inevitable, the PPT will be powerless to affect it, let alone stop it. 

If you don’t subscribe but would like to join great traders from around the world in the chat room, click here for a free two-week trial subscription. You’ll also receive actionable trading ‘touts’ and invitations to frequent ‘impromptu’ sessions where Rick ‘takes requests’.


Today’s Market – The Waiting Game

Summary

Stocks were frozen in place in premarket trade.

The U.S. dollar was likewise little changed.

We are playing a waiting game today until the 2:00 PM release of the Fed meeting minutes.

The Federal Open Market Committee (FOMC) meeting minutes will be published at 2:00 PM EDT. If the minutes show a Fed worried about the outlook for inflation and/or talking about possibly raising the trajectory of monetary policy tightening, well then stocks should take a hit. I think this is more likely than not given what we know already, though we may not learn of it until we see the Fed’s updated economic projections in mid-June.

….continue reading HERE

also: 

48181402-14954793953869407Volatility is at generational lows, and a new crop of products has made it easy to sell.

Time To Buy Volatility?

Hedge Fund Managers Pour SALT on U.S. Stocks, Look to Europe

COMM-skybridge-capital-salt-conference-liz-claman-sam-zell-mark-mobius-05192017

Europe is back on the map. That was one of the main takeaways last week from the SkyBridge Alternatives (SALT) hedge fund conference in Las Vegas, where $3 trillion in assets was represented. Speaker after speaker touted European equities for their attractive valuations and as a means to diversify away from the volatile American market in light of rising U.S. geopolitical risk. France’s election of centrist Emmanuel Macron over far-right nationalist Marine Le Pen this month has especially eased investors’ fears that antiestablishment forces would challenge the integrity of the European Union (EU).

Economic growth is finally picking up in Europe—“solid and broad,” as European Central Bank (ECB) president Mario Draghi recently put it—and many countries’ purchasing managers’ indexes (PMIs) are at five- and six-year highs. Export orders and hiring have accelerated. Labor participation is improving. European commodity sectors, including energy and metals, look cheap and oversold, meaning it might be time to start accumulating.

Trading at around 17 times earnings, European companies are priced to move compared to American firms, which are trading at 22 times earnings.

European Stocks Have an Attractive Dividend Yield

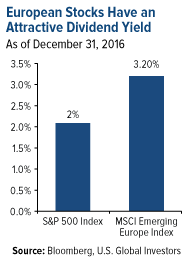
Dividend yields also look attractive relative to U.S. stocks. The MSCI Emerging Europe Index, which is most heavily weighted in Russian, Polish and Turkish stocks, currently yields 3.2 percent. The S&P 500 Index, by comparison, yields 2 percent.

A recent Barron’s article, “Europe on Sale: Time to Buy Foreign Stocks,” makes the same bullish case as many of the SALT presenters. Its author, Vito J. Racanelli, suggests that the eight-year bull run in the U.S. could be coming to an end, and that the baton is being passed to Europe. Overseas markets have already attracted more fund flows so far this year than the U.S. market, with a whopping $6.1 billion being plowed into European equity funds in the week ended May 10.

“Given attractive valuations, diminished political risk, low interest rates and a pickup in global growth, international markets, and Europe in particular, could finally start to outperform,” Racanelli writes.

Talking Geopolitics

Before moving on, I want to share a few other takeaways from SALT. One of the highlights was hearing billionaire investor Dan Loeb, who manages the $16 billion hedge fund firm Third Point. Loeb said that serious investors should closely monitor geopolitics as a backdrop or overlay when making investment decisions because government policy can have the fastest and most significant impact on your portfolio.

Daniel S. Loeb

That was flattering to hear. Not only do I spend a lot of time discussing and analyzing geopolitics, both here in the weekly commentary and my CEO blog Frank Talk,but it’s baked right into U.S. Global Investors’ methodology: Our investment process clearly asserts that “government policy is a precursor to change.” Loeb’s comments, I felt, validated our emphasis on geopolitics.

Many conferences I attend can often get bogged down in partisan politics, but SALT was refreshingly balanced. Joe Biden was as welcome on-stage as Jeb Bush. No one came out entirely in favor of or against President Donald Trump or his policies. Instead, presenters discussed the inherent risks and opportunities in an intelligent, even-handed manner. I aspire to do the same.

One of the speakers was John Brennan, the former CIA director, who’s scheduled to testify before the House Intelligence Committee later this month as part of its investigation into Russia’s alleged involvement with the 2016 election. Brennan, who told lawmakers as far back ago as August that the agency had information pointing to possible collusion between Russia and the Trump campaign, shed some much-needed light on allegations that Trump shared sensitive intelligence with Russian officials this month—a “serious mistake,” he said—explaining that such leaks to the media are potentially just as damaging to national security as the president’s actions.

Also notable was former Federal Reserve Chair Ben Bernanke’s thoughts on Washington’s little-known power dynamics. He said there are really three parties jockeying for control in the capital—Republicans, Democrats… and the “beltway party.” It’s this last group, composed of deeply entrenched lobbyists and career bureaucrats, that gives Washington outsiders such as Trump the hardest time and actively tries to sabotage agendas that shake up the status quo.

Trump's young presidency closely resembles Jimmy Carter's

In this regard, Bernanke said, the presidency Trump’s tenure so far resembles the most is not Richard Nixon’s, as some have suggested. It’s not even Andrew Jackson’s, which Trump himself expressly would like to emulate. Instead, it’s Jimmy Carter’s.

This might seem counterintuitive, but think about it: Both men were Washington outsiders. Both men arrived in the beltway with aspirations to transform the capital’s insular culture and “drain the swamp.” Both men had the great fortune of working with a party majority in both chambers of Congress. But because they exuded an “I alone” attitude and often picked fights with members of their own party, both men faced unusual difficulties in getting key components of their agendas passed. And just as Carter had little success in his first 100 days—in his entire four-year term, in fact—Trump’s young presidency has similarly been unable to make significant strides so far in getting much accomplished.

A White House in Crisis?

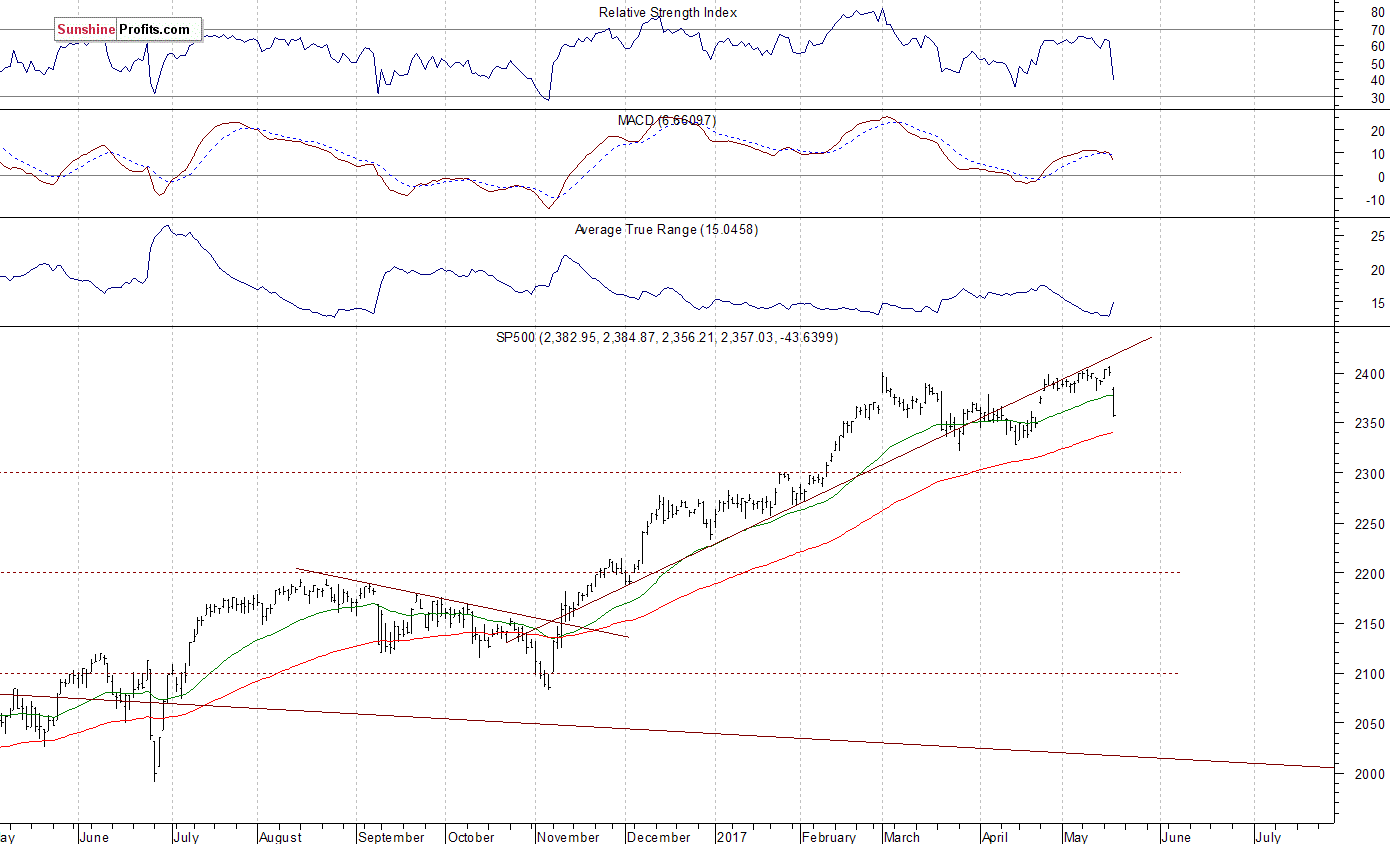
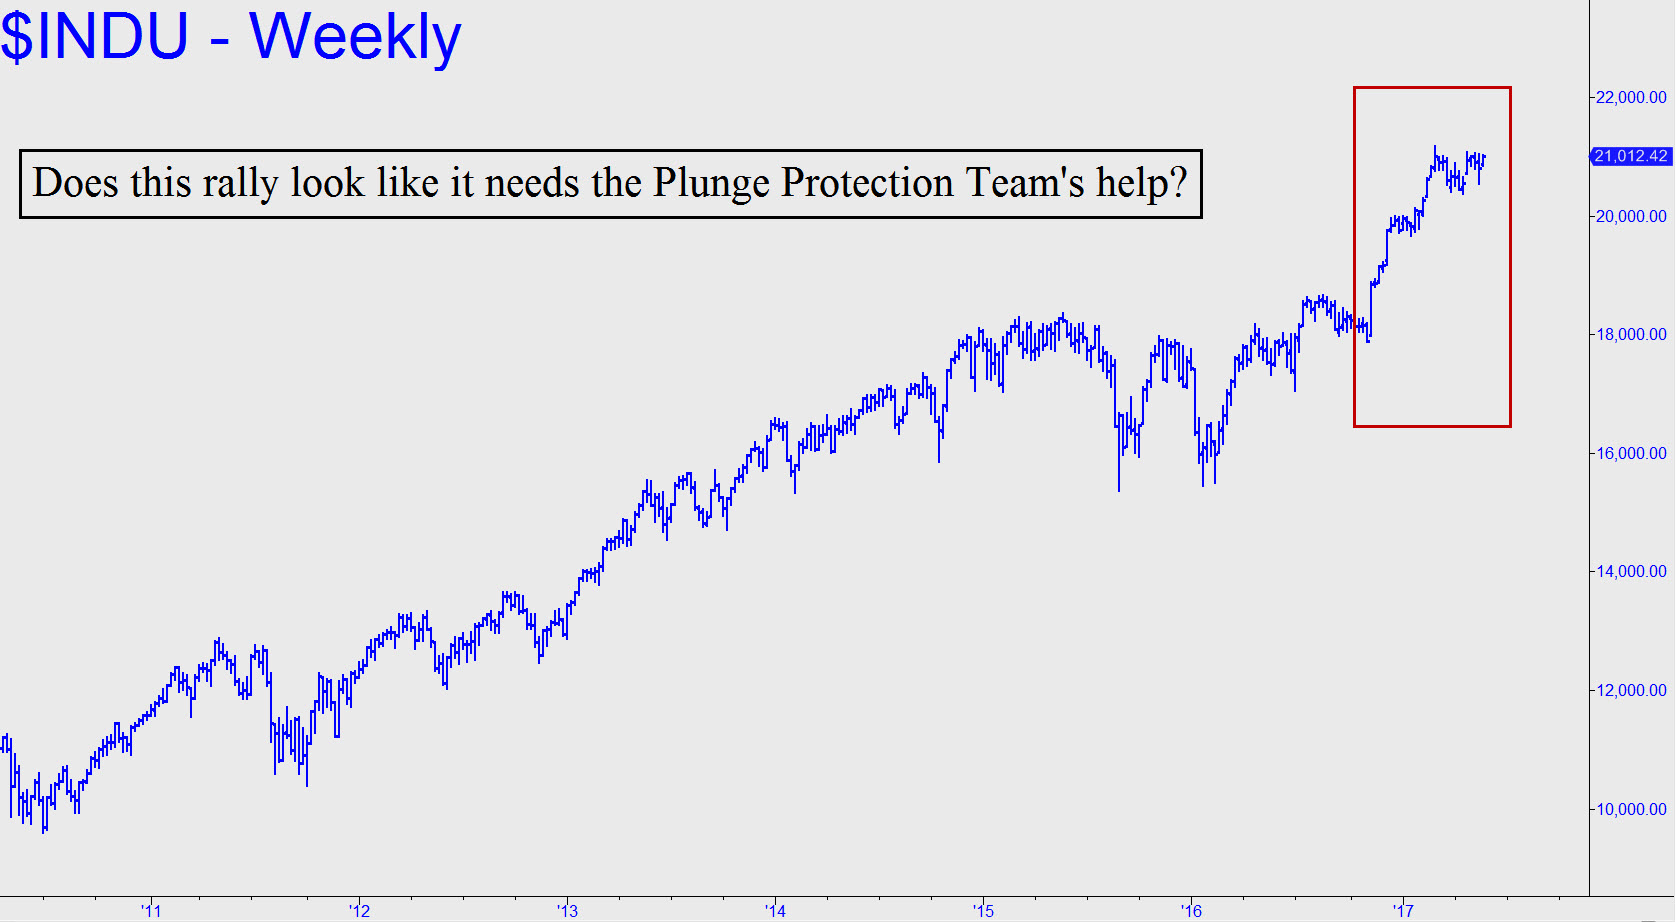
This is precisely what markets were reacting to last Wednesday, the worst week for major U.S. indices in months. Investors, fearing Trump’s pro-growth agenda could be threatened by troubling news and allegations coming out of the White House, punished small-cap stocks in particular, sending the Russell 2000 Index down 2.62 percent, its sharpest one-day loss since March. Recall that it was small caps that saw the strongest surge following the election, as investors bet on domestic growth stemming from the then-president-elect’s “American first” proposals.
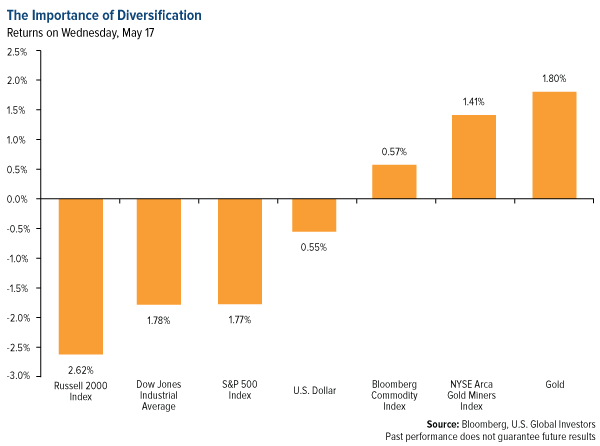
the importance of diversification
click to enlarge

Now, however, some are wondering if Trump, embroiled in numerous scandals, will finish out his term. A few SALT presenters even uttered the “i” word. Jim Chanos, founder and investment manager of Kynikos Associates in New York, told the packed auditorium that he believes the market hopes Vice President Mike Pence will become president. Investors are seeking deregulation and tax cuts, plain and simple, Chanos said, and the “more stable” Pence is seen as having a better shot at delivering. This squares with reports from British gambling and betting company Ladbrokes, which announced last week that Trump is now odds-on, or highly likely, to face impeachment by the end of his first term, with bookies having to cut the price from 11/10 to 4/5.   

Banks, which stand to benefit from Trump’s plan to loosen financial regulations, were Wednesday’s biggest losers. JPMorgan was down 3.81 percent, or $3.34 a share. Goldman Sachs fell 5.27 percent, or $11.88 a share.

Apple finished the day down 3.36 percent, wiping away some $20 billion in market value. The smartphone giant, which recently became the first company ever to be worth more than $800 billion, could also benefit from Treasury Secretary Steven Mnuchin’s efforts to make it easier for multinationals to repatriate cash that’s held overseas. And if that describes any company today, it would be Apple: The iPhone-maker holds nearly $250 billion in cash and securities in offshore accounts.  

Dollar Weakness Gives a Boost to Gold

More so than equities, the U.S. dollar is highly sensitive to geopolitical drama. Last week, the greenback tumbled to its lowest level since the November election compared to other major currencies.
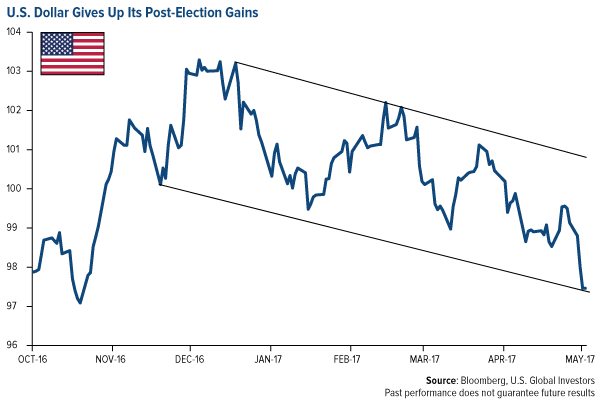
U.S. Dollar Gives up its post-election gains
click to enlarge

This helped gold, miners and commodities end the week in positive territory. Gold gained 2 percent, gold miners 0.57 percent and commodities 1.36 percent. The S&P 500, meanwhile, finished the week down 0.8 percent.

For diversification benefits, I always recommend around a 10 percent weighting in gold and gold stocks, and last week proved yet again that this strategy could help mitigate the losses in risk assets.

Unsure what else drives the price of gold? Find out!

Some links above may be directed to third-party websites. U.S. Global Investors does not endorse all information supplied by these websites and is not responsible for their content. All opinions expressed and data provided are subject to change without notice. Some of these opinions may not be appropriate to every investor. Holdings may change daily.

The MSCI Emerging Markets Europe Index captures large and mid-cap representation across 6 Emerging Markets (EM) countries in Europe. With 83 constituents, the index covers approximately 85% of the free float-adjusted market capitalization in each country. The Dow Jones Industrial Average is a price-weighted average of 30 blue chip stocks that are generally leaders in their industry.

The S&P 500 Stock Index is a widely recognized capitalization-weighted index of 500 common stock prices in U.S. companies. The Russell 2000 Index is a U.S. equity index measuring the performance of the 2,000 smallest companies in the Russell 3000, a widely recognized small-cap index. The NYSE Arca Gold Miners Index is a modified market capitalization weighted index comprised of publicly traded companies involved primarily in the mining for gold and silver. The Bloomberg Commodity Index is made up of 22 exchange-traded futures on physical commodities. The index represents 20 commodities, which are weighted to account for economic significance and market liquidity.

Dividend yield is a financial ratio that indicates how much a company pays out in dividends each year relative to its share price. There is no guarantee that the issuers of any securities will declare dividends in the future or that, if declared, will remain at current levels or increase over time.

The Purchasing Manager’s Index is an indicator of the economic health of the manufacturing sector. The PMI index is based on five major indicators: new orders, inventory levels, production, supplier deliveries and the employment environment.

Holdings may change daily. Holdings are reported as of the most recent quarter-end. None of the securities mentioned in the article were held by any accounts managed by U.S. Global Investors as of 3/31/2017.
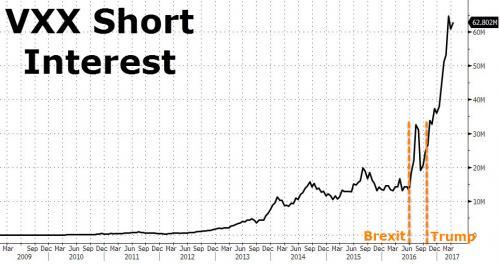
Stock Life Cycles and Maximizing Profits

Technical analyst Clive Maund describes the life cycle of stocks, and pinpoints the stage in the cycle that is optimal for investment. 

maundcover5-22

Stocks are like living things. They are born, grow, mature, age and decline and then die, or are reborn, which reflects the fact that the companies on which they are based do likewise. 

This should not be so surprising since companies are comprised of people. Whole industries come and go as a result of the evolution of technology and changing fashions. A simple example of this is provided by the music industry, where first you had vinyl, then cassettes, then CDs and now the industry is moving to downloads, with vinyl making a niche comeback. If you as a company had insisted on continuing to produce music on vinyl or on cassettes, you would have gone the way of the Dodo bird


The only instances where companies and stocks do not go through the entire cycle to the death phase are unique cases where the company comes out with a very distinct product that has staying power, like Coca Cola and McDonalds, and even these can’t go on forever. Even Apple’s grandiose donut HQ near San Francisco will probably end up a tumbleweed-strewn ghost town, but don’t tell management that—they have to find something to do with their current massive windfall profits.

The normal stock life cycle plays out over a matter of some years although it can vary wildly with individual stocks depending on the industry the company is in. A chart showing a simplified stock life cycle is shown above.

A company is born into Stage 1, the basing phase, which can be likened to a young tree in a forest, which has to contend with hazards like rabbits and falling branches and needs enough light to make it through the canopy above. At this stage many young companies fall by the wayside, due to insufficient funds and/or being crowded out by the competition or other reasons. During this stage the company must “get its act together,” and if it succeeds in establishing itself in the marketplace and securing a revenue stream from sales, it makes it to Stage 2, the growth phase, the equivalent of the young tree making it to the canopy above and finding its place in the sun, and growing and developing. 

This is the stage at which a company’s products may become very popular and sales may expand a lot generating big profits. Eventually, however, growth reaches its limit: “No tree grows to the sky.” With Parkinson’s Laws dictating rising bureaucracy and costs with management typically feasting on the profits, growth slows as the company matures and ends up treading water until it succumbs to the growing inroads made by leaner and meaner competition, or to a decline in popularity of its products, or both. This is Stage 3, the top phase. 

Once the company loses its edge and sales and profits decline, it enters Stage 4, the declining phase. This often ends in a crisis where either the company goes broke or it reinvents itself, in another Stage 1 basing phase from which it may succeed in emerging into a new Stage 2 growth phase.

There are innumerable examples of this stock life cycle playing out in the markets all the time. Sometimes you have entire sectors caught up in it, like precious metals stocks, which enjoyed a Stage 2 boom in the 2000s before a Stage 3 top out in 2011 that led to a vicious Stage 4 bear market, which wiped out a lot of believers. A dramatic example was the tech bubble leading into 2000. Cannabis stocks are believed to be completing a heavy correction within an ongoing Stage 2 bull market. We have a range of more obvious Stage 2 stocks on the site, like Scientific Metals Corp. (STM:TSX.V)Select Sands Corp. (SNS:TSX.V) and UGE International Ltd. (UGE:TSX.V; UGEIF:OTC).

With an awareness of this stock life cycle, our goal is to find those stocks that are in Stage 2 uptrends and ride them for all they are worth. Sometimes we can finesse it, as we have done successfully with Scientific Metals, and keep dodging the corrections to maximize profits. 

The Stage 3 top area is a tricky place to make profits, although aggressive traders may successfully play the swings, if they are big enough. Stage 4 is a no-go area, unless you are out to make money on the short side. Stage 1, the basing phase, is associated with “Smart Money,” which gets in cheap and ahead of the crowd in Stage 2, although even here you have to be careful—the basing phase can last years and you can end up feeling like a lemon if you buy too early and get stuck with something that does nothing for a long time, as happened to us with some of our recent picks that we bought too early. A stock may be fundamentally very cheap, at say 20 cents, in the Stage 1 basing phase, but because it is very cheap it can easily drop to 10 cents, in which case you are nursing a 50% loss, regardless of whether it goes on to break out into Stage 2 and advance to $2.00 or whatever. 

Here we should note that some stocks never make it from Stage 1 to Stage 2—they wither and die like a young tree in the forest starved of sunlight. It is tempting to try to anticipate the breakout into Stage 2, however, because a breakout from a low level can quickly lead to 100% or 200% gains in short order just on the breakout move. We achieved this with UGE International, which we bought last December, aided by clues provided by the volume pattern. The correct interpretation of the volume pattern is the most effective way to call these breakouts ahead of time.

This is where we should focus our attention. . .

maundstage2image

A key point to make is that the simplified life cycle chart shown above makes it look very easy to pinpoint where stocks are in their life cycle. In practice it is not so easy—don’t forget there are armies of brokers, investors and computer bots that are trying to do just that, which is why most stock charts are not so clear. Anyone who has experience of the markets knows that seemingly insane gyrations are not an infrequent occurrence, so we cannot expect to be right all the time in our interpretations, and only a fool would expect that. What matters is to be right most of the time, and to limit loss when wrong.

To recap, our goal is to isolate those stocks that are in Stage 2 uptrends and ride them for all they are worth. We also try to anticipate breakouts from Stage 1 basing patterns into Stage 2 uptrends, because of the increased leverage that affords. While this can be tricky, the success rate can be improved considerably by the correct interpretation of the volume pattern. As pragmatic traders we couldn’t give two hoots what sector they are in, because we don’t fall in love with sectors like precious metals or tech or whatever. If you want to fall in love, do it with a man or woman, or a pet dog, or even a tree, not some company’s stock.

The stock market is a game, and the best way to win it is to find stocks that are definitely in Stage 2 uptrends, and then ride them until they top out in Stage 3, then switch to others. It is an entertaining quest to find such stocks, and I will appreciate the reduction in my workload that will result in youfinding some of these stocks and then alerting me to them. Write to me at clivemaund@gmail.com with any you think you have spotted and I will give you my opinion.

Clive Maund has been president of www.clivemaund.com, a successful resource sector website, since its inception in 2003. He has 30 years’ experience in technical analysis and has worked for banks, commodity brokers and stockbrokers in the City of London. He holds a Diploma in Technical Analysis from the UK Society of Technical Analysts.

Want to read more Gold Report articles like this? Sign up for our free e-newsletter, and you’ll learn when new articles have been published. To see a list of recent articles and interviews with industry analysts and commentators, visit our Streetwise Interviews page.

Related Articles


Disclosure: 
1) Clive Maund: I, or members of my immediate household or family, own shares of the following companies mentioned in this article: None. I personally am, or members of my immediate household or family are, paid by the following companies mentioned in this article: None. My company has a financial relationship with the following companies mentioned in this article: None. I determined which companies would be included in this article based on my research and understanding of the sector. 
2) The following companies mentioned in this article are sponsors of Streetwise Reports: None. Streetwise Reports does not accept stock in exchange for its services. Click here for important disclosures about sponsor fees. The information provided above is for informational purposes only and is not a recommendation to buy or sell any security. 
3) Statements and opinions expressed are the opinions of the author and not of Streetwise Reports or its officers. The author is wholly responsible for the validity of the statements. The author was not paid by Streetwise Reports for this article. Streetwise Reports was not paid by the author to publish or syndicate this article. 
4) This article does not constitute investment advice. Each reader is encouraged to consult with his or her individual financial professional and any action a reader takes as a result of information presented here is his or her own responsibility. By opening this page, each reader accepts and agrees to Streetwise Reports’ terms of use and full legal disclaimer. This article is not a solicitation for investment. Streetwise Reports does not render general or specific investment advice and the information on Streetwise Reports should not be considered a recommendation to buy or sell any security. Streetwise Reports does not endorse or recommend the business, products, services or securities of any company mentioned on Streetwise Reports. 
5) From time to time, Streetwise Reports LLC and its directors, officers, employees or members of their families, as well as persons interviewed for articles and interviews on the site, may have a long or short position in securities mentioned. Directors, officers, employees or members of their immediate families are prohibited from making purchases and/or sales of those securities in the open market or otherwise from the time of the interview or the decision to write an article, until one week after the publication of the interview or article. As of the date of this article, officers and/or employees of Streetwise Reports LLC (including members of their household) own shares of Scientific Metals, Select Sands and UGE International, companies mentioned in this article.


Why A Short Position In The SP500 Index Is Justified

Stock Trading Alert originally sent to subscribers on May 18, 2017, 6:55 AM.

Briefly: In our opinion, speculative short positions are favored (with stop-loss at 2,410, and profit target at 2,200, S&P 500 index).

Our intraday outlook is bearish, and our short-term outlook is bearish. Our medium-term outlook remains neutral, following S&P 500 index breakout above last year’s all-time high:

Intraday outlook (next 24 hours): bearish
Short-term outlook (next 1-2 weeks): bearish
Medium-term outlook (next 1-3 months): neutral
Long-term outlook (next year): neutral

The U.S. stock market indexes lost 1.8-2.6% on Wednesday, breaking below their recent short-term consolidation, as investors reacted to U.S. politics news, among others. The S&P 500 index has reached new record high of 2,405.77 on Tuesday. However, it failed to continue the uptrend and sold off yesterday, following a gap down opening of the trading session. The Dow Jones Industrial Average got closer to level of 20,600 again, and the technology Nasdaq Composite index fell the most (-2.6%), as it got closer to 6,000 mark. The nearest important level of support of the S&P 500 index is now at 2,350-2.355, marked by late April daily gap up, among others. The next level of support is at 2,320-2,330, marked by previous local lows. On the other hand, resistance level is now at around 2,370, marked by previous level of support. The next resistance level is at 2,385-2,395, marked by yesterday’s daily gap down of 2,384.87-2,396.05. The resistance level is also at 2,400-2,405, marked by the above-mentioned new record high. Is this a topping pattern before medium-term downward reversal? The uptrend accelerated on March 1 and it looked like a blow-off top pattern accompanied by some buying frenzy. The S&P 500 index trades below its medium-term upward trend line, as we can see on the daily chart:

1

Expectations before the opening of today’s trading session are negative, with index futures currently down 0.3-0.5%, as investors’ sentiment remains bearish after yesterday’s move down. The European stock market indexes have lost 0.9-1.4% so far. Investors will now wait for some economic data announcements: Initial Claims, Philadelphia Fed number at 8:30 a.m., Leading Indicators at 10:00 a.m. The market expects that the Philadelphia Fed number was at 18.5 in May, and the Initial Claims were at 240,000 last week. The S&P 500 futures contract trades within an intraday downtrend, as it extends its yesterday’s sell-off. The nearest important level of resistance is at around 2,360-2,370, marked by an overnight consolidation. The next level of resistance is at 2,380-2,385, marked by short-term local highs. On the other hand, support level is at around 2,340, and the next support level is at 2,300-2,320, marked by some previous fluctuations. There have been no confirmed positive signals so far. But will the market continue its short-term downtrend? Or is this just a move down within an over two-month-long consolidation along new record highs?

S&P 500 futures contract - S&P 500 index chart - SPX

The technology Nasdaq 100 futures contract was relatively weaker than the broad stock market yesterday, as it retraced its few-week-long rally to new record highs above the level fo 5,700. It is now trading well below the level of 5,600. The nearest important level of support is at around 5,550, marked by an intraday local low. On the other hand, resistance level is at 5,600, and the next level of resistance is at 5,630-5,650, among others, as the 15-minute chart shows:

Nasdaq100 futures contract - Nasdaq 100 index chart - NDX

Concluding, the S&P 500 index broke below its short-term consolidation on Wednesday, as it got closer to the level of 2,350, following Tuesday’s move to new record high above 2,400 mark. Is this a new downtrend or just downward correction within an almost three-month-long consolidation? There have been no confirmed positive signals so far. For now, it looks like a new downtrend and the market may retrace more of its over year-long uptrend. We still can see medium-term negative technical divergences. Therefore, we continue to maintain our speculative short position (opened on February 15 at 2,335.58 – opening price of the S&P 500 index). Stop-loss level is at 2,410 and potential profit target is at 2,200 (S&P 500 index). You can trade S&P 500 index using futures contracts (S&P 500 futures contract – SP, E-mini S&P 500 futures contract – ES) or an ETF like the SPDR S&P 500 ETF – SPY. It is always important to set some exit price level in case some events cause the price to move in the unlikely direction. Having safety measures in place helps limit potential losses while letting the gains grow.

To summarize: short position in S&P 500 index is justified from the risk/reward perspective with the following entry prices, stop-loss orders and profit target price levels:

S&P 500 index – short position: profit target level: 2,200; stop-loss level: 2,410
S&P 500 futures contract (June) – short position: profit target level: 2,197; stop-loss level: 2,407
SPY ETF (SPDR S&P 500, not leveraged) – short position: profit target level: $220; stop-loss level: $241
SDS ETF (ProShares UltraShort S&P500, leveraged: -2x) – long position: profit target level: $15.47; stop-loss level: $12.98

Thank you.

Paul Rejczak
Stock Trading Strategist
Stock Trading Alerts