
Stocks & Equities
 The use of this principle is valuable, but not completely determinative in science. It often has an important application in investing.
Let us consider two hypotheses.
- A method of valuing markets that relies upon backward-looking data, looks at replacement value, or depends upon some other fixed ratio. Put another way, all the most popular valuation metrics.
- A method that considers prospective earnings, expected inflation, and interest rates.
Method one has been wrong for many years. In fact, it has been mostly incorrect for decades. Method two has been on the right side of market moves, but still shows significant deviations. What can we learn from Occam’s Razor?
Method One
Since this method has been mostly wrong, many explanations have been offered. I think I left a few out, but you get the drift.
- Speculation
- Not recognizing “fundamental” risks – Euro collapse, China collapse, recession, Brexit, etc.
- Depending upon dubious earnings estimates
- Market is about to crash
- Method not good for market timing, but returns will be poor for the next 5, 7, 10, 12, ? years
- Fed intervention – money printing and pumping up the market via QE
- Plunge protection team
- European Central Banks
- Suckers’ Rally
- Myopia of the investment world – no efficient markets
- High Frequency Traders and Algorithms
Method Two
Since this method has been mostly right, little explanation is needed. The expected increase in market prices and multiples is consistent with the theory. It should continue for another 8-10% and further if forward earnings increase.
Question
Should investors accept the complex and ever-changing explanations for method one? Or perhaps should they consider that the method itself is flawed?
….also from Dash of Insight:

 Having extensively previewed the various known and unknown aspects of Trump’s tax plan yesterday, set to be announced shortly, the reality – at least according to Bloomberg’s Mark Cudmore – is that no matter what Trump says today, it will almost certainly lead to more stock buying, leading to yet another “Trump Bump.” Which is ironic for one main reason: “Trump’s tax plan is expected to promise great things, but it’ll mean little without approval from Congress. So the consensus is that it’s unlikely to impact too much either way beyond some short-term volatility.” Furthermore, and counterintuitively, it would be a “positive surprise if the plan isn’t overly ambitious and doesn’t promise too much. That would make fiscal stimulus suddenly seem more achievable and realistic.”
However, Cudmore says that is an unlikely outcome: “One of the few inarguable facets of Trump is he knows how to get attention and viewers. Trump’s tax proposal is likely to be dramatic with some bold statements.”
also from ZeroHedge: French Establishment Mount The Ramparts Against Le Pen

“India has done very well in 2017 and is grossly outperforming the US. Even if India grows at only 5%, it is still better than the US, Europe”. Citing a PwC report he said, India would be the second largest economy by 2050. “Outlook for the Chinese, Indian economy for emerging markets, in general, is far superior to the outlook in our rotten western democracies,”
…related:
Marc Faber Expert Opinion Relating to Markets, Gold and Economy

Sent to subscribers on April 24, 2017, 6:57 AM.
Briefly: In our opinion, speculative short positions are favored (with stop-loss at 2,410, and profit target at 2,200, S&P 500 index).
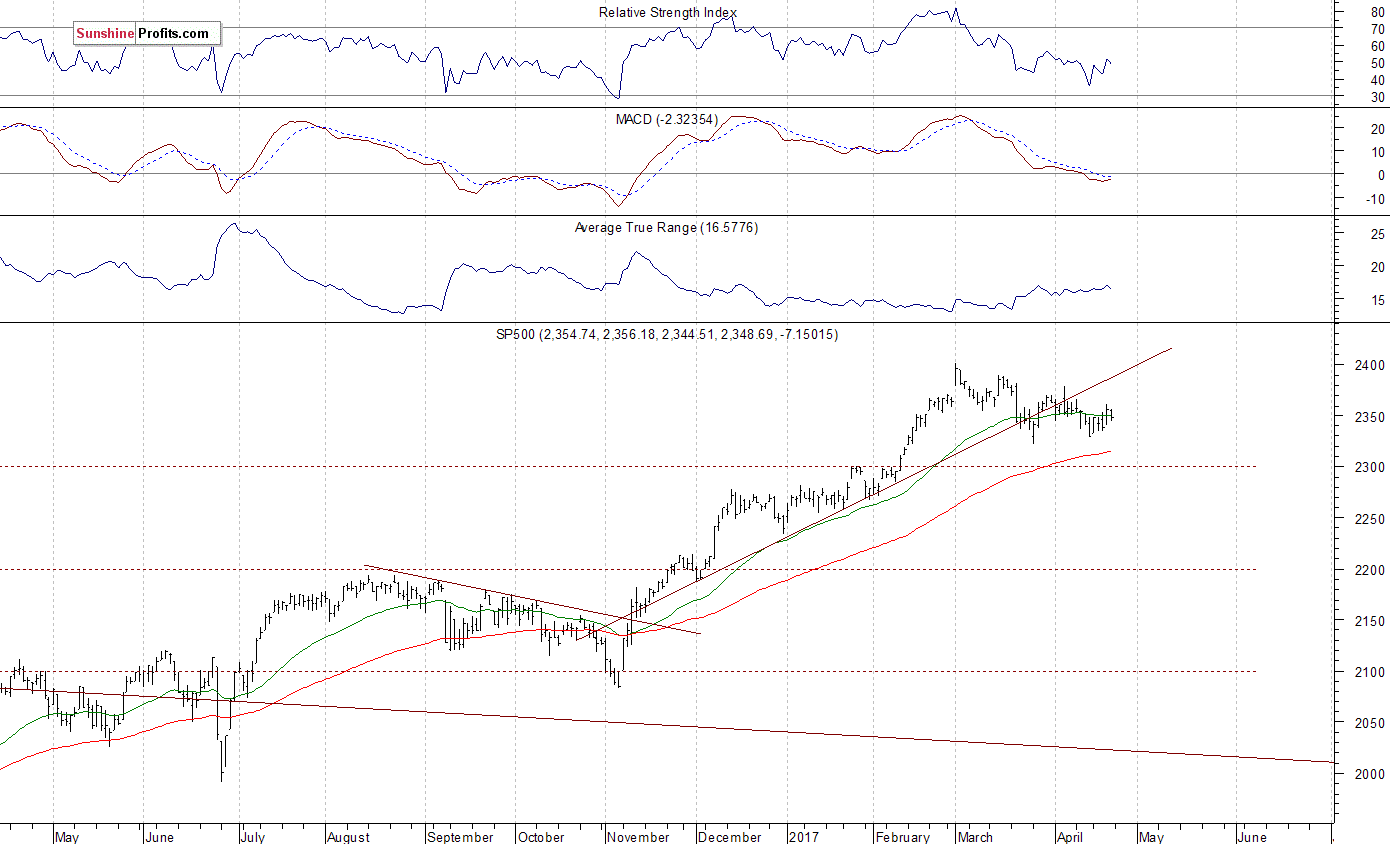
Our intraday outlook is bearish, and our short-term outlook is bearish. Our medium-term outlook remains neutral, following S&P 500 index breakout above last year’s all-time high:
Intraday outlook (next 24 hours): bearish
Short-term outlook (next 1-2 weeks): bearish
Medium-term outlook (next 1-3 months): neutral
Long-term outlook (next year): neutral
The main U.S. stock market indexes were mixed between -0.3% and 0.0% on Friday, extending their short-term consolidation, as investors awaited quarterly corporate earnings, economic data releases, French presidential election outcome, among others. The S&P 500 index remained within its week-long consolidation along the level of 2,350, around 2% below the March 1 all-time high of 2,400.98. The Dow Jones Industrial Average closed below the level of 20,600 again, and relatively stronger technology Nasdaq Composite index remained above 5,900 mark, as it continued to trade close to its early April record high. The nearest important level of support of the S&P 500 index is now at around 2,350, marked by previous resistance level. The next support level is at 2,320-2,330, marked by previous short-term consolidation. The support level is also at around 2,270-2,280. On the other hand, the nearest important level of resistance is at 2,365-2,370, marked by some previous local highs. The next resistance level is at 2,380-2,400, marked by record high, among others. We can see some short-term volatility following five-month-long rally off last year’s November low at around 2,100. Is this a topping pattern before medium-term downward reversal? The uptrend accelerated on March 1 and it looked like a blow-off top pattern accompanied by some buying frenzy. The S&P 500 index is trading below its medium-term upward trend line, as we can see on the daily chart:
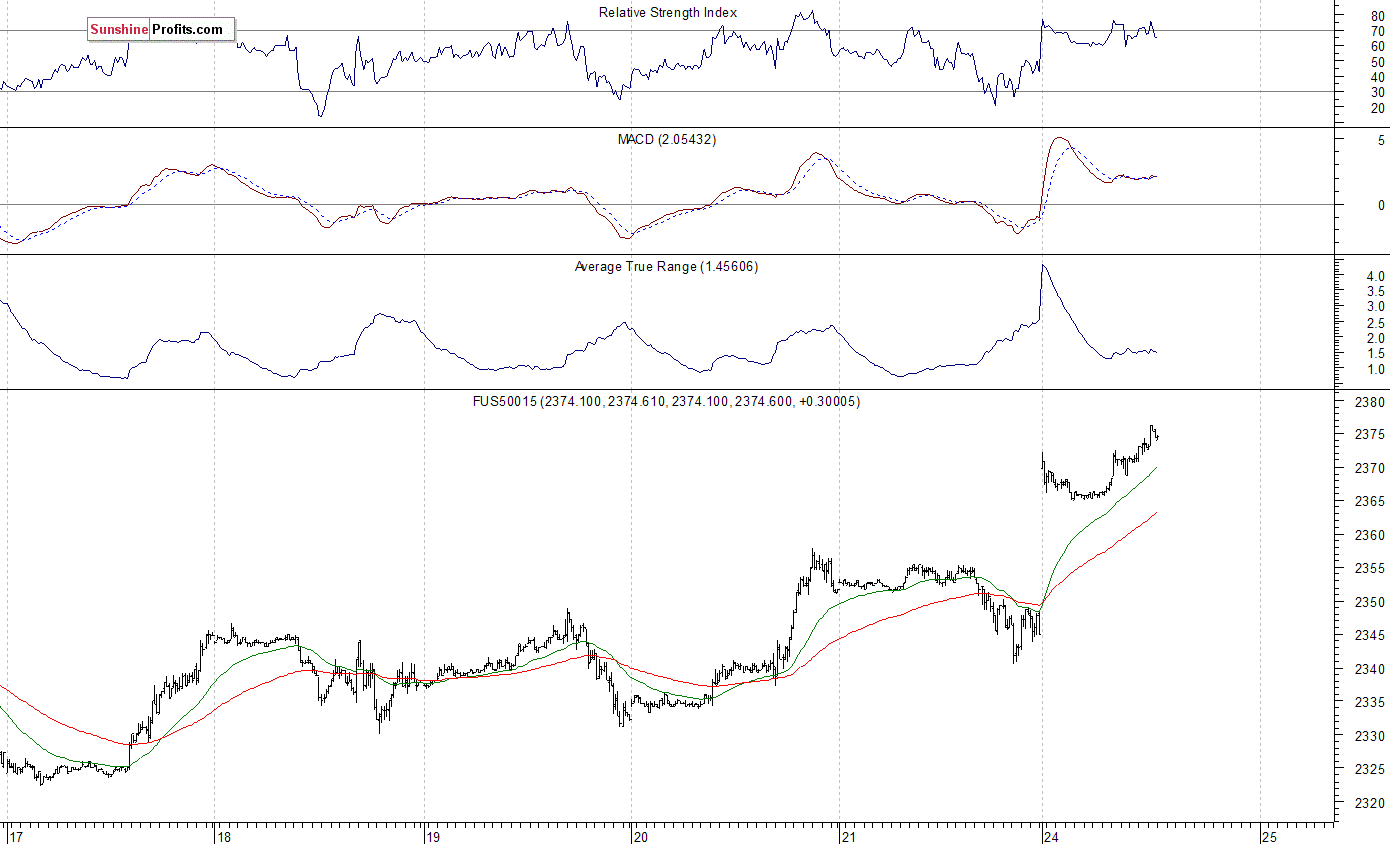
Expectations before the opening of today’s trading session are very positive, with index futures currently up 1.0-1.2%. The European stock markets have gained 1.8-4.5% so far. Investors will now wait for more quarterly corporate earnings releases. The S&P 500 futures contract trades within an intraday uptrend following an overnight gap-up opening. The nearest important level of support is at around 2,365, marked by local low. The next support level is at 2,350-2,355, marked by recent consolidation. On the other hand, the nearest important level of resistance is at around 2,375, marked by recent local high. The next resistance level remains at 2,380-2,400, marked by March topping consolidation, and an all-time high slightly above 2,400 mark. Will the market break above almost two-month long consolidation? Or is this just another upward correction? We can see some medium-term negative technical divergences, but will they lead to a downward correction?
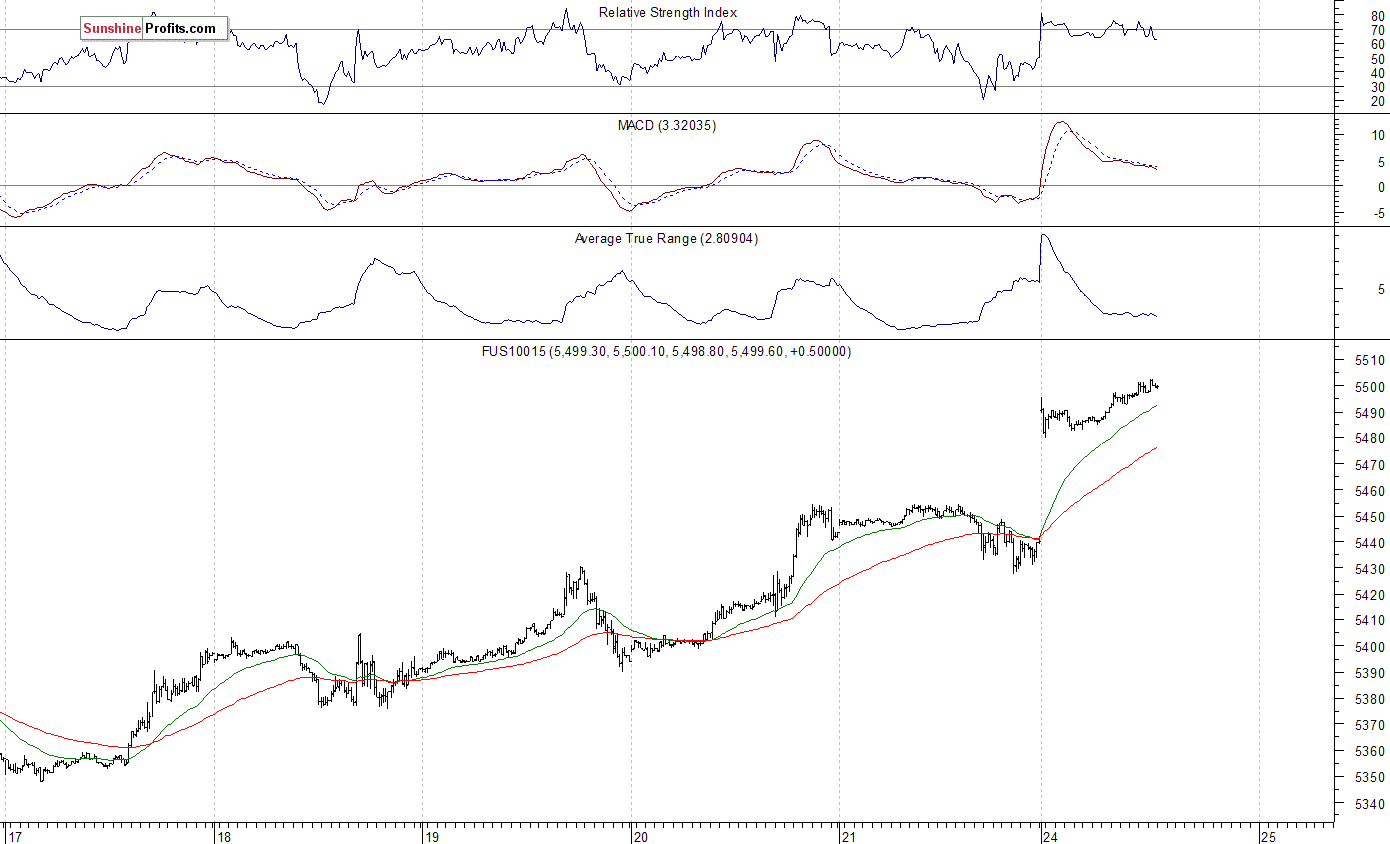
The technology Nasdaq 100 futures contract remains relatively stronger than the broad stock market, as it currently trades at new record high, along the level of 5,500. The nearest important support level is at around 5,480, marked previous level of resistance and intraday local lows. The next level of support remains at 5,450, marked by short-term consolidation. There have been no confirmed negative signals so far. However, we can see some short-term overbought conditions:
Concluding, the S&P 500 index extended its short-term consolidation on Friday, as investors awaited French presidential election outcome, among others. Expectations before the opening of today’s trading session are very bullish. The broad stock market index may get close to its early March record high. Will it break higher? Or is this just an upward move within almost two-month-long consolidation? The index is currently trading below five-month-long medium-term upward trend line. There have been no confirmed negative signals so far. However, we still can see medium-term negative technical divergences. Therefore, we continue to maintain our speculative short position (opened on February 15 at 2,335.58 – opening price of the S&P 500 index). Stop-loss level is at 2,410 and potential profit target is at 2,200 (S&P 500 index). You can trade S&P 500 index using futures contracts (S&P 500 futures contract – SP, E-mini S&P 500 futures contract – ES) or an ETF like the SPDR S&P 500 ETF – SPY. It is always important to set some exit price level in case some events cause the price to move in the unlikely direction. Having safety measures in place helps limit potential losses while letting the gains grow.
To summarize: short position in S&P 500 index is justified from the risk/reward perspective with the following entry prices, stop-loss orders and profit target price levels:
S&P 500 index – short position: profit target level: 2,200; stop-loss level: 2,410
S&P 500 futures contract (June) – short position: profit target level: 2,197; stop-loss level: 2,407
SPY ETF (SPDR S&P 500, not leveraged) – short position: profit target level: $220; stop-loss level: $241
SDS ETF (ProShares UltraShort S&P500, leveraged: -2x) – long position: profit target level: $15.47; stop-loss level: $12.98
Thank you.
Paul Rejczak
Stock Trading Strategist
Stock Trading Alerts
When a resistance zone gets tested multiple times it usually breaks. It shouldn’t be long before the Nasdaq breaks through this resistance. After it does it will pull the rest of the market up with it.

https://blog.smartmoneytrackerpremium.com/
…related:
What Just Took Place In Stocks Has Rarely Happened In The Past 117 Years

-
I know Mike is a very solid investor and respect his opinions very much. So if he says pay attention to this or that - I will.
~ Dale G.
-
I've started managing my own investments so view Michael's site as a one-stop shop from which to get information and perspectives.
~ Dave E.
-
Michael offers easy reading, honest, common sense information that anyone can use in a practical manner.
~ der_al.
-
A sane voice in a scrambled investment world.
~ Ed R.
Inside Edge Pro Contributors

Greg Weldon

Josef Schachter

Tyler Bollhorn

Ryan Irvine

Paul Beattie

Martin Straith

Patrick Ceresna

Mark Leibovit

James Thorne

Victor Adair