
Stocks & Equities
Stock Trading Alert originally sent to subscribers on April 17, 2017, 6:56 AM.
Briefly: In our opinion, speculative short positions are favored (with stop-loss at 2,410, and profit target at 2,200, S&P 500 index).
Our intraday outlook is bearish, and our short-term outlook is bearish. Our medium-term outlook remains neutral, following S&P 500 index breakout above last year’s all-time high:
Intraday outlook (next 24 hours): bearish
Short-term outlook (next 1-2 weeks): bearish
Medium-term outlook (next 1-3 months): neutral
Long-term outlook (next year): neutral
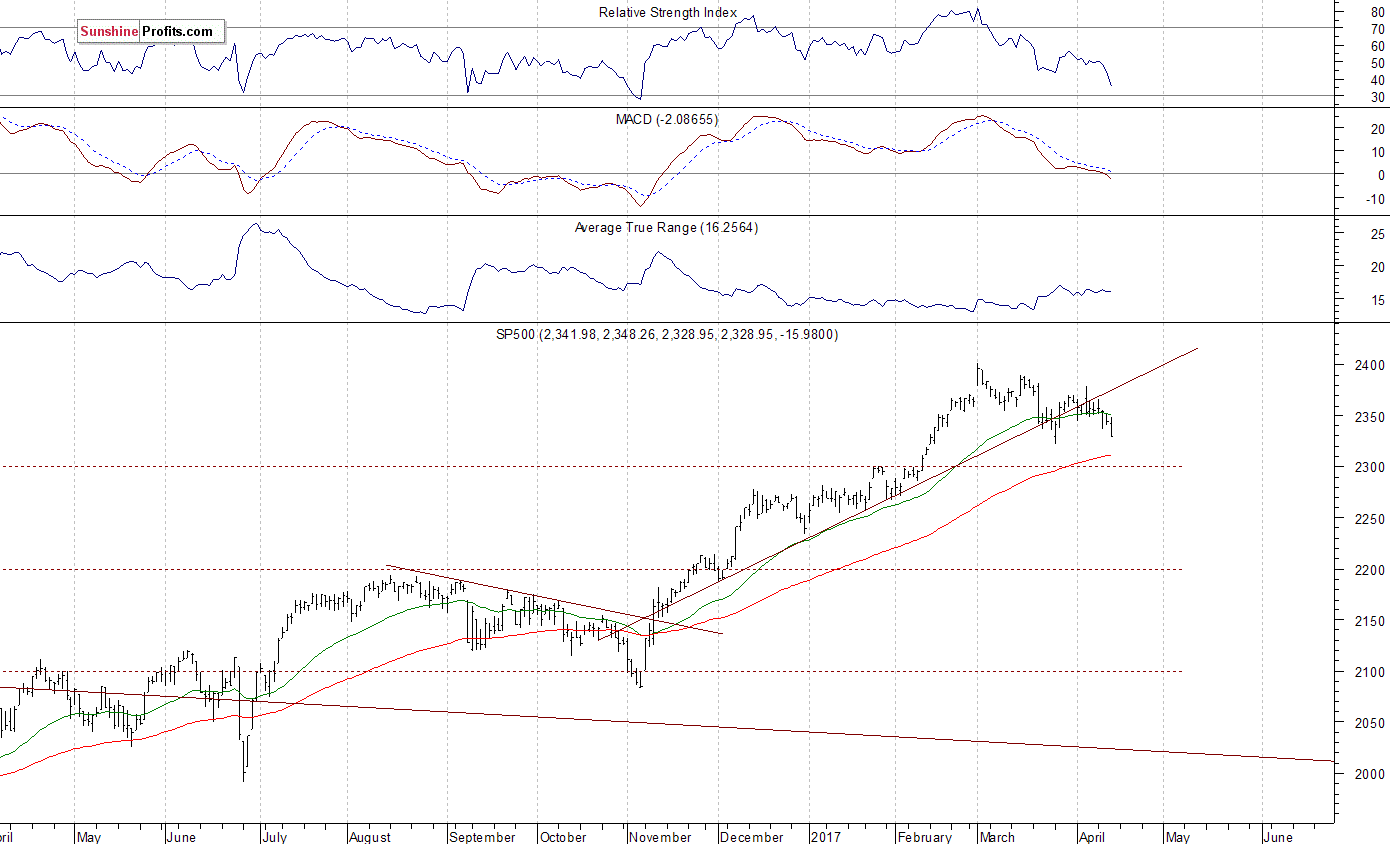
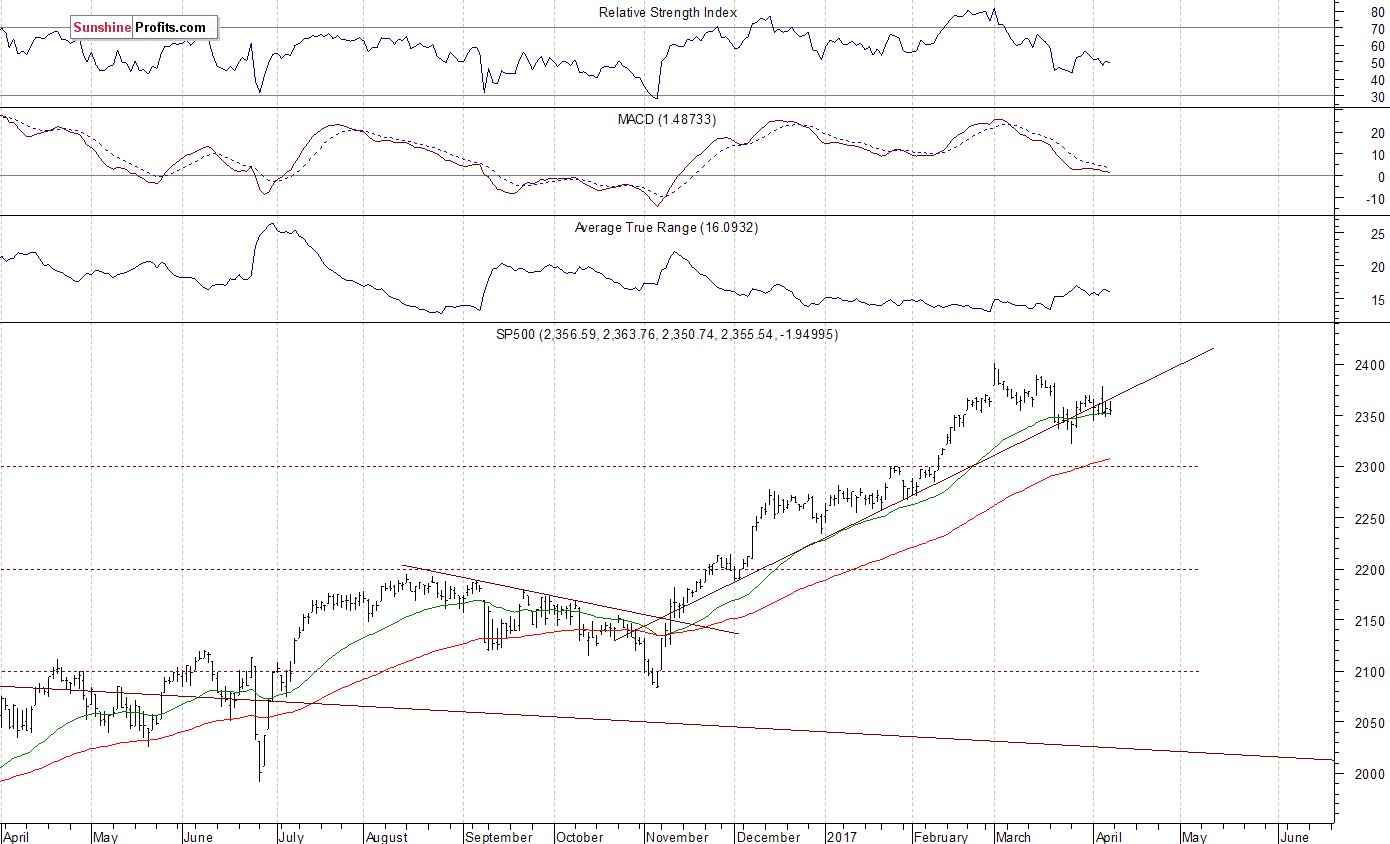
The U.S. stock market indexes lost between 0.4% and 0.7% on Friday, extending their short-term downtrend, as investors reacted to economic data releases, global politics news. The S&P 500 index got close to its late March local low above 2,320 mark. It is now around 3% below its March 1 all-time high of 2,400.98. Is this a new downtrend or just relatively shallow downward correction before another medium-term leg up? The Dow Jones Industrial Average closed below the level of 20,500, and the relatively stronger technology Nasdaq Composite index closed at around 5,800 mark, following its last April 17 move to new record high. The nearest important level of support of the S&P 500 index is at around 2,300-2,320, marked by previous short-term consolidation, among others. The next support level is at 2,270-2,280. The support level is also at around 2,250. On the other hand, the nearest important level of resistance is now at 2,350, marked by some recent local highs. The next resistance level is at 2,370-2,380, marked by the early April local highs. The resistance level is at also at around 2,400, marked by record high. We can see some short-term volatility following five-month-long rally off last year’s November low at around 2,100. Is this a topping pattern before medium-term downward reversal? The uptrend accelerated on March 1 and it looked like a blow-off top pattern accompanied by some buying frenzy. The S&P 500 index is currently trading below its medium-term upward trend line, as we can see on the daily chart:
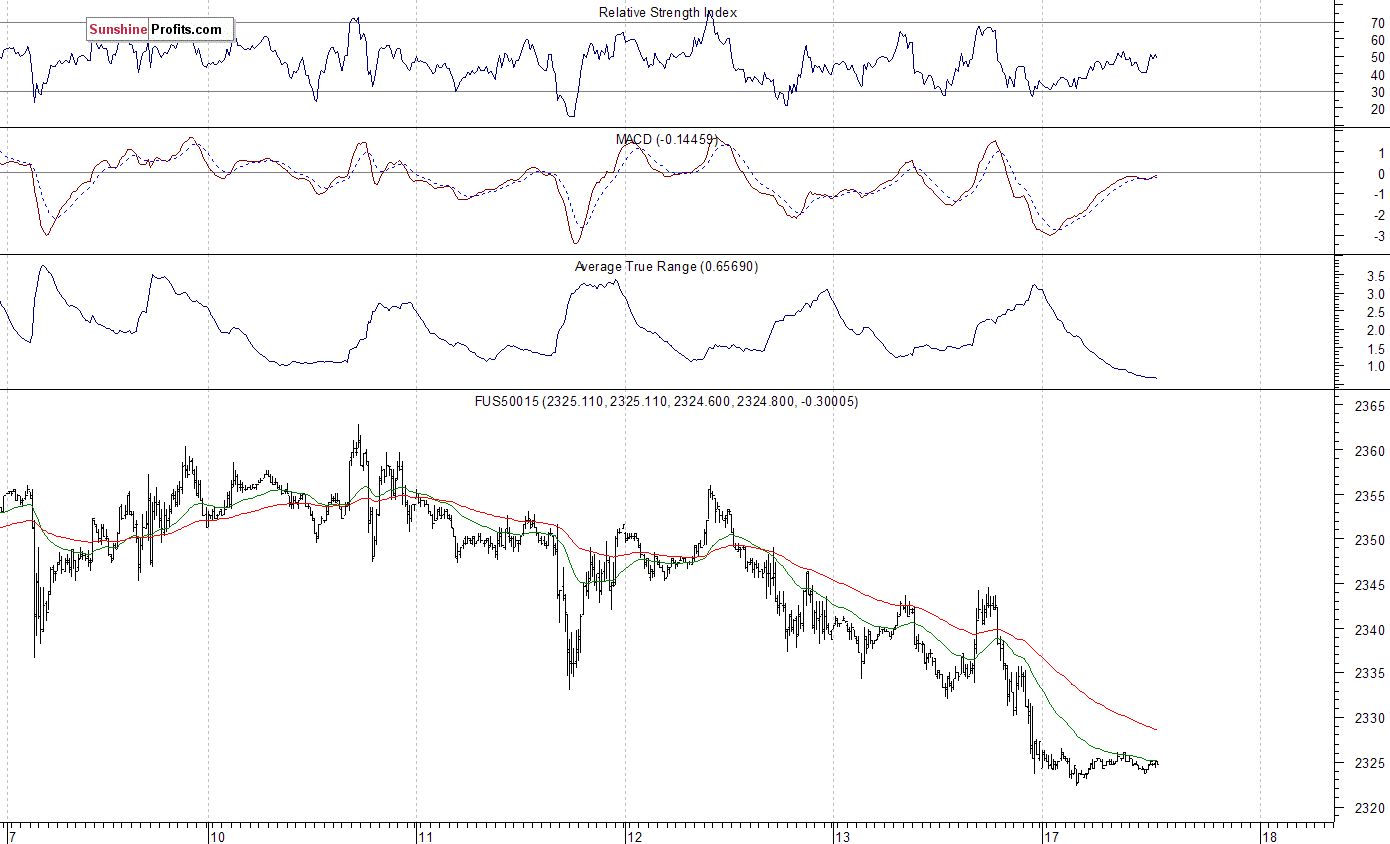
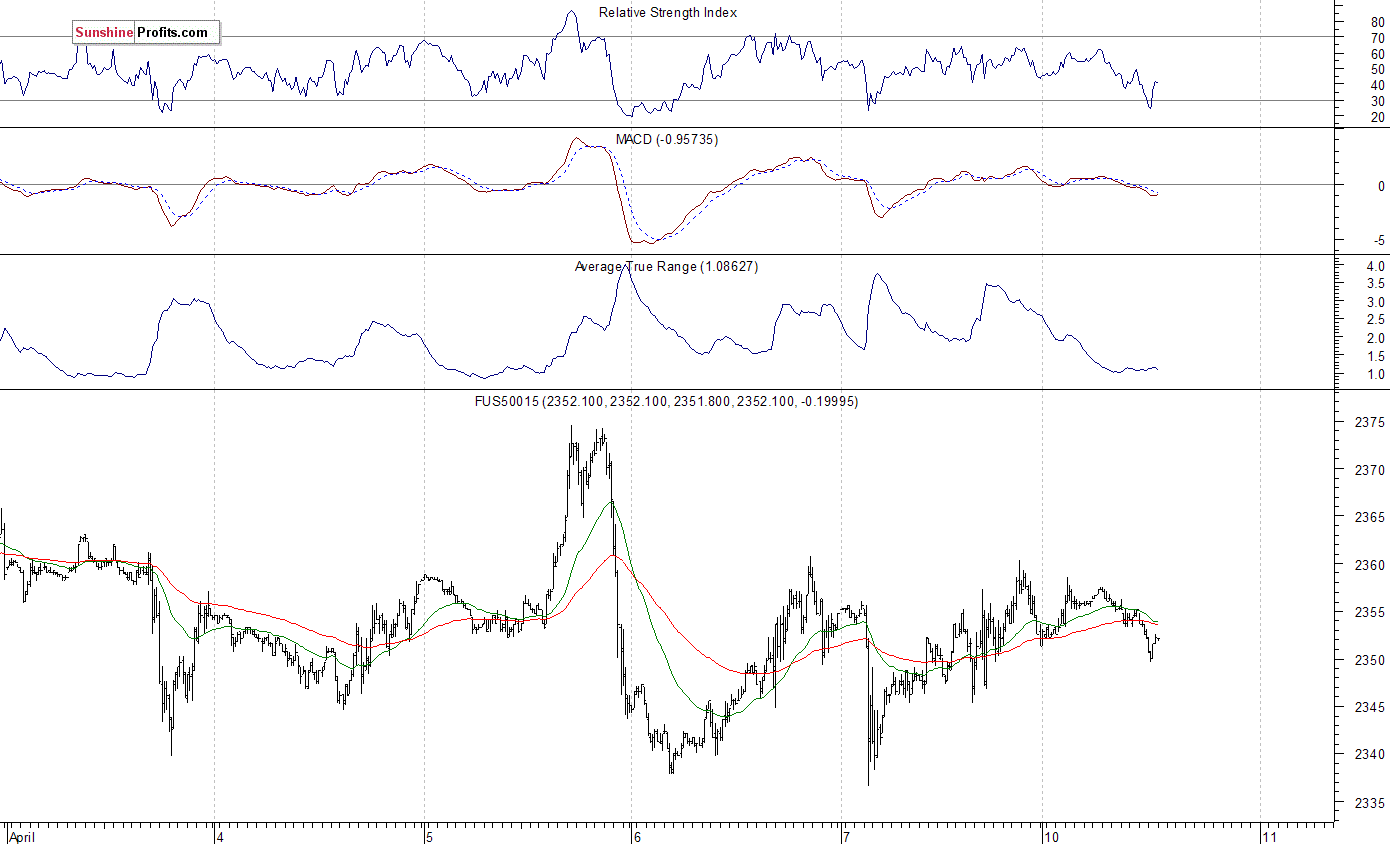
Expectations before the opening of today’s trading session are virtually flat, with index futures currently down 0.1%. The European stock markets are closed today. Investors will now wait for some economic data announcements: Empire Manufacturing number at 8:30 a.m., NAHB Housing Market Index at 10:00 a.m. The market expects that the Empire Manufacturing was at 13.0 in April. The S&P 500 futures contract trades within an intraday consolidation following Friday’s move down. The nearest important support level is at 2,320, marked by short-term consolidation. The next level of support is at around 2,300. On the other hand, the nearest important level of resistance is at around 2,330-2,340, marked by previous local lows. The next resistance level is at 2,345-2,355, marked by recent consolidation. The resistance level is also at 2,370-2,375, marked by the early April local high. The market trades within a short-term downtrend. Will it extend its move down? Or is this some short-term bottoming pattern before an upward reversal?
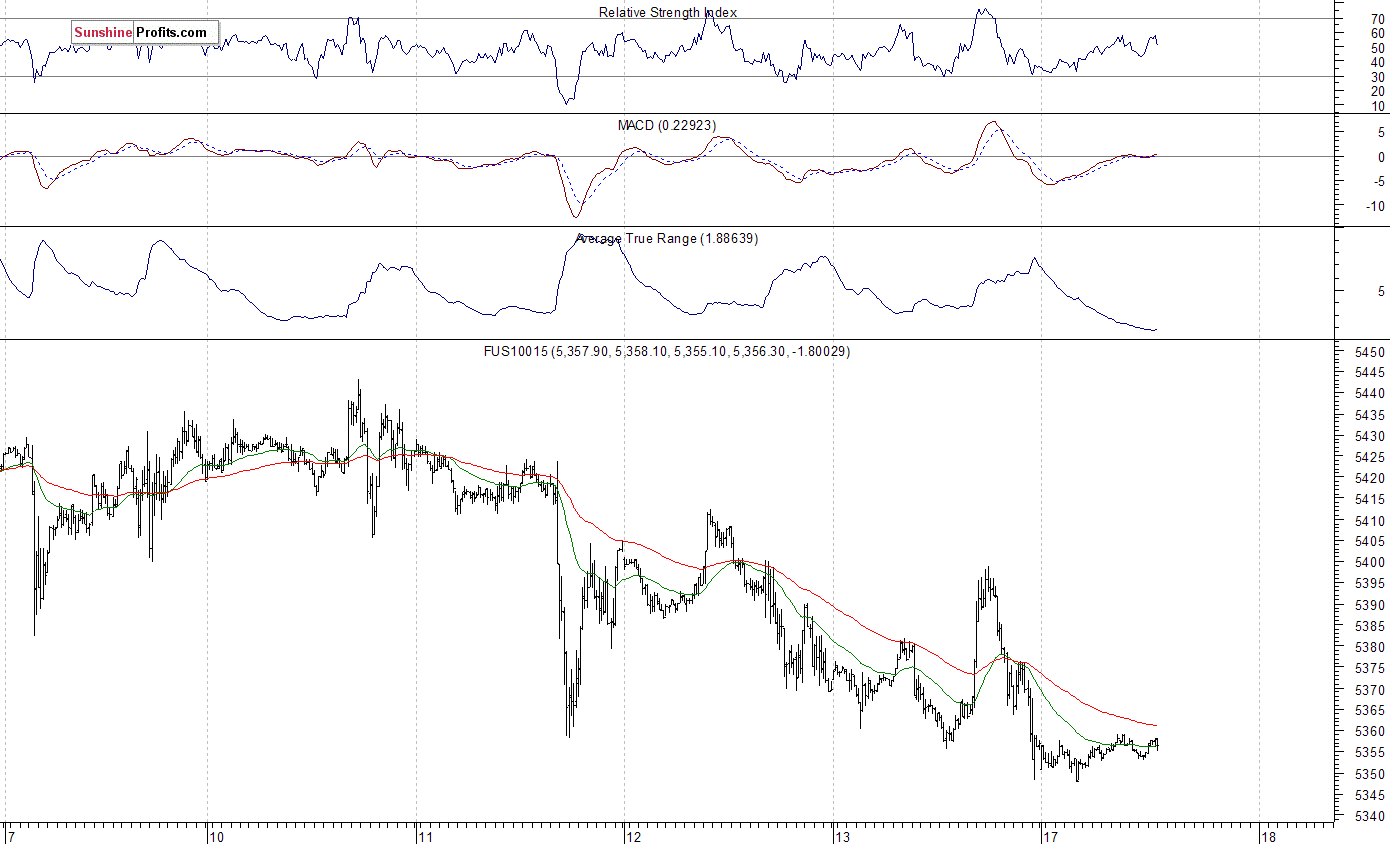
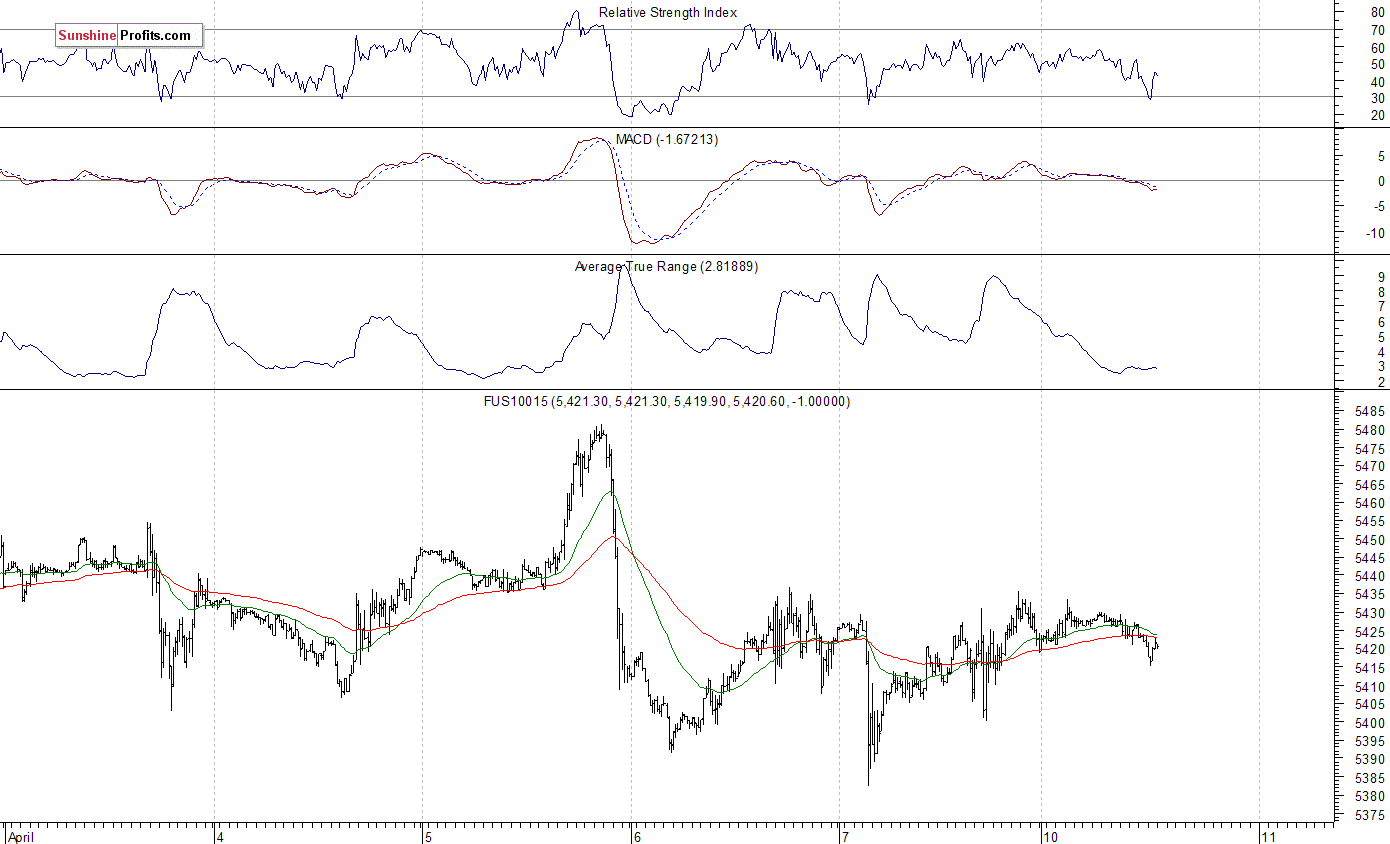
The technology Nasdaq 100 futures contract follows a similar path, as it currently trades within an intraday consolidation after its Friday’s decline of 0.4%. The nearest important support level is at around 5,350, marked by local lows. On the other hand, resistance level is at 5,380-5,400, marked by recent support level, The next resistance level is at 5,420-5,440, marked by short-term consolidation, as the 15-minute chart shows:
Concluding, the S&P 500 index continued its short-term downtrend on Friday, as it got closer to the late March local low. Is this a new downtrend or just downward correction? The broad stock market remains within an over-month-long consolidation following November-March rally. The index is currently trading below five-month-long medium-term upward trend line. There have been no confirmed short-term positive signals so far. However, we still can see medium-term negative technical divergences. Therefore, we continue to maintain our speculative short position (opened on February 15 at 2,335.58 – opening price of the S&P 500 index). Stop-loss level is at 2,410 and potential profit target is at 2,200 (S&P 500 index). You can trade S&P 500 index using futures contracts (S&P 500 futures contract – SP, E-mini S&P 500 futures contract – ES) or an ETF like the SPDR S&P 500 ETF – SPY. It is always important to set some exit price level in case some events cause the price to move in the unlikely direction. Having safety measures in place helps limit potential losses while letting the gains grow.
To summarize: short position in S&P 500 index is justified from the risk/reward perspective with the following entry prices, stop-loss orders and profit target price levels:
S&P 500 index – short position: profit target level: 2,200; stop-loss level: 2,410
S&P 500 futures contract (June) – short position: profit target level: 2,197; stop-loss level: 2,407
SPY ETF (SPDR S&P 500, not leveraged) – short position: profit target level: $220; stop-loss level: $241
SDS ETF (ProShares UltraShort S&P500, leveraged: -2x) – long position: profit target level: $15.47; stop-loss level: $12.98
Thank you.
Paul Rejczak
Stock Trading Strategist

The United States is the world’s largest and most diversified economy! It is currently suffering through a protracted period of slow growth which has held down job creation and labor market participation. The Pew Research Center reported, in late 2015, that a mere 19% of Americans trust the government either always or most of the time.
The FED must print more money in order to keep the party going forward.
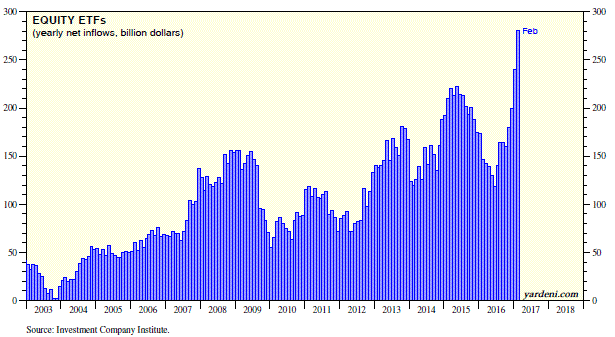
The bottom line is that this current bull market has been driven mostly by corporations which are buying back their shares, over the years. Individual investors have increasingly been moving out of equity mutual funds and into equity ETF’s.
The Congressional Budget Office (CBO) reported that in fiscal year 2016, the federal budget deficit increased in relation to the GDP, for the first time since 2009. The CBO projects that over the next decade, budget deficits will follow an upward trajectory. The spending costs for retirement and health care programs targeted towards senior citizens, and rising interest payments on the government’s debt will be the root drivers. There will be only a modest growth in revenue collections. This will drive up public debt to its’ highest level of gross domestic product (GDP) since shortly after World War II ended.
The Congressional Budget Office stated that the nation’s public debt will reach 145 percent of gross domestic product by 2047

Conclusion:
The BULLISH Trend in the stock markets is not reversing in the near future.
The stock market is on an upward trajectory. Are you wondering what you should do next?
Do you want to gain the edge that you need in order to beat the markets an profit during both rising and falling prices?
Take advantage of my insight and expertise as I can help you to grow your trading account. Tune in every morning for my video analysis and market forecasts at TheGoldAndOilGuy.com on all ‘asset classes’ and new ETF trade opportunities.
I always take half off of the table, on all positions, to lock in quick solid gains and then ride out the other half for much higher returns! I manage my risk while keeping profits!

A struggling global economy plus shaky governments around the world are triggering a massive flow of capital toward the best available opportunities.
Debt crises in Europe and Japan are driving capital flight out of bond markets in search of better investments.
And at the top of their list? You guessed it: U.S. stocks!
That’s why I’m not one bit surprised that over the past eight years, the Dow Jones Industrial Average has gone up a staggering 227%.
After all, capital is agnostic. It doesn’t care that governments are bankrupt or that their economies are struggling or that their currencies are deflating.
The thing is, regardless of world conditions, there are always people and companies that have enormous amounts of capital to invest. And capital always seeks the safest, best returns possible, no matter where they are in the world.
Larry Edelson accurately predicted this capital flight – away from the public sector (government bonds) into the private sector (stocks) – many years ago. He correctly explained that stocks represent assets that can outlast governments.
In fact, this is exactly what happened during the Great Depression – when the Dow rallied 372% from 1932 to 1937.
And it’s these powerful and undeniable global forces that are driving the bull market in U.S. stocks and will lift the Dow to 31,000.
That’s not a typo: 31,000 on the Dow.
But not without an occasional market correction.
In the long history of capital markets, nothing ever moves in a straight line either up or down – there are always minor corrections against the prevailing trends.
And fair warning, I see this dynamic setting up in U.S. stocks going into mid-year.
In the short-term – days and weeks ahead – the Dow Jones and S&P 500 Indexes could grind marginally higher on the back of strong first-quarter earnings season, but it won’t last.
While estimates have come down, the market is looking for first-quarter earnings growth of nearly 10 percent from the year-ago period – that’s a very tall order. And investors could be disappointed with actual results.
That’s just one of many catalysts that will trigger a healthy and much needed market correction lasting six to eight weeks …

The above chart of the Dow Jones Index slides into late June. This presents an excellent buying opportunity for select stocks, before they blast sharply higher again.
This will be the time to purchase blue chip stocks — and their sectors — on the cheap.
In fact, right now, I have my eyes on a couple of sectors under their belts. My list includes energy, consumer staples and defense, among other sectors. These stocks are ripe — and almost ready for the picking.
But now’s not the time to back up the truck. Patience and timing — as always — are key.
Good Investing,
Mike Burnick
Alert originally sent to subscribers on April 10, 2017, 6:57 AM.
Briefly: In our opinion, speculative short positions are favored (with stop-loss at 2,410, and profit target at 2,200, S&P 500 index).
Our intraday outlook is bearish, and our short-term outlook is bearish. Our medium-term outlook remains neutral, following S&P 500 index breakout above last year’s all-time high:
Intraday outlook (next 24 hours): bearish
Short-term outlook (next 1-2 weeks): bearish
Medium-term outlook (next 1-3 months): neutral
Long-term outlook (next year): neutral
The U.S. stock market indexes were virtually flat on Friday, as they lost 0.02-0.08%, following worse-than-expected monthly jobs report release. The S&P 500 index continued to fluctuate within its two-week-long short-term consolidation along the level of 2,350. The index remained around 2% below March 1 all-time high of 2,400.98. Is this a new downtrend or just relatively shallow downward correction before another medium-term leg up? The Dow Jones Industrial Average closed below 20,700 mark again, and technology Nasdaq Composite index remained below 5,900, following its last week’s Wednesday’s move to new record high. The nearest important level of support of the S&P 500 index is at around 2,350, marked by local lows. The next support level is at 2,335-2,340, marked by some previous local lows. The support level is also at 2,320, marked by February 13 daily gap up of 2,319.23-2,321.42, among others. On the other hand, the nearest important level of resistance is now at 2,370, marked by short-term local highs. The next resistance level is at 2,380-2,400, marked by all-time high, among others. We can see some short-term volatility following five-month-long rally off last year’s November low at around 2,100. Is this a topping pattern before downward reversal? The uptrend accelerated on March 1 and it looked like a blow-off top pattern accompanied by some buying frenzy. The S&P 500 index continues to trade along its medium-term upward trend line, as we can see on the daily chart:
Expectations before the opening of today’s trading session are virtually flat, with index futures currently between -0.01% and +0.01%. The European stock market indexes have lost 0.2-0.6% so far. The S&P 500 futures contract trades within an intraday downtrend, as it retraces some of its Friday’s rebound off support level at 2,345-2,350. The next important level of support is at around 2,335-2,340, marked by recent local low. On the other hand, the nearest important level of resistance is at 2,360, marked by late last week’s local highs. The next resistance level is at 2,370-2,375, marked by last week’s local high. The resistance level is also at around 2,400, marked by the early March record high. The market continues to trade within a short-term consolidation. Is this some medium-term topping pattern or just flat correction before another leg higher?
The technology Nasdaq 100 futures contract remains relatively stronger than the broad stock market, as it continues to trade above the level of 5,400. It has reached new all-time high above the level of 5,480 on last Wednesday. The nearest important level of resistance is at around 5,440-5,450, and the next resistance level is at 5,480-5,500. On the other hand, support level is at 5,380-5,400, marked by short-term local lows, as the 15-minute chart shows:
Concluding, the S&P 500 index extended its short-term consolidation on Friday, following the important monthly jobs report release. The market continues to fluctuate following late March rebound off support level. Is this a new uptrend or just upward correction within a downtrend off March 1 all-time high? The broad stock market remains close to its five-month-long medium-term upward trend line. There have been no confirmed short-term positive signals so far. However, we still can see medium-term overbought conditions along with negative technical divergences. Therefore, we continue to maintain our speculative short position (opened on February 15 at 2,335.58 – opening price of the S&P 500 index). Stop-loss level is at 2,410 and potential profit target is at 2,200 (S&P 500 index). You can trade S&P 500 index using futures contracts (S&P 500 futures contract – SP, E-mini S&P 500 futures contract – ES) or an ETF like the SPDR S&P 500 ETF – SPY. It is always important to set some exit price level in case some events cause the price to move in the unlikely direction. Having safety measures in place helps limit potential losses while letting the gains grow.
To summarize: short position in S&P 500 index is justified from the risk/reward perspective with the following entry prices, stop-loss orders and profit target price levels:
S&P 500 index – short position: profit target level: 2,200; stop-loss level: 2,410
S&P 500 futures contract (June) – short position: profit target level: 2,197; stop-loss level: 2,407
SPY ETF (SPDR S&P 500, not leveraged) – short position: profit target level: $220; stop-loss level: $241
SDS ETF (ProShares UltraShort S&P500, leveraged: -2x) – long position: profit target level: $15.47; stop-loss level: $12.98
Thank you.
Paul Rejczak
Stock Trading Strategist
Last week, I noted that as long as the S&P500 holds the 2320SPX level, it will begin a rally. On Monday, the market bottomed at 2322SPX, and began a 2% rally.
If one takes the time to become an open-minded market observer, one can learn a lot about the stock market, and how human beings react within the stock market.
We all know and love the phrase “buy low, and sell high.” While that is the ideal goal for investors, most investors are unable to attain their goals of buying the lows or selling the highs. Why is that? It is simply because we are emotional creatures, and we allow our emotions to drive our buying and selling decisions. For that reason, we are fearful to buy when all others around us are fearful as price drops, and we are exuberant and unable to sell when all others around us are euphoric at the highs. When you come to grips with this simple fact, and begin to understand the nature of the market, then you are on your way to becoming a much better investor.
So, back in February of 2016, when everyone was fearful of a stock market crash, we were turning quite bullish. And, we will not likely be turning bearish until the rest of the market turns bullish.
In fact, back in 2015 and going into 2016, I was warning my members at Elliottwavetrader.net that not only are we setting up for a rally which will take us to 2500+ on the SPX, but I was also expecting that the paradigms and correlations many follow would be breaking down.
And, since that time, as the evil emperor in Star Wars noted, “Everything is proceeding as I have foreseen.”
Moreover, it seems that Morgan Stanley has finally taken notice, stating this in early 2017:
“Regional correlations, cross-asset correlations and individual stock and FX correlations have fallen simultaneously. That’s unusual; we haven’t seen a shift this severe in over a decade . . .”
Before the election in November of 2016, I was again preparing the members in our trading room at Elliottwavetrader.net for the next phase of the strong rally I was expecting, which would take us into 2017. And, since that time, it seems the rally has not only taken most market participants by surprise, many still remain within their mindset of disbelief.
However, recently, I am witnessing something quite notable in the stock market. I am starting to see some former bears beginning to embrace this stock market rally. In fact, someone who was fighting this rally tooth and nail for quite some time noted this past week that “the traditional causes of recessions . . . are nowhere on the horizon.”
Those words were music to my ears. And, I am going to expect that more and more bears will be coming over to the dark side. Even Harry Dent, one of the biggest bears in the market for many years, turned bullish in early 2017. Yes, my friends, it seems the long-term topping process has begun. But, we still have a ways to go.
In fact, in Elliott Wave parlance, the point in time when former bears turn bullish begins once we move through the point of recognition, which is the heart of the 3rd wave within Elliott’s 5 wave structure. And, as you can see from the attached “before” and “after” charts, the heart of the 3rd wave, wave (III) of (3), is now done, which is likely why many former bears have begun to turn bullish.
See below two daily SPX charts by Avi, the top one from December 10, 2016 and the bottom from April 3, 2017, indicating how the S&P 500 closely followed his projected 3rd wave path. Click to expand charts


This is quite typical of how the market reacts. Remember, most people do not turn bullish at the lows, but rather, bullishness develops as the market rallies higher and higher, with the most extreme levels of bullishness being evident near major market tops. This is simply how human nature works within the herd, and being able to track market sentiment allows you to rise above it rather than become a part of it.
So, as we set up to head to 2500SPX to complete the 3rd wave in a few months, I certainly expect more bears will join the bullish party. By the time we have completed the 5th wave later this year, or early next year, the market will be proclaiming in unison that “the traditional causes of recessions . . . are nowhere on the horizon.” And, until the majority of the market becomes convinced of the bull market, there will be no correction of which to speak. So, for now, you can keep ignoring all those “crash” calls.
Remember the wise words of Professor Hernan Cortes:
“Financial markets never collapse when things look bad. In fact, quite the contrary is true. Before contractions begin, macroeconomic flows always look fine. That is why the vast majority of economists always proclaim the economy to be in excellent health just before it swoons.”
Along the lines of these “sentiments,” I remember reading this article quite some time ago which outlined the strongly bullish sentiments of market participants and officials right before the Great Depression. I think it is worth a read, as it is exactly what I am going to expect this time around. And, remember what George Santayana said:
“Those who cannot remember the past are condemned to repeat it.”
Price pattern sentiment indications and upcoming expectations
As I have been reiterating for years, the market will likely eclipse the 2500SPX level so that we are able to generate the bullishness needed to mark a long term market top. And, the way we are setting up right now, our first test of the 2500SPX region will likely occur by summer time.
However, it does not necessarily mean we will be taking a direct route. While the market may choose the direct route from here, I still think there is a high probability that we can rally to even a new all-time high before we test the 2300SPX region, and potentially even temporarily break it. That would then set up a strong 200 point rally to the 2500SPX region.
But, I would strongly suggest that you consider using any pullback in the market as a buying opportunity until we hit the 2500SPX region. Once we strike the 2500 region, long term investors can begin to reduce their risk, as we would be nearing the completion of the long-term trend. While there is still potential for another pullback going into the fall of 2017, which can set up one more rally over 2600SPX, I think the risks will have increased to levels not acceptable for most long-term investors once we do strike 2500SPX. And, when you consider that the top we will likely strike in 2017, or early 2018 will set us up to retest the 2100SPX region, it will not likely be worth the risk for most long-term investors.
See charts illustrating the wave counts on the S&P 500.
Avi Gilburt is a widely followed Elliott Wave technical analyst and author of ElliottWaveTrader.net (www.elliottwavetrader.net), a live Trading Room featuring his intraday market analysis (including emini S&P 500, metals, oil, USD & VXX), interactive member-analyst forum, and detailed library of Elliott Wave education.

-
I know Mike is a very solid investor and respect his opinions very much. So if he says pay attention to this or that - I will.
~ Dale G.
-
I've started managing my own investments so view Michael's site as a one-stop shop from which to get information and perspectives.
~ Dave E.
-
Michael offers easy reading, honest, common sense information that anyone can use in a practical manner.
~ der_al.
-
A sane voice in a scrambled investment world.
~ Ed R.
Inside Edge Pro Contributors

Greg Weldon

Josef Schachter

Tyler Bollhorn

Ryan Irvine

Paul Beattie

Martin Straith

Patrick Ceresna

Mark Leibovit

James Thorne

Victor Adair