
Stocks & Equities
“Pull” is a term used in shooting sporting clays, which are supposed to represent real birds and sharpen the shooter’s ability to actually hunt live birds. The term is yelled by the shooter to tell the person operating the trap to launch a sporting clay. “Pull” comes from an era long gone by when they actually had real birds in cages and the shooter would say “pull” to have the cage cord pulled and release the bird. The term “pull,” however, took on a whole new meaning last Friday when Speaker Ryan “pulled” the Republican healthcare bill (H.R. 1628) from consideration. I had literally said on CNBC earlier that day (as paraphrased): I lived in Washington D.C., and still have a pretty good network on Capitol Hill and typically what happens, if they don’t think a bill will pass, they pull it (read: withdraw it). But, there is NOTHING typical going on in D.C. these days! I also opined on the same show that – I was hearing that H.R.1628 was a few votes short of the ability to pass. Even if it had passed there would have been major revisions to it in the Senate. I guess it was once again the Russians that influenced the death of H.R. 1628 since they are being blamed for just about everything else. The question now becomes, “How will the various markets view Friday’s Foil?”
Speaking to many media types late Friday afternoon I suggested that a lot of technical damage has been done to the charts during the week. The S&P 500 (SPX/2343.98) broke down from its trading range of 2350 – 2400 that has existed since mid-February. The SPX has also closed decisively below its 20-day moving average (DMA) that has served as a support level since last December (Chart 1). Clearly, the gap in the price chart created by the Fed Fling (March 15, 2017) on the rate ratchet has now been filled raising the question, “Will the upside gap that occurred on February 10, 2017, to February 13, 2017, between 2311.08 and 2311.10 be filled?” Moreover, will the Trump agenda disappointments lead to a 0.328 Fibonacci retracement of the recent rally toward a downside target price of 2278? To be sure, the smart money is “betting” that way given the divergence between the CBOE SKEW Index and the Volatility Index’s (VIX) SKEW (Chart 2). As defined by the CBOE:
The CBOE SKEW Index (“SKEW”) is an index derived from the price of S&P 500 tail risk. Similar to VIX®, the price of S&P 500 tail risk is calculated from the prices of S&P 500 out-of-the-money options. SKEW typically ranges from 100 to 150. A SKEW value of 100 means that the perceived distribution of S&P 500 log-returns is normal and the probability of outlier returns is therefore, negligible. As SKEW rises above 100, the left tail of the S&P 500 distribution acquires more weight, and the probabilities of outlier returns become more significant. One can estimate these probabilities from the value of SKEW. Since an increase in perceived tail risk increases the relative demand for low strike puts, increases in SKEW also correspond to an overall steepening of the curve of implied volatilities, familiar to option traders as the “SKEW”.
Ladies and gentlemen, the current CBOE SKEW is around 145, and well above what the CBOE website describes as, “As SKEW rises above 100, the left tail of the S&P 500 distribution acquires more weight, and the probabilities of outlier returns become more significant.” Further, the VIX SKEW has diverged with the CBOE SKEW suggesting something BIG is getting ready to happen in the equity markets. Additionally, there is still plenty of “internal energy” to foster such a move, but unfortunately, our internal energy indicator does not tell us if that energy is going to be released on the upside or the downside. Our hunch remains that it will be released on the downside for the aforementioned reasons.
…related from Financial Sense:

While the Japanese and Swiss central banks have turned themselves into hedge funds by loading up on equities, the US Fed has stuck to supporting the stock market indirectly, by buying bonds. It’s worked, obviously, with all major US indexes at record highs. But it won’t work going forward, thanks to two gathering trends.
First, the main way bond buying supports equities is by lowering interest rates which, among other things, allows corporations to borrow cheaply and use the proceeds to buy back their own stock. Companies avoid paying dividends on the repurchased stock and the government gets capital gains tax revenue from a bull market. From a short-sighted Keynesian perspective, it’s a win-win.
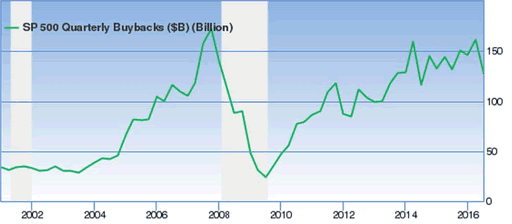
Alas, this New Age public/private partnership on running out of steam. Interest rates have fallen about as far as they can fall and corporations have borrowed about as much as they can borrow. So the buyback binge is topping:
Share Buybacks Sink For Second Straight Year
(Forbes) – According to S&P Dow Jones Indices, companies of the S&P 500 index in the fourth quarter pulled back on their share repurchases by 7.2% from the fourth quarter 2015, although they accelerated 20.6% sequentially.
Companies spent $135.3 billion buying back their shares during the fourth quarter, compared to $112.2 billion from the third quarter and $145.9 billion in the fourth quarter 2015. For the full year, they spent $536.4 billion on buybacks, a decline from $546.4 billion in 2015 and $553.3 billion in 2014 – the first time the index saw two consecutive years of declines since the financial crisis era or 2008 and 2009.
A longer-term but potentially much bigger problem for equities can be found in the structure of US retirement savings accounts. At age 70, holders of IRAs are required to start cashing them out, and as the number of Boomer retirees soars the size of these required sales will rise commensurately. Here’s a snippet from a longer analysis by Economica’s Chirs Hamilton. The full article is here.
Simply put, investing for the long term had it’s time but that time is drawing to a close. The math is pretty easy…we’ll have too many sellers and too few buyers. Why? At age 70.5 years old, retirees are mandated by force of law to sell tax deferred assets accumulated over their lifetime and do so in a 15 year period. Conversely, buyers, incented by tax deferral (but not forced to buy by law), generally have a 35yr window of accumulation. Over the past 65 years (on a population basis), there were three new buyers for every new seller. Over the next 25 years (on a population basis), there will be three new sellers for every new buyer.

In the next downturn, corporations will stop buying — as they always do at bottoms — and retirees will be forced by both necessity and law to liquidate some of their nest eggs. Combined, these sales will put unacceptable downward pressure on stock prices, leading to the kinds of instability that over-leveraged systems can’t handle.
The Fed – and probably the ECB – will then join the BOJ and SNB in buying equities. Like QE and the other recent monetary experiments, this might be seen by mainstream economists as a good thing. But it’s not. For at least three reasons why it’s not, see We’re All Hedge Funds Now, Part 4: Central Banks Become World’s Biggest Stock Speculators for at least three reasons why it will make a bad situation infinitely worse.
 Vancouver – April 4th
Calgary – April 11th
Dissatisfied with high fees and meager returns from traditional big bank mutual fund and ETF investing? You are not alone.
There is a powerful movement across the country – we see it every day. Canadians are taking charge of their financial future and looking for simple alternatives to help them build long-term wealth.
Join two of our favourite and most consistent stock pickers Ryan Irvine and Aaron Dunn from KeyStone Financial for a 2 hour workshop on how to build a simple portfolio designed to crush the market. Learn simple, proven, and powerful methods to identify which stocks to buy, which to avoid, and how to build an effective portfolio from the ground up. The seminar will focus on two key areas of your portfolio – growth and income (dividend).
CLICK HERE to register – Seating is extremely limited
Agenda
- Introduction
- Smart Strategies for Independent Investors
- Small Cap Stocks for High Growth
- Dividend Growth Stock Investing
- Put it Together and Build a Portfolio
- Open Questions from the Audience
- Conclusion

Sent to subscribers on March 23, 2017, 6:56 AM
Briefly: In our opinion, speculative short positions are favored (with stop-loss at 2,410, and profit target at 2,200, S&P 500 index).
Our intraday outlook is bearish, and our short-term outlook is bearish. Our medium-term outlook remains neutral, following S&P 500 index breakout above last year’s all-time high:
Intraday outlook (next 24 hours): bearish
Short-term outlook (next 1-2 weeks): bearish
Medium-term outlook (next 1-3 months): neutral
Long-term outlook (next year): neutral
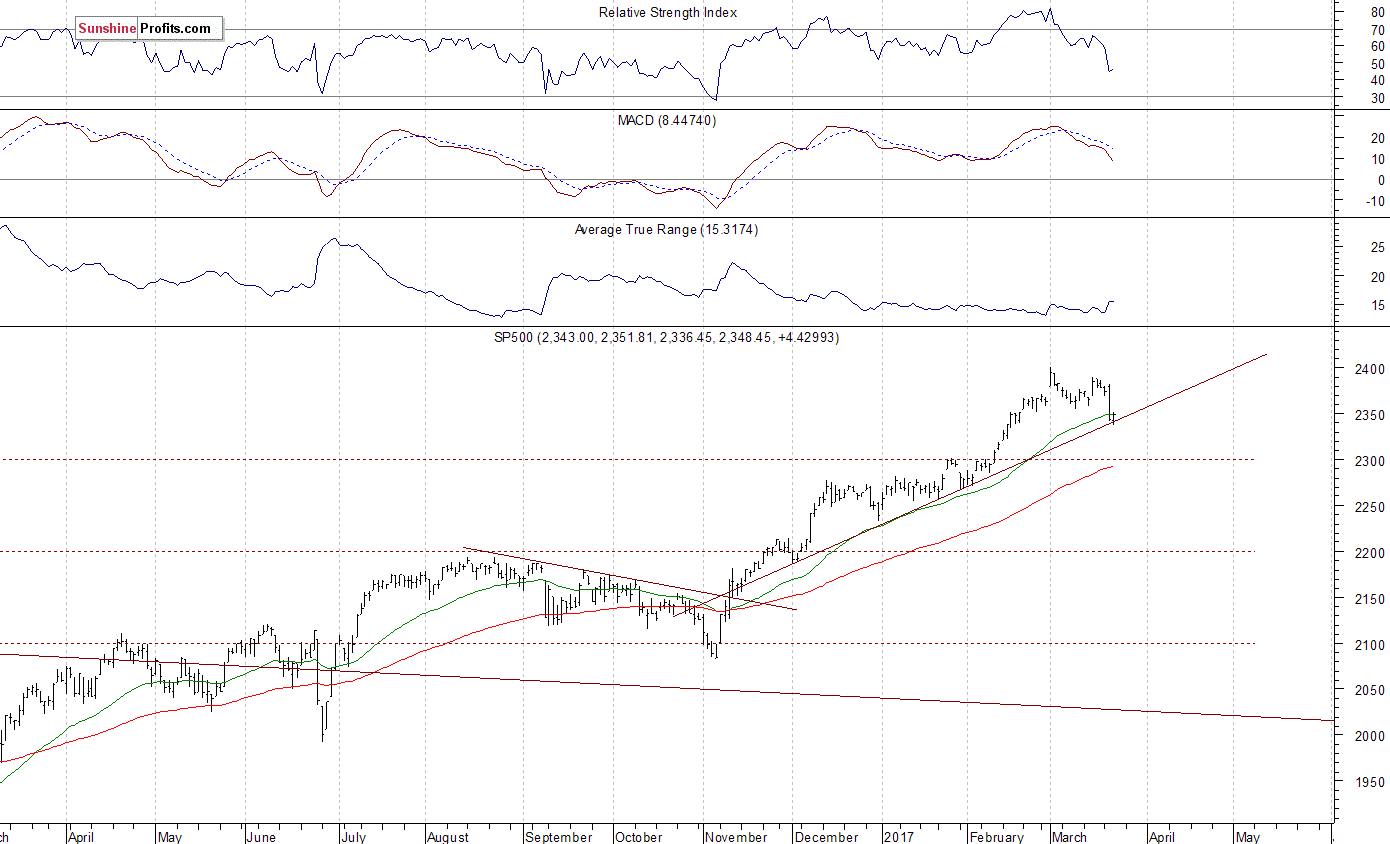
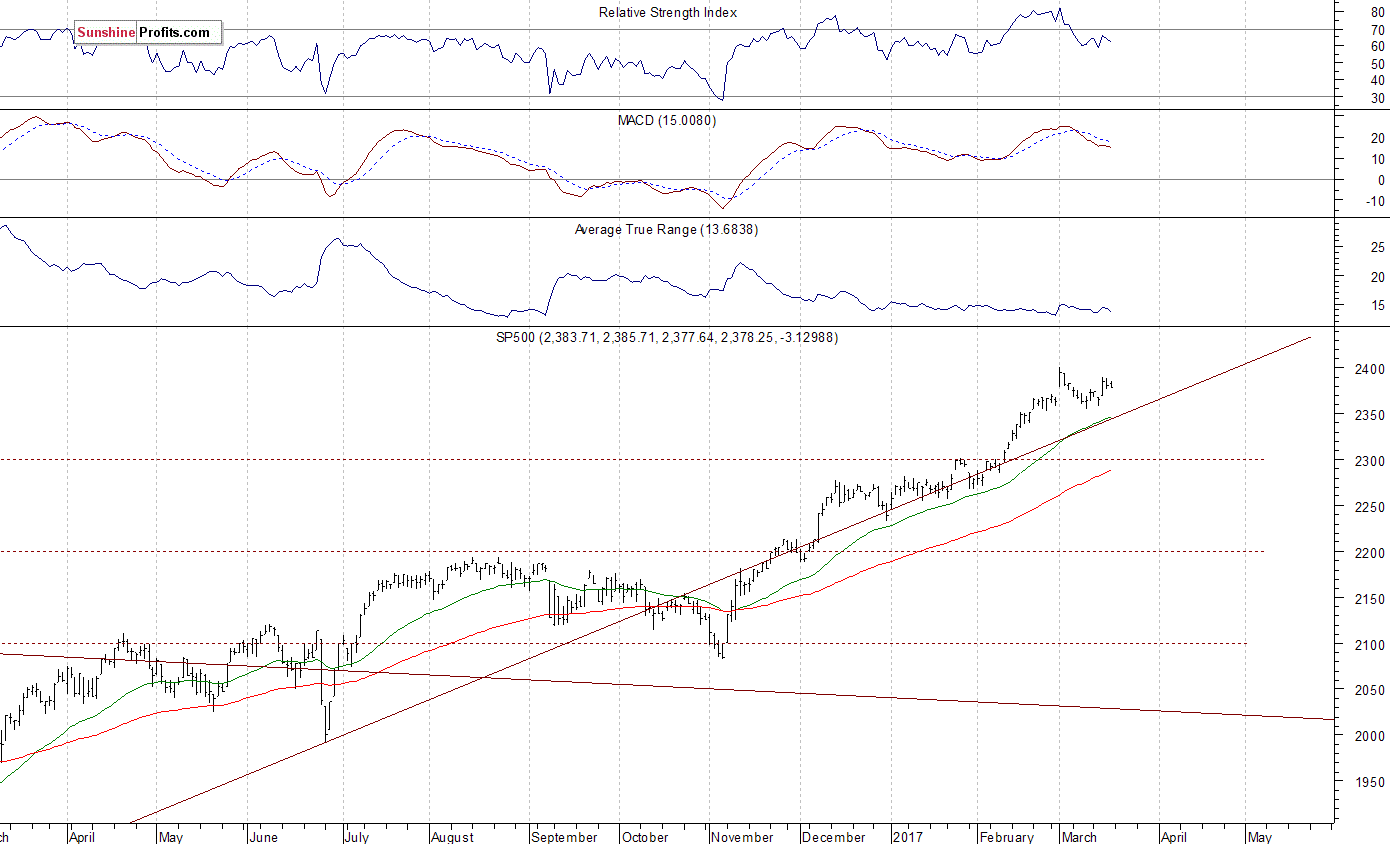
The U.S. stock market indexes were mixed between 0.0% and +0.7% on Wednesday, as investors hesitated following Tuesday’s relatively big move down. Traders took profits off the table after last week’s interest rates increase, among others. The S&P 500 index remained more than 2% below its March 1 all-time high of 2,400.98. The Dow Jones Industrial Average continued to trade below 20,700 mark, and the technology Nasdaq Composite index bounced by 0.5%, as it broke above the level of 5,800 again. Overall, stocks continued to trade below their almost month-long consolidation along new record highs. Is this just correction or a new downtrend? For now, it looks like a downward correction within medium-term uptrend. The nearest important level of support of the S&P 500 index is at around 2,335-2,340, marked by some previous local lows. The next support level remains at 2,320, marked by February 13 daily gap up of 2,319.23-2,321.42, among others. The support level is also at around 2,300, marked by December – January local highs. On the other hand, the nearest important level of resistance is now at around 2,350-2,360, marked previous level of support. The next resistance level is at 2,390-2,400, marked by all-time high. We can see some short-term volatility following four-month-long rally off last year’s November low at around 2,100. Is this a topping pattern before downward reversal? The uptrend accelerated on March 1 and it looked like a blow-off top pattern accompanied by some buying frenzy. The S&P 500 index trades at its five-month-long upward trend line, as we can see on the daily chart:
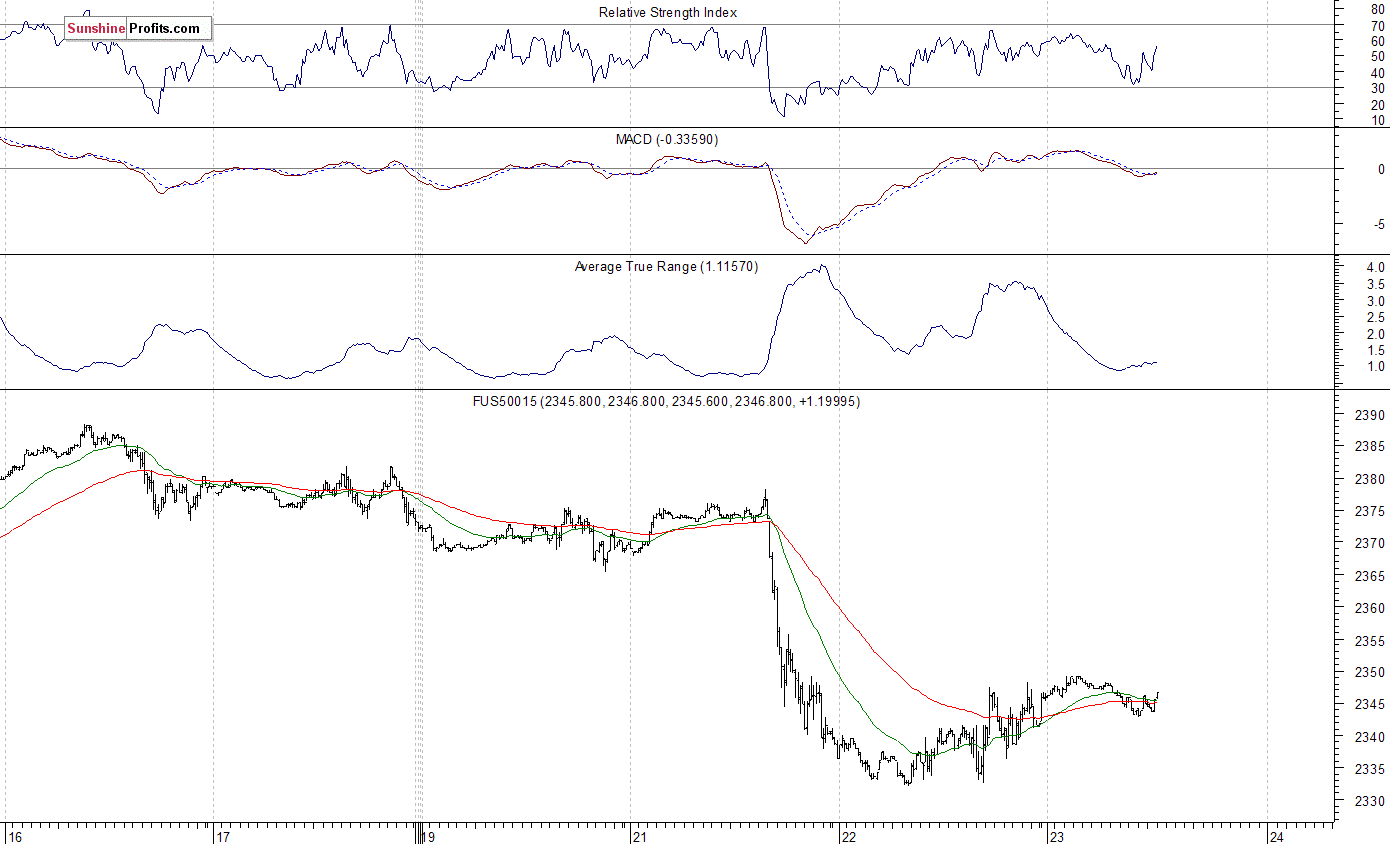
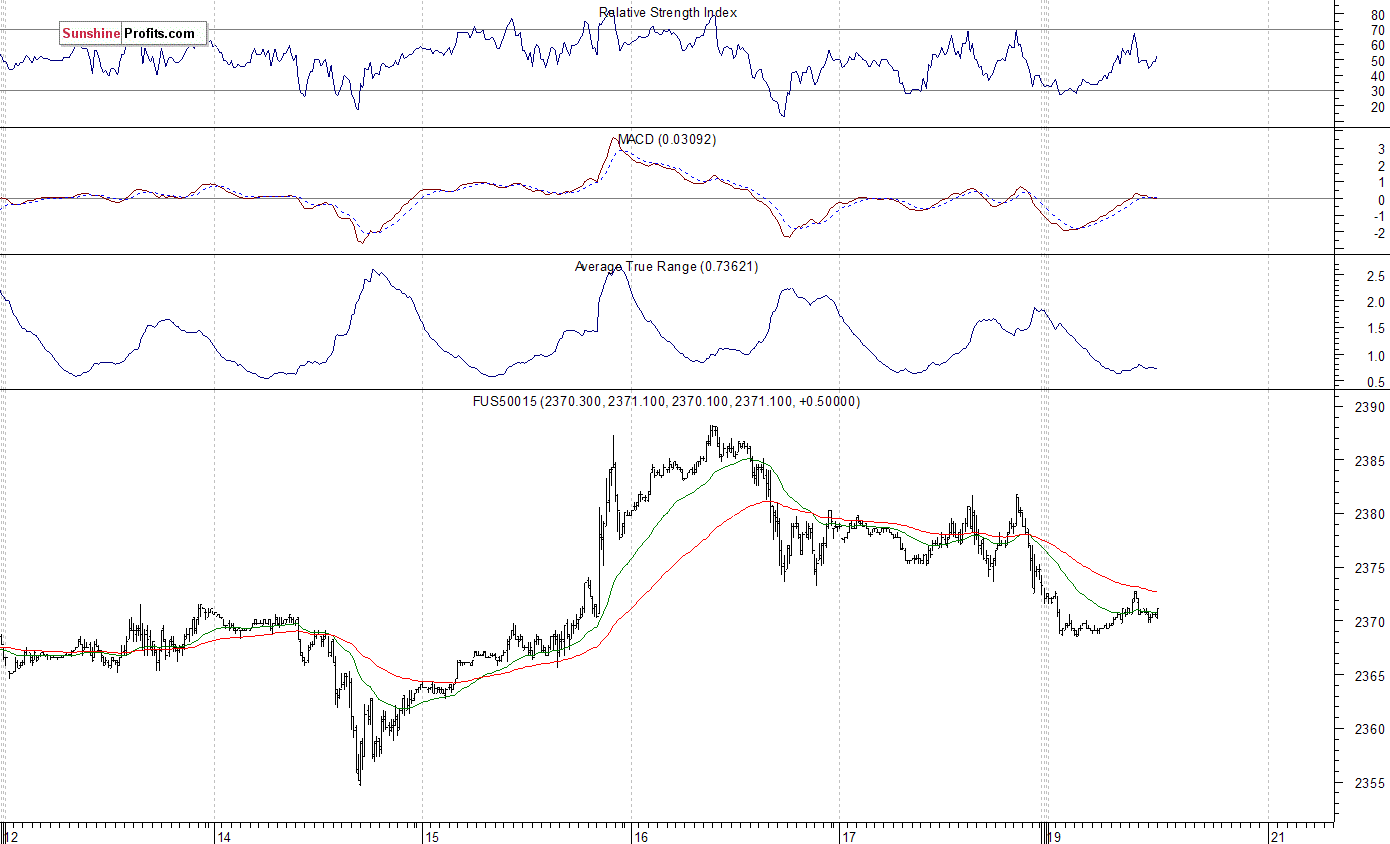
Expectations before the opening of today’s trading session are slightly positive, with index futures currently between 0.0% and +0.2% vs. their yesterday’s closing prices. The European stock market indexes have been mixed so far. Investors will now wait for some economic data announcements: Initial Claims at 8:30 a.m., New Home Sales at 10:00 a.m. The market expects that New Home Sales were 560,000 in February, slightly up from last month’s number of 555,000. The S&P 500 futures contract trades within an intraday consolidation, following overnight move down. It has retraced some of its yesterday’s rebound off support level at 2,330-2,335. The nearest important level of resistance is at around 2,350, marked by short-term local high. The next resistance level is at 2,360-2,365, marked by previous consolidation. On the other hand, support level is at 2,330, and the next support level remains at 2,300-2,320, among others. The market trades within a short-term downtrend, following breakdown below recent trading range. Will it continue lower, or is this just a quick downward correction within five-month-long rally off November low?
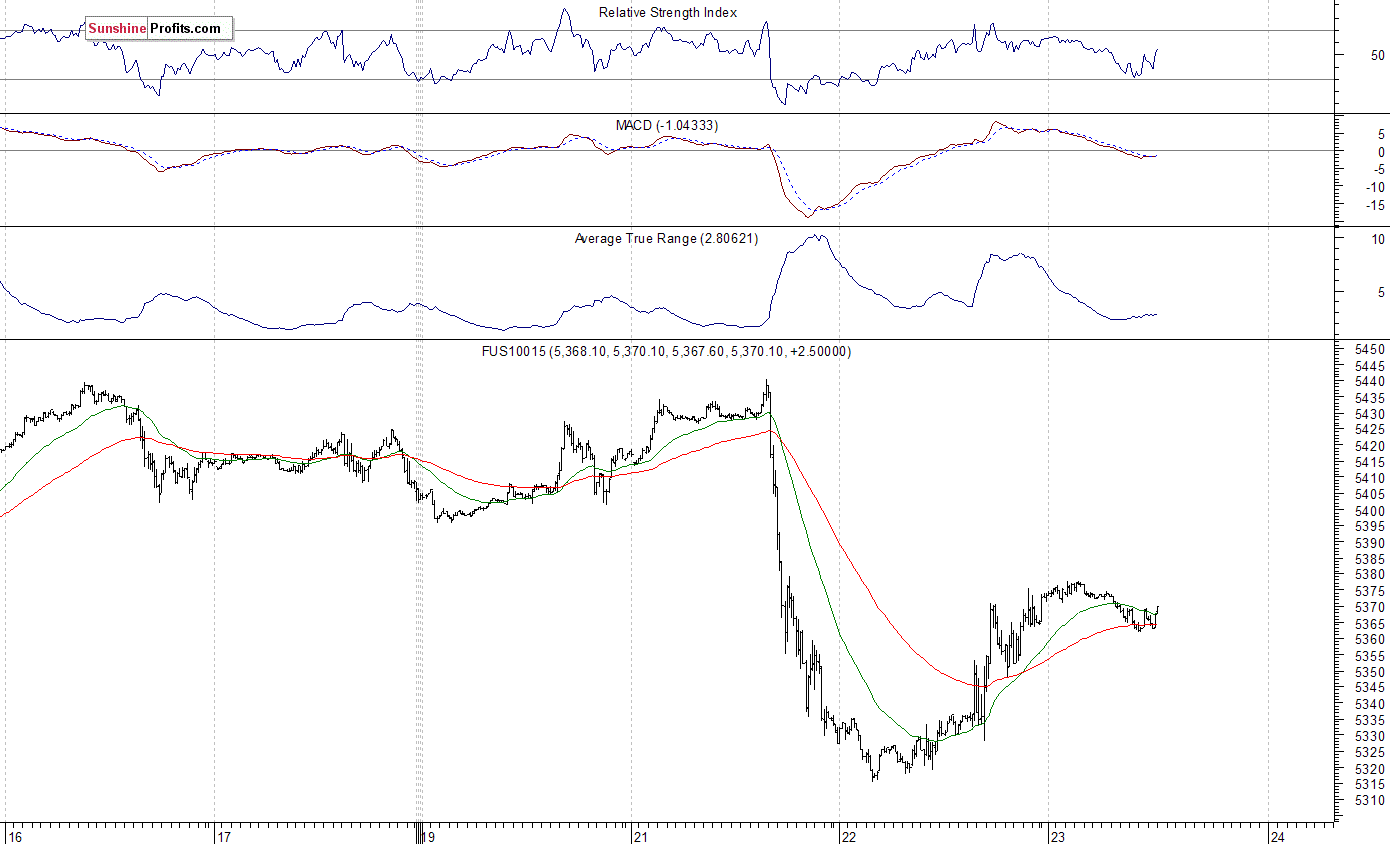
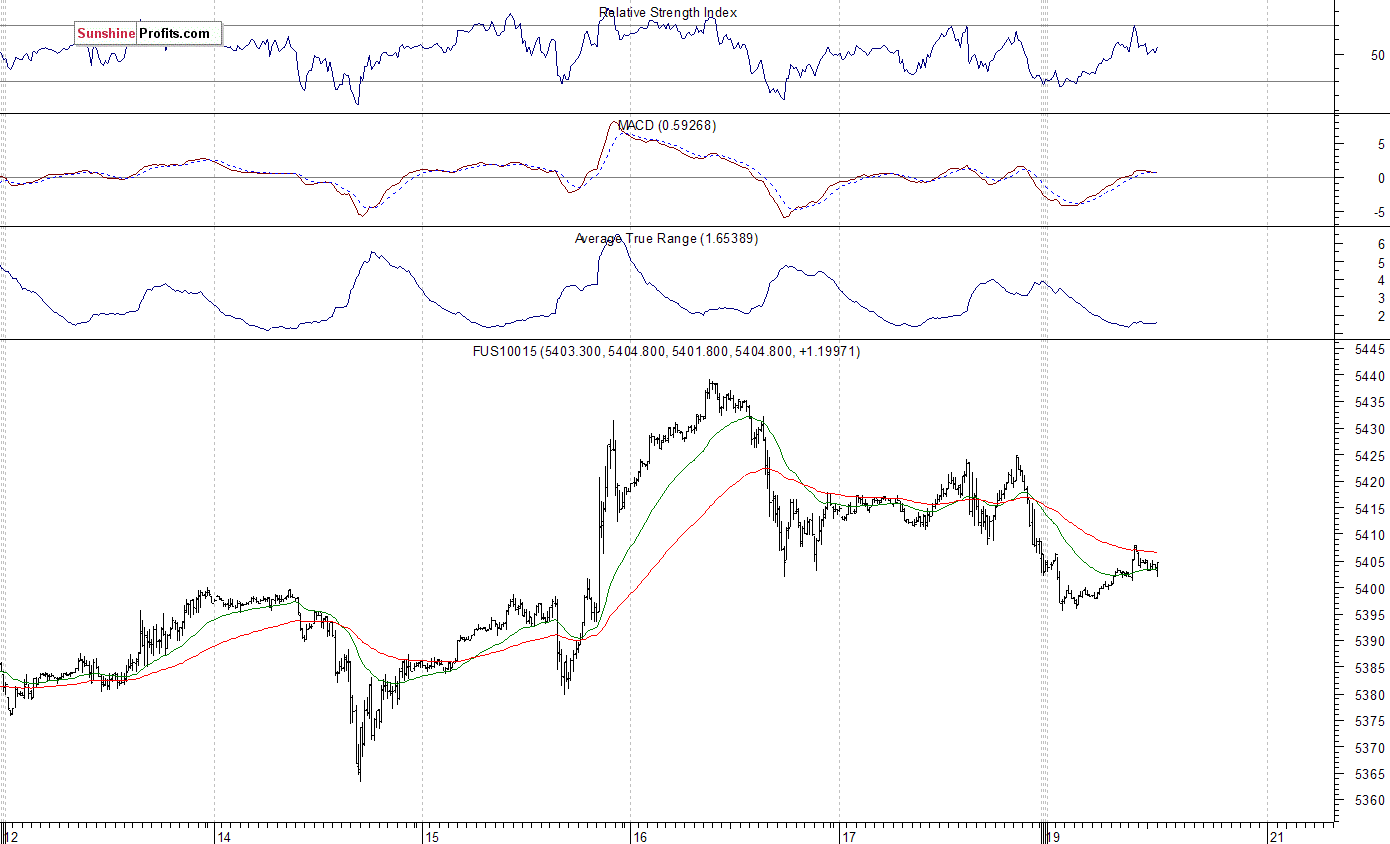
The technology Nasdaq 100 futures contract was relatively weaker than the broad stock market on Wednesday. However, it has retraced some of its weakness yesterday. The market has reached the resistance level of 5,380-5,400. The nearest important level of support is now at around 5,350, marked by some short-term fluctuations. The next support level remains at 5,300-5,320, as the 15-minute chart shows:
Concluding, the broad stock market retraced some of its Tuesday’s decline yesterday, as the S&P 500 index gained 0.2%. Is this just a quick rebound before another leg down or upward reversal? There have been no confirmed short-term positive signals so far. We still can see medium-term overbought conditions along with negative technical divergences. Therefore, we continue to maintain our speculative short position (opened on February 15 at 2,335.58 – opening price of the S&P 500 index). Stop-loss level is at 2,410 and potential profit target is at 2,200 (S&P 500 index). You can trade S&P 500 index using futures contracts (S&P 500 futures contract – SP, E-mini S&P 500 futures contract – ES) or an ETF like the SPDR S&P 500 ETF – SPY. It is always important to set some exit price level in case some events cause the price to move in the unlikely direction. Having safety measures in place helps limit potential losses while letting the gains grow.
To summarize: short position in S&P 500 index is justified from the risk/reward perspective with the following entry prices, stop-loss orders and profit target price levels:
S&P 500 index – short position: profit target level: 2,200; stop-loss level: 2,410
S&P 500 futures contract (March) – short position: profit target level: 2,197; stop-loss level: 2,407
SPY ETF (SPDR S&P 500, not leveraged) – short position: profit target level: $220; stop-loss level: $241
SDS ETF (ProShares UltraShort S&P500, leveraged: -2x) – long position: profit target level: $15.47; stop-loss level: $12.98
Thank you.
Paul Rejczak
Stock Trading Strategist
Stock Trading Alerts
….also: Waning Trump’s Rally and Gold
Stock Trading Alert originally sent to subscribers on March 20, 2017, 6:57 AM.
Briefly: In our opinion, speculative short positions are favored (with stop-loss at 2,410, and profit target at 2,200, S&P 500 index).
Our intraday outlook is bearish, and our short-term outlook is bearish. Our medium-term outlook remains neutral, following S&P 500 index breakout above last year’s all-time high:
Intraday outlook (next 24 hours): bearish
Short-term outlook (next 1-2 weeks): bearish
Medium-term outlook (next 1-3 months): neutral
Long-term outlook (next year): neutral
The U.S. stock market indexes lost 0.1% on Friday, extending their short-term consolidation following Wednesday’s FOMC Rate Decision release rally. The S&P 500 index remains relatively close to its March 1 all-time high of 2,400.98. The Dow Jones Industrial Average continued to trade above 20,900 mark, and the technology Nasdaq Composite index remained above the level of 5,900. All three major stock market indexes remain relatively close to their early March new record highs. For now, it looks like a flat correction within medium-term uptrend. Will stocks break above their few-week-long trading range? The nearest important level of support of the S&P 500 index is at around 2,370-2,375, marked by recent local highs. The next support level remains at 2,350-2,360, marked by local lows and the February 21 daily gap up of 2,351.16-2,354.91. The support level is also at around 2,320. On the other hand, the nearest important level of resistance is at around 2,390-2,400, marked by all-time high. Will the market extend its year-long medium-term uptrend even further before some more meaningful downward correction? We can see some short-term volatility following four-month-long rally off last year’s November low at around 2,100. Is this a topping pattern before downward reversal? The uptrend accelerated on March 1 and it looked like a blow-off top pattern accompanied by some buying frenzy. The S&P 500 index continues to trade above its over year-long medium-term upward trend line, as we can see on the daily chart:
Expectations before the opening of today’s trading session are slightly negative, with index futures currently down 0.1-0.2%. The European stock market indexes have lost 0.2-0.4% so far. There will be no new economic data announcements today. Investors will wait for Wednesday’s Existing Home Sales and Crude Inventories releases, among others. The S&P 500 futures contract trades within an intraday consolidation, as it fluctuates following an overnight move down. It currently trades along the level of 2,370. The nearest important level of resistance is at around 2,375-2,380, marked by short-term consolidation. The next resistance level is at 2,395-2,400, marked by all-time high. On the other hand, support level is at 2,365-2,370, marked by previous local highs, among others. The next support level remains at 2,355-2,360, marked by short-term consolidation. The market continues to trade within a consolidation following late April – early March rally. There have been no confirmed negative signals so far. But will it break above its early March record high?
The technology Nasdaq 100 futures contract remains relatively stronger than the broad stock market, as it continues to trade above 5,400 mark. The market extends its eight-year-long bull-run. It trades relatively close to new record high. The resistance level is at around 5,440, marked by last week’s new all-time high. The nearest important level of support is at 5,400, marked by previous level of resistance. The next support level remains at 5,370, marked by some local lows, as the 15-minute chart shows:
Concluding, the broad stock market continued to fluctuate on Friday, as investors remained uncertain following Wednesday’s Fed’s interest rate hike announcement. The S&P 500 index remains relatively close to its early March record high. Will the market resume its medium-term uptrend? There have been no confirmed negative signals so far. However, we still can see medium-term overbought conditions accompanied by negative technical divergences. Stocks may retrace some of their almost five-month-long rally at some point in time. Therefore, we continue to maintain our speculative short position (opened on February 15 at 2,335.58 – opening price of the S&P 500 index). Stop-loss level is at 2,410 and potential profit target is at 2,200 (S&P 500 index). You can trade S&P 500 index using futures contracts (S&P 500 futures contract – SP, E-mini S&P 500 futures contract – ES) or an ETF like the SPDR S&P 500 ETF – SPY. It is always important to set some exit price level in case some events cause the price to move in the unlikely direction. Having safety measures in place helps limit potential losses while letting the gains grow.
To summarize: short position in S&P 500 index is justified from the risk/reward perspective with the following entry prices, stop-loss orders and profit target price levels:
S&P 500 index – short position: profit target level: 2,200; stop-loss level: 2,410
S&P 500 futures contract (March) – short position: profit target level: 2,197; stop-loss level: 2,407
SPY ETF (SPDR S&P 500, not leveraged) – short position: profit target level: $220; stop-loss level: $241
SDS ETF (ProShares UltraShort S&P500, leveraged: -2x) – long position: profit target level: $15.47; stop-loss level: $12.98
Thank you.
Paul Rejczak
Stock Trading Strategist
Stock Trading Alerts

-
I know Mike is a very solid investor and respect his opinions very much. So if he says pay attention to this or that - I will.
~ Dale G.
-
I've started managing my own investments so view Michael's site as a one-stop shop from which to get information and perspectives.
~ Dave E.
-
Michael offers easy reading, honest, common sense information that anyone can use in a practical manner.
~ der_al.
-
A sane voice in a scrambled investment world.
~ Ed R.
Inside Edge Pro Contributors

Greg Weldon

Josef Schachter

Tyler Bollhorn

Ryan Irvine

Paul Beattie

Martin Straith

Patrick Ceresna

Mark Leibovit

James Thorne

Victor Adair