There probably only is a remote possibility that the S&P 500 (NYSE:SPX) topped out as 2,395 on the 1st of March last week as equities, in my opinion, will remain elevated until the FOMC meeting.


Sent to subscribers on March 16, 2017, 6:55 AM.
Briefly: In our opinion, speculative short positions are favored (with stop-loss at 2,410, and profit target at 2,200, S&P 500 index).
Our intraday outlook is bearish, and our short-term outlook is bearish. Our medium-term outlook remains neutral, following S&P 500 index breakout above last year’s all-time high:
Intraday outlook (next 24 hours): bearish
Short-term outlook (next 1-2 weeks): bearish
Medium-term outlook (next 1-3 months): neutral
Long-term outlook (next year): neutral
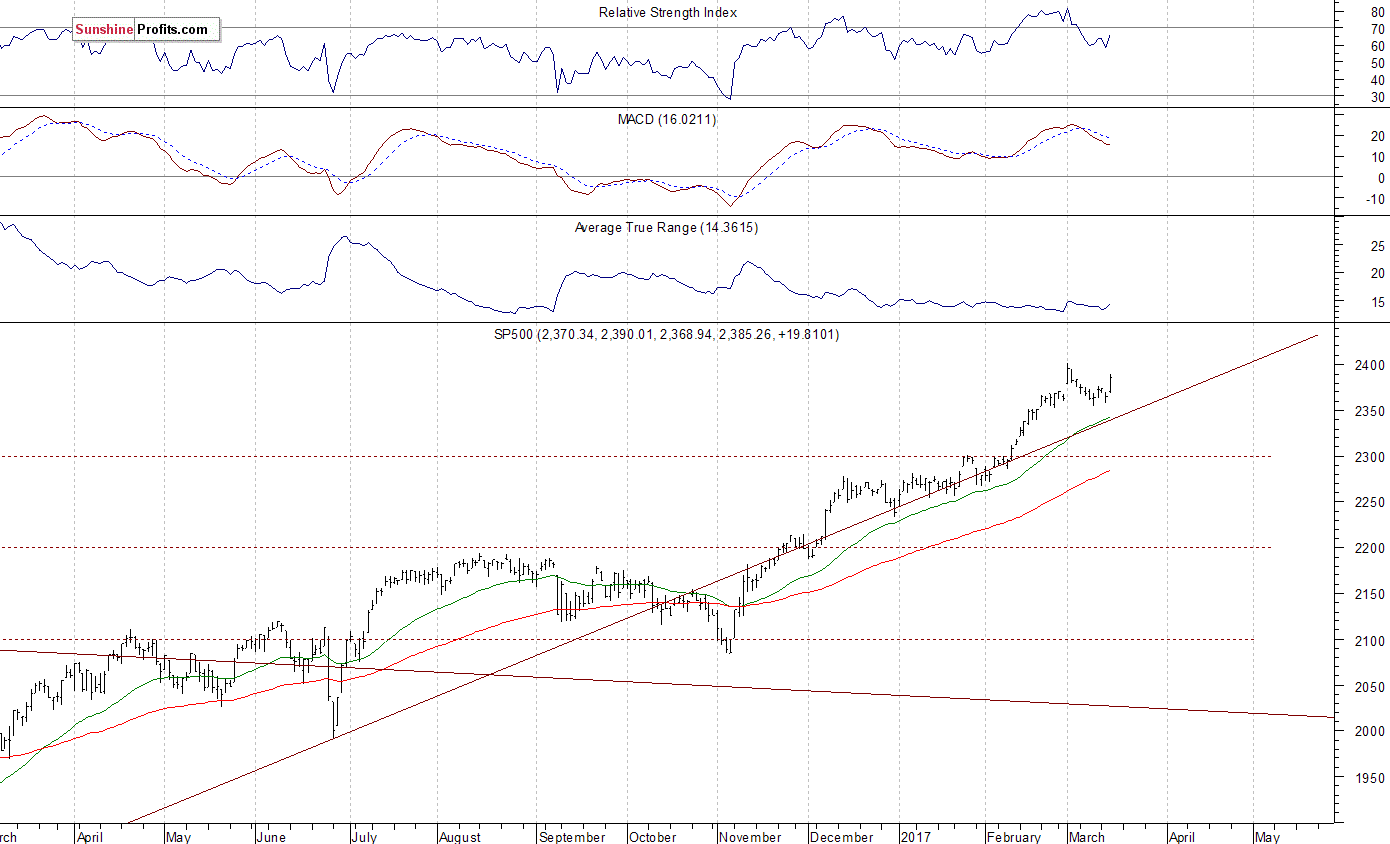
The U.S stock market indexes gained between 0.5% and 0.8% on Wednesday, breaking above their recent consolidation, as investors reacted to the FOMC’s Rate Decision announcement. The S&P 500 index has bounced off support level of 2,350-2,360 on Tuesday. It accelerated its short-term uptrend yesterday and got closer to March 1 all-time high of 2,400.98. The Dow Jones Industrial Average has managed to close above 20,900 mark, and the technology Nasdaq Composite index has got close to its record high above 5,900 mark. All three major stock market indexes continue to trade relatively close to their early March new record highs. The nearest important level of support of the S&P 500 index is at around 2,370-2,375, marked by recent local highs. The next support level remains at 2,350-2,360, marked by local lows and the February 21 daily gap up of 2,351.16-2,354.91. The support level is also at around 2,320. On the other hand, the nearest important level of resistance is at around 2,390-2,400, marked by all-time high. Will the market extend its year-long medium-term uptrend even further before some more meaningful downward correction? We can see some short-term volatility following four-month-long rally off last year’s November low at around 2,100. Is this a topping pattern before downward reversal? The uptrend accelerated on March 1 and it looked like a blow-off top pattern accompanied by some buying frenzy. The S&P 500 index continues to trade above its over year-long medium-term upward trend line, as we can see on the daily chart:
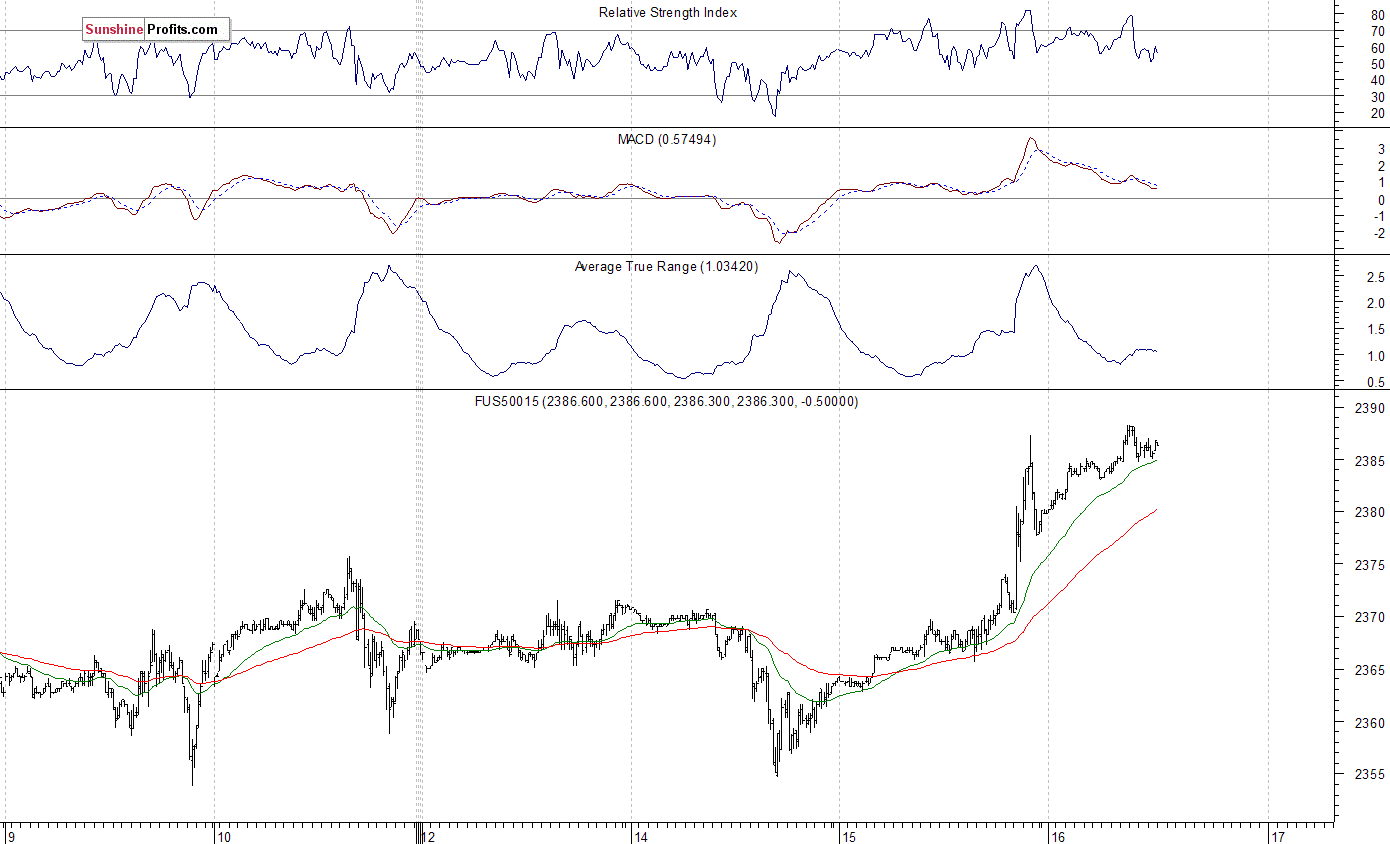
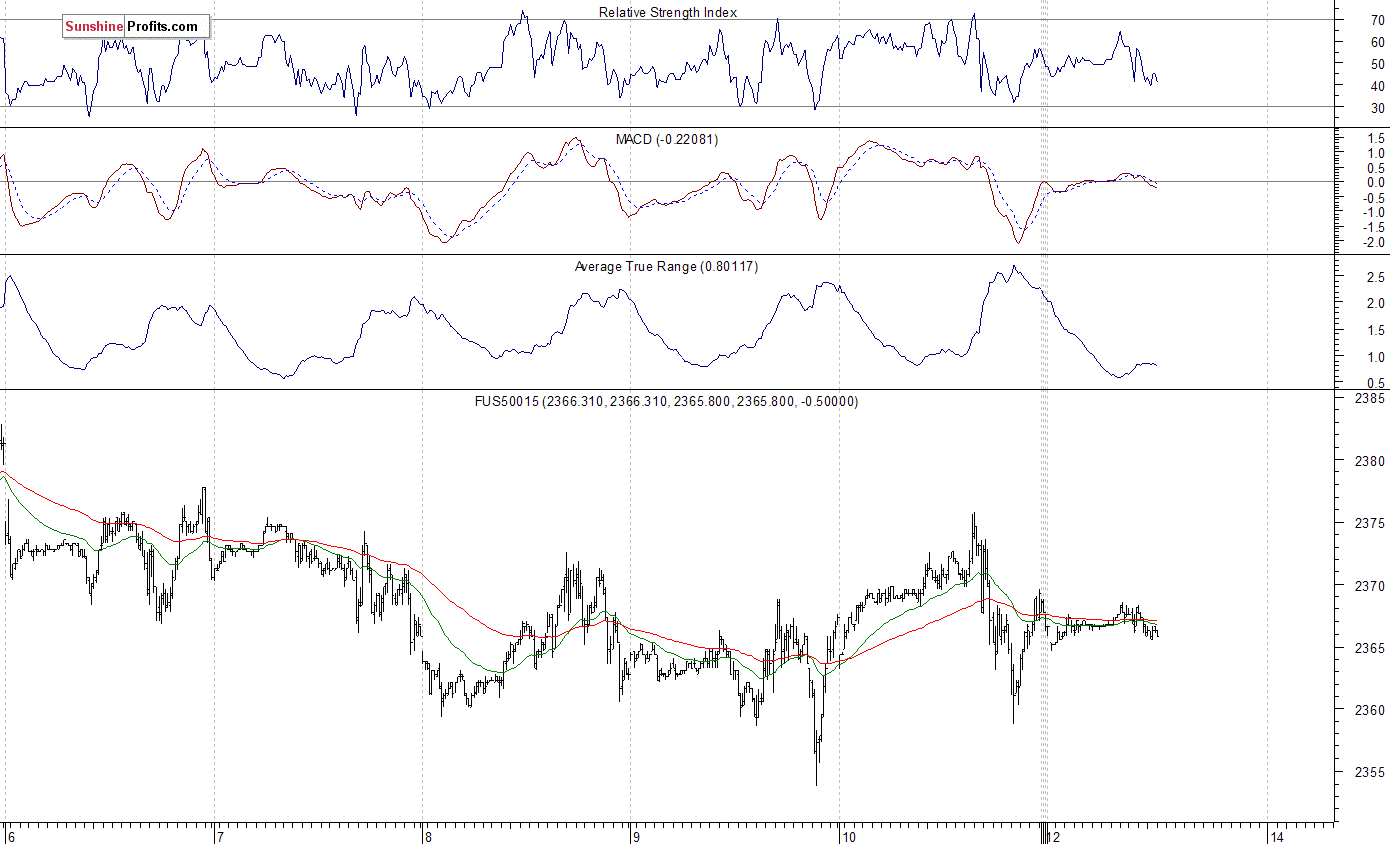
Expectations before the opening of today’s trading session are positive, with index futures currently up 0.2-0.3%. The European stock market indexes have gained 0.9-1.0% so far. Investors will now wait for some economic data announcements: Initial Claims, Housing Starts, Building Permits, Philadelphia Fed at 8:30 a.m., JOLTS – Job Openings at 10:00 a.m. The market expects that Housing Starts number was at 1,260K and Building Permits was at 1,251K in February, relatively flat vs. prior data. The S&P 500 futures contract trades within an intraday uptrend, as it retraces yesterday’s late session move down. It currently trades along the level of 2,385. The nearest important level of resistance is at around 2,395-2,400, marked by all-time high. On the other hand, support level is at 2,370-2,375, marked by previous level of resistance. The next support level remains at 2,355-2,360, marked by short-term local lows. The market continues to trade within a consolidation following late April – early March rally. There have been no confirmed negative signals so far. Will it break above its early March record high?
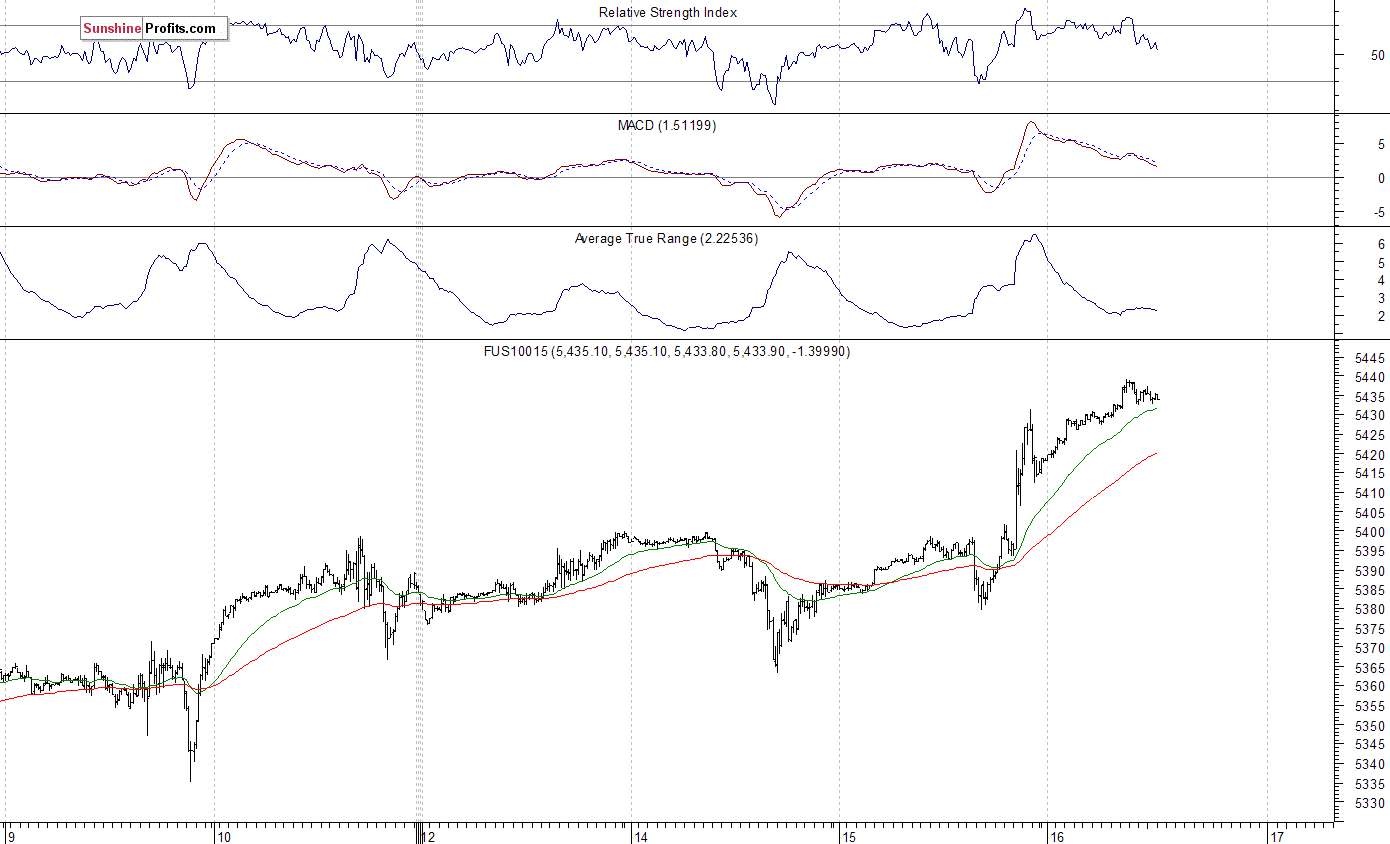
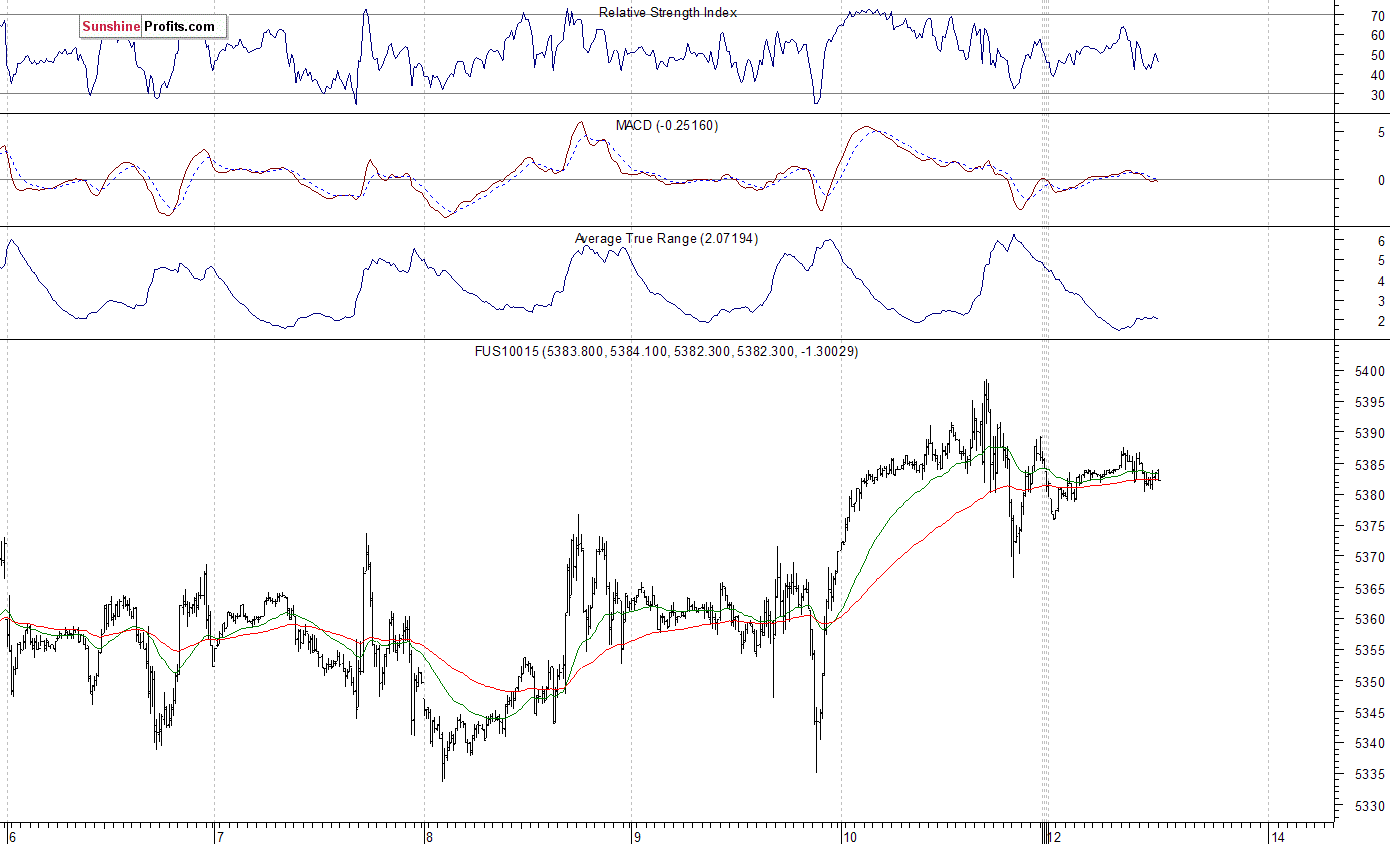
The technology Nasdaq 100 futures contract is relatively stronger than the broad stock market, as it currently trades close to new record high just below 5,440 mark. It has broken above its previous all-time high at around 5,400 yesterday. The market extends its eight-year-long bull-run. The nearest important level of support is at 5,400, marked by previous level of resistance. The next support level remains at 5,370, marked by some local lows, as the 15-minute chart shows:
Concluding, the broad stock market broke above its short-term consolidation yesterday, following Fed’s Rate Decision release. The S&P 500 index got close to its early March record high. Will the market resume its medium-term uptrend? There have been no confirmed negative signals so far. However, we still can see medium-term overbought conditions accompanied by negative technical divergences. Therefore, we continue to maintain our speculative short position (opened on February 15 at 2,335.58 – opening price of the S&P 500 index). Stop-loss level is at 2,410 and potential profit target is at 2,200 (S&P 500 index). You can trade S&P 500 index using futures contracts (S&P 500 futures contract – SP, E-mini S&P 500 futures contract – ES) or an ETF like the SPDR S&P 500 ETF – SPY. It is always important to set some exit price level in case some events cause the price to move in the unlikely direction. Having safety measures in place helps limit potential losses while letting the gains grow.
To summarize: short position in S&P 500 index is justified from the risk/reward perspective with the following entry prices, stop-loss orders and profit target price levels:
S&P 500 index – short position: profit target level: 2,200; stop-loss level: 2,410
S&P 500 futures contract (March) – short position: profit target level: 2,197; stop-loss level: 2,407
SPY ETF (SPDR S&P 500, not leveraged) – short position: profit target level: $220; stop-loss level: $241
SDS ETF (ProShares UltraShort S&P500, leveraged: -2x) – long position: profit target level: $15.47; stop-loss level: $12.98
Thank you.
Paul Rejczak
Stock Trading Strategist

 “Today’s headline refers to the fact that, really for the first time since the Trump rally began, it actually feels like the market may have achieved exhaustion.”
“I would at least bring up the point because if I’m right we will see some weakness, followed by a failing rally, followed by a whole lot of pain…”
‘Let’s Get Straight To the Points”
….read the entire article HERE
…also from King World:
James Turk – What Is Happening In The Gold & Silver Markets Right Now Is Extremely Rare

Briefly: In our opinion, speculative short positions are favored (with stop-loss at 2,410, and profit target at 2,200, S&P 500 index).
Our intraday outlook is bearish, and our short-term outlook is bearish. Our medium-term outlook remains neutral, following S&P 500 index breakout above last year’s all-time high:
Intraday outlook (next 24 hours): bearish
Short-term outlook (next 1-2 weeks): bearish
Medium-term outlook (next 1-3 months): neutral
Long-term outlook (next year): neutral
The main U.S. stock market indexes gained between 0.2% and 0.4% on Friday, retracing some of their recent move down, as investors reacted to better-than-expected monthly jobs data release, among others. The S&P 500 index has bounced off support level of 2,350 on Thursday. The broad stock market index remains relatively close to its all-time high of 2,400.98. The Dow Jones Industrial Average closed slightly above 20,900 mark on Friday, and the technology Nasdaq Composite index got closer to the level of 5,900 again. All three major stock market indexes continue to trade relatively close to their early March new record highs. The nearest important level of support of the S&P 500 index is at around 2,350-2,360, marked by previous short-term consolidation and the February 21 daily gap up of 2,351.16-2,354.91. The support level is also at around 2,320. On the other hand, the nearest important level of resistance is at around 2,380, marked by some short-term local highs, and the next resistance level is at 2,390-2,400, marked by all-time high. Will the market extend its year-long medium-term uptrend even further before some more meaningful downward correction? We can see some short-term volatility following four-month-long rally off last year’s November low at around 2,100. Is this a topping pattern before downward reversal? The uptrend accelerated on Wednesday, March 1 and it looked like a blow-off top pattern accompanied by some buying frenzy. The S&P 500 index continues to trade above its over year-long medium-term upward trend line, as we can see on the daily chart:
Expectations before the opening of today’s trading session are virtually flat, with index futures currently between -0.05% and 0.0%. The European stock market indexes have gained 0.1-0.2% so far. Investors will wait for Tomorrow’s and Wednesday’s economic data releases – consumer and producer inflation numbers, FOMC Interest Rate Decision. The S&P 500 futures contract trades within an intraday consolidation, as it fluctuates following its late last week’s rebound off support level. The nearest important level of resistance is at around 2,370-2,375, marked by short-term local highs. The next resistance level is at 2,390-2,400, marked by record high. On the other hand, level of support remains at 2,350-2,360, marked by short-term local lows, among others. The market continues to trade within a short-term consolidation following recent rally. There have been no confirmed negative signals so far. For now, it looks like relatively flat correction within an uptrend:
The technology Nasdaq 100 futures contract is relatively stronger than the broad stock market, as it currently trades close to record high at around 5,400 mark. It remains within an intraday consolidation following Friday’s advance. The market has bounced off support level of 5,330-5,340 on Thursday. The nearest important level of resistance is at 5,400, marked by all-time high. On the other hand, support level is at 5,370, marked by recent fluctuations, as the 15-minute chart shows:
Concluding, the broad stock market retraced some of its recent decline on Friday, as the S&P 500 continued its Thursday’s rebound. Expectations before the opening of today’s trading session are virtually flat, following Friday’s better-than-expected monthly jobs data release. Will the market resume its uptrend? There have been no confirmed negative signals so far. However, we still can see medium-term overbought conditions accompanied by negative technical divergences. Therefore, we continue to maintain our speculative short position (opened on Wednesday, February 15 at 2,335.58 – opening price of the S&P 500 index). Stop-loss level is at 2,410 and potential profit target is at 2,200 (S&P 500 index). You can trade S&P 500 index using futures contracts (S&P 500 futures contract – SP, E-mini S&P 500 futures contract – ES) or an ETF like the SPDR S&P 500 ETF – SPY. It is always important to set some exit price level in case some events cause the price to move in the unlikely direction. Having safety measures in place helps limit potential losses while letting the gains grow.
To summarize: short position in S&P 500 index is justified from the risk/reward perspective with the following entry prices, stop-loss orders and profit target price levels:
S&P 500 index – short position: profit target level: 2,200; stop-loss level: 2,410
S&P 500 futures contract (March) – short position: profit target level: 2,197; stop-loss level: 2,407
SPY ETF (SPDR S&P 500, not leveraged) – short position: profit target level: $220; stop-loss level: $241
SDS ETF (ProShares UltraShort S&P500, leveraged: -2x) – long position: profit target level: $15.47; stop-loss level: $12.98
Thank you.
 Following President Trump’s speech the Dow Jones Industrial Average (Dow) easily broke 21,000, and closed at another all-time high – 21,115.
The Dow closed up for the 12th consecutive day on Monday February 27, another three decade record.
Excel calculated the Dow’s daily Relative Strength Index (RSI – 14 period), a technical timing oscillator. It reached 97.75 (maximum = 100.00) on March 1, an exceptionally “over-bought” reading that has occurred nine times since 1950.
The weekly RSI also reached a very high “over-bought” reading as of March 3, the end of last week.
Margin debt recently registered an all-time high on the NY exchange. Price to earnings ratios have risen into “nosebleed” territory, and the last 1% correction in the S&P was in November – a long time ago. Many other market extremes and highs in confidence indexes are evident.
The Dow reached new highs the normal way – levitated through the creation of massive unpayable debt and the expectation of huge profits (for traders). Daily sentiment has reached a peak and indicates we are at or near a top. Read Bob Moriarty.
Official national debt is nearly $20 trillion. Regardless, President Trump promised something for everyone:
The Dow likes more debt, until reality strikes.
Previous Peaks in the Dow: (National debt in $ billions.)
Date Dow Official National Debt Ratio Dow to Debt
Jan. 1973 1,067 450 2.37
Aug. 1987 2,746 2,330 1.18
Jan. 2000 11,750 5,776 2.03
Oct. 2007 14,198 9,055 1.57
Mar. 2017 21,115 19,960 1.06
But it takes more debt to buy each Dow point than it did several decades ago. How much debt will be needed to levitate the Dow to 30,000? Will it require $40 trillion in debt? And what are the consequences of massively more debt? Stagflation is on the horizon.
Consequences of the spending problem according to Ron Paul:
“That leaves only one solution: printing money out of thin air.” [But] “printing money out of thin air destroys the currency, hastening a US economic collapse and placing a very cruel tax on the working and middle classes as well.”
His solution for US government policy:
“… end the US military empire overseas, cut taxes and regulations at home, end the welfare magnet for illegal immigration, and end the drug war. And then get out of the way.”

These ideas will encounter fierce resistance, so much that his plan is clearly “dead on arrival.”
More debt is guaranteed by a century of fiat currency devaluations, a borrow-and-spend congress, the executive branch, central banks that love debt, and an economy that runs on debt and credit. Expect continued dollar devaluation and more Dow highs after a nasty correction/crash.
While the Dow corrects and the U. S. economy struggles in a fiat currency induced coma, gold and silver prices will rise.
CONCLUSIONS:
Gary Christenson
The Deviant Investor
– I am expecting the market to drop into an intermediate low sometime soon.
– The robo ratio is slowly demonstrating that retail investors are becoming more bullish.
– Investors must only buy quality (or stay in cash) with the market trading at all-time highs.
There probably only is a remote possibility that the S&P 500 (NYSE:SPX) topped out as 2,395 on the 1st of March last week as equities, in my opinion, will remain elevated until the FOMC meeting.

I know Mike is a very solid investor and respect his opinions very much. So if he says pay attention to this or that - I will.
~ Dale G.
I've started managing my own investments so view Michael's site as a one-stop shop from which to get information and perspectives.
~ Dave E.
Michael offers easy reading, honest, common sense information that anyone can use in a practical manner.
~ der_al.
A sane voice in a scrambled investment world.
~ Ed R.

Greg Weldon

Josef Schachter

Tyler Bollhorn

Ryan Irvine

Paul Beattie

Martin Straith

Patrick Ceresna

Mark Leibovit

James Thorne

Victor Adair