
Stocks & Equities
Originally sent to subscribers on March 6, 2017, 6:56 AM.
Briefly: In our opinion, speculative short positions are favored (with stop-loss at 2,410, and profit target at 2,200, S&P 500 index).
Our intraday outlook is bearish, and our short-term outlook is bearish. Our medium-term outlook remains neutral, following S&P 500 index breakout above last year’s all-time high:
Intraday outlook (next 24 hours): bearish
Short-term outlook (next 1-2 weeks): bearish
Medium-term outlook (next 1-3 months): neutral
Long-term outlook (next year): neutral
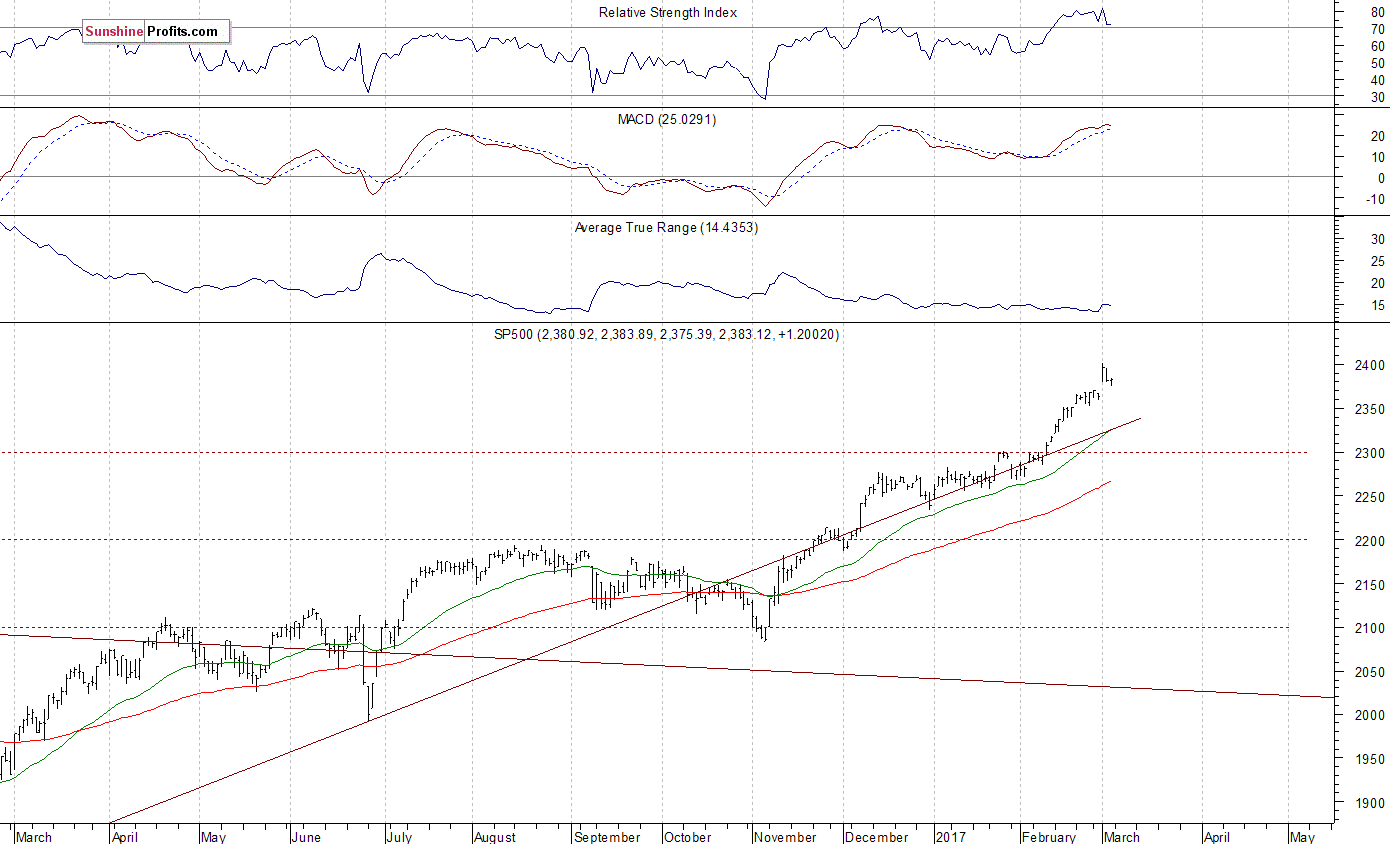
The U.S. stock market indexes were mixed between 0.0% and +0.2% on Friday, as they extended their short-term consolidation following Wednesday’s rally after Donald Trump’s address to Congress. The S&P 500 index remained relatively close to its new all-time high of 2,400.98. The Dow Jones Industrial Average continued to trade along 21,000 mark on Friday, and the technology Nasdaq Composite index remained close to the level of 5,900. All three major stock market indexes continue to trade close to their new record highs. The nearest important level of support of the S&P 500 index is at around 2,365-2,380, marked by Wednesday’s daily gap up of 2,367.79-2,380.13. The next support level is at 2,350-2,355, marked by previous daily gap up of 2,351.16-2,354.91. The support level is also at around 2,320. On the other hand, the nearest important level of resistance is at 2,390-2,400, marked by all-time high. Will the market extend its year-long medium-term uptrend even further before some more meaningful downward correction? We can see some short-term volatility following almost four-month-long rally off last year’s November low at around 2,100. Is this a topping pattern before downward reversal? The uptrend accelerated on Wednesday, and it looked like a blow-off top pattern accompanied by some buying frenzy. The S&P 500 index continues to trade above its medium-term upward trend line, as we can see on the daily chart:
Expectations before the opening of today’s trading session are slightly negative, with index futures currently down 0.1-0.2%. The European stock market indexes have lost 0.3-0.4% so far. Investors will now wait for the Factory Orders number release at 10:00 a.m. The market expects that it grew 1.0% in January. The S&P 500 futures contract trades within an intraday uptrend, following an overnight move down. The nearest important level of resistance is at around 2,380-2,385, marked by some short-term local highs. On the other hand, support level is at 2,365-2,370, marked by local low and previous resistance level. The market slightly extended its short-term move down following last week’s rally. Is this a new downtrend or just quick downward correction before another leg up?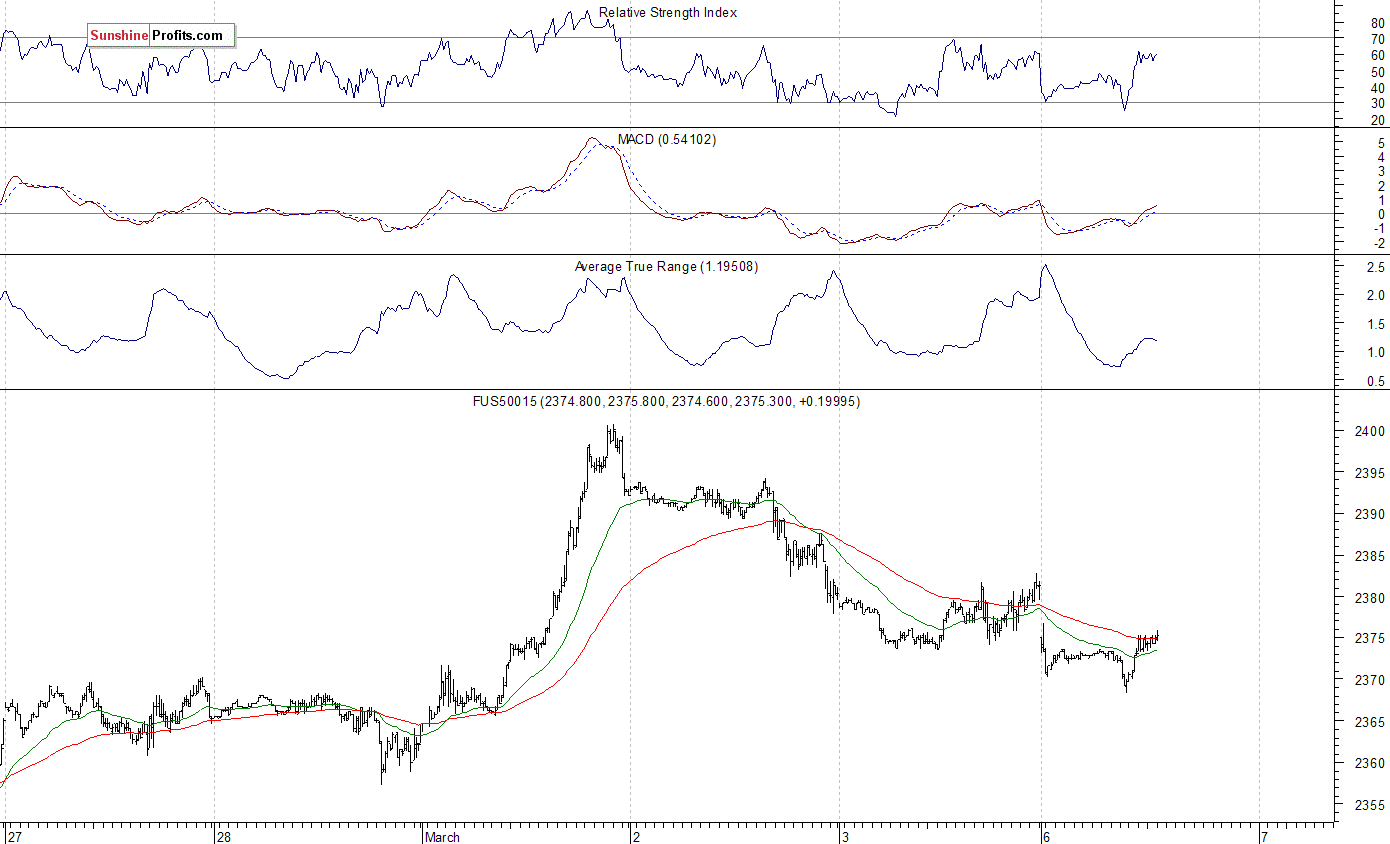
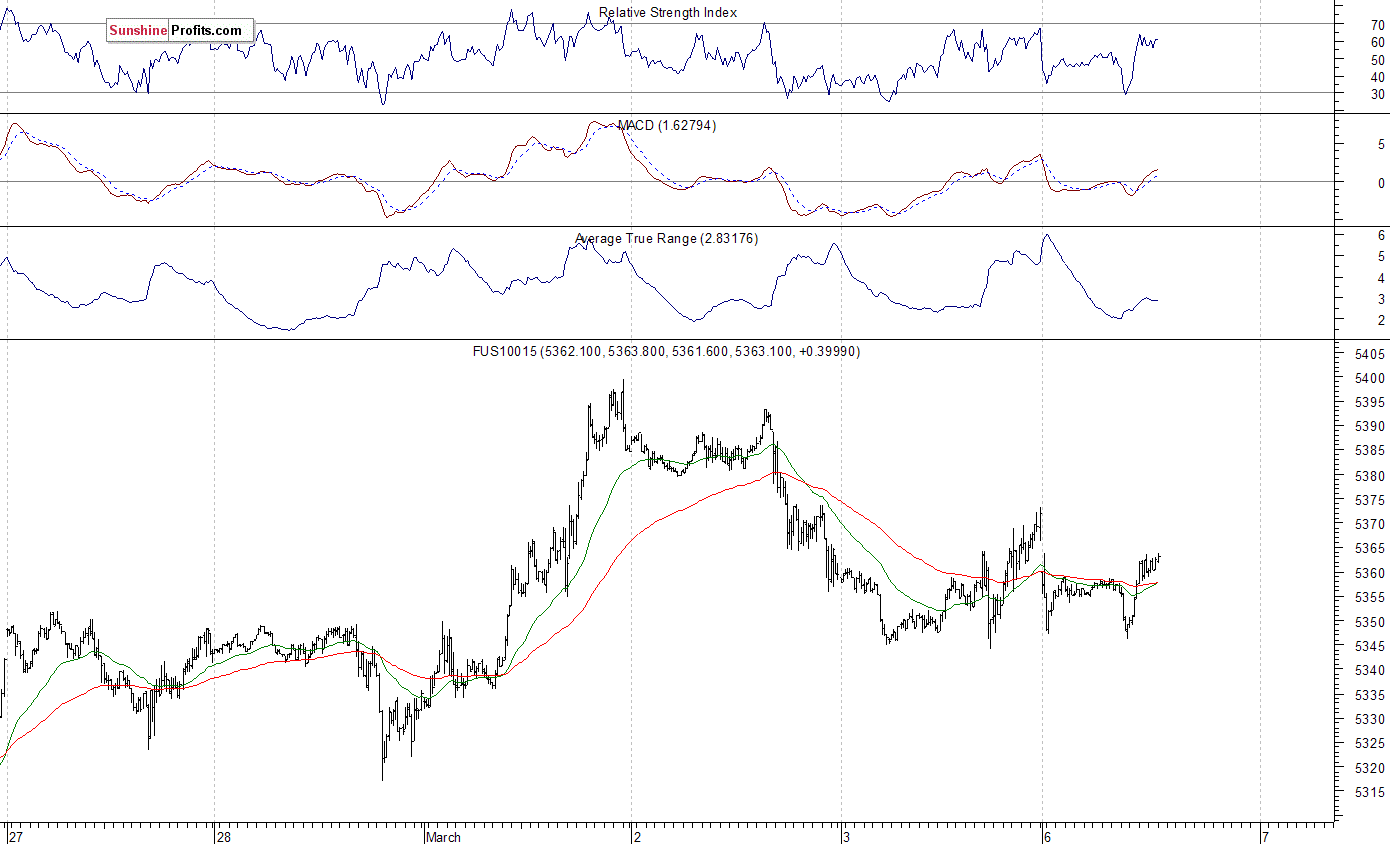
The technology Nasdaq 100 futures contract follows a similar path, as it currently trades within an intraday uptrend after an overnight decline. It has retraced most of its Wednesday’s rally to new record high at around 5,400. The nearest important support level is at around 5,340-5,350, marked by local lows and previous level of resistance, and the next level of support remains at 5,280-5,300. On the other hand, resistance level is at 5,380-5,400. The futures contract trades within a short-term consolidation, as the 15-minute chart shows:
Concluding, the broad stock market retraced some of its Wednesday’s move up on Thursday and Friday, as the S&P 500 index bounced off resistance level at 2,400 mark. For now, it looks like a downward correction within an uptrend. But will the uptrend continue even further despite some clear short-term overbought conditions? Or is this a topping pattern before some more meaningful downward correction? There have been no confirmed negative signals so far. However, we still can see medium-term overbought conditions accompanied by negative technical divergences. Therefore, we continue to maintain our speculative short position (opened on Wednesday, February 15 at 2,335.58 – opening price of the S&P 500 index). Stop-loss level is at 2,410 and potential profit target is at 2,200 (S&P 500 index). You can trade S&P 500 index using futures contracts (S&P 500 futures contract – SP, E-mini S&P 500 futures contract – ES) or an ETF like the SPDR S&P 500 ETF – SPY. It is always important to set some exit price level in case some events cause the price to move in the unlikely direction. Having safety measures in place helps limit potential losses while letting the gains grow.
To summarize: short position in S&P 500 index is justified from the risk/reward perspective with the following entry prices, stop-loss orders and profit target price levels:
S&P 500 index – short position: profit target level: 2,200; stop-loss level: 2,410
S&P 500 futures contract (March) – short position: profit target level: 2,197; stop-loss level: 2,407
SPY ETF (SPDR S&P 500, not leveraged) – short position: profit target level: $220; stop-loss level: $241
SDS ETF (ProShares UltraShort S&P500, leveraged: -2x) – long position: profit target level: $15.47; stop-loss level: $12.98
Thank you.
Paul Rejczak

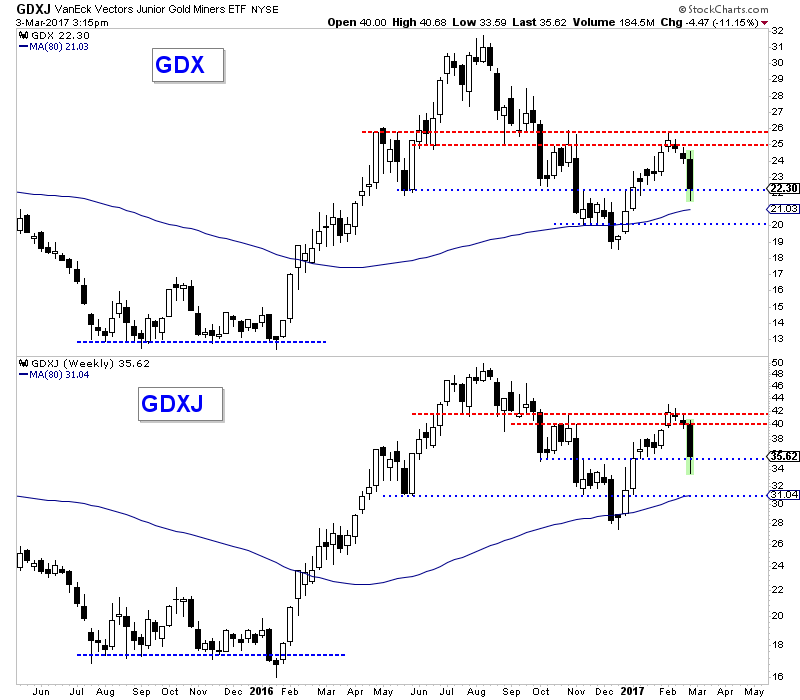
While we expected the gold stocks to correct and test GDX $22 and GDXJ $35, we did not expect it to happen so quickly. It literally took only three days! Gold stocks rebounded on Friday and managed to close the week above those key levels. While gold stocks could bounce or consolidate for a few days, we would advise patience as lower levels could be tested as spring begins.
The weekly candle charts of GDX and GDXJ are shown below along with their 80-week moving average. For the entire week, GDX and GDXJ declined 8% and nearly 12% respectively. Although miners recovered Friday, the weekly candles signal the kind of selling pressure that do not exactly mark “higher lows” within an uptrend. In other words, while miners could recover for a few days or even a week or two, I would expect lower levels to be tested. That essentially includes the 80-week moving averages and the December lows.
GDX & GDXJ Weekly
In order to get a sense for the strong support levels, I use a daily line chart which helps to smooth out the volatility. The miners essentially have two points of strong support. The first is a wide area that includes $20-$21 for GDX as well as $31-$32 for GDXJ. That target area includes the 400-day moving average for both GDX and GDXJ. If that target area fails to hold for a few days or even a week then look for strong support at the December lows.
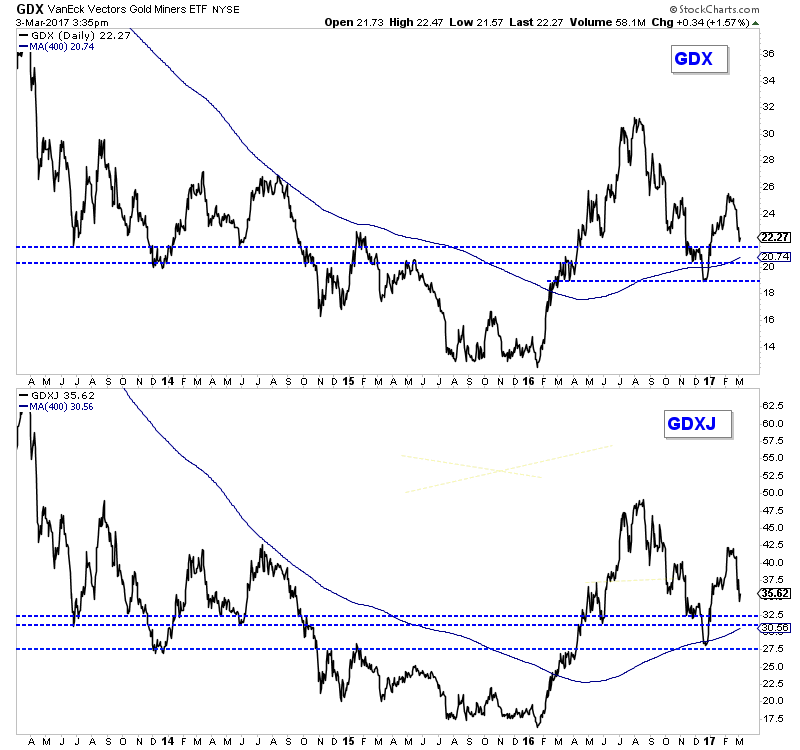
GDX & GDXJ
In short, the next quality buying opportunity figures to be at a retest of the 400-day moving average or perhaps a retest of the December lows. A weekly close above GDX $25 and GDXJ $40 would invalidate our cautious view. We expect the next several months could be a grind as the sector oscillates between support and resistance. It’s hard to do but the way to play that is to buy weakness and avoid chasing strength.
Jordan Roy-Byrne, CMT, MFTA
Jordan@TheDailyGold.com – For professional guidance in riding this new bull market, consider learning more about our premium service including our current favorite junior miners.

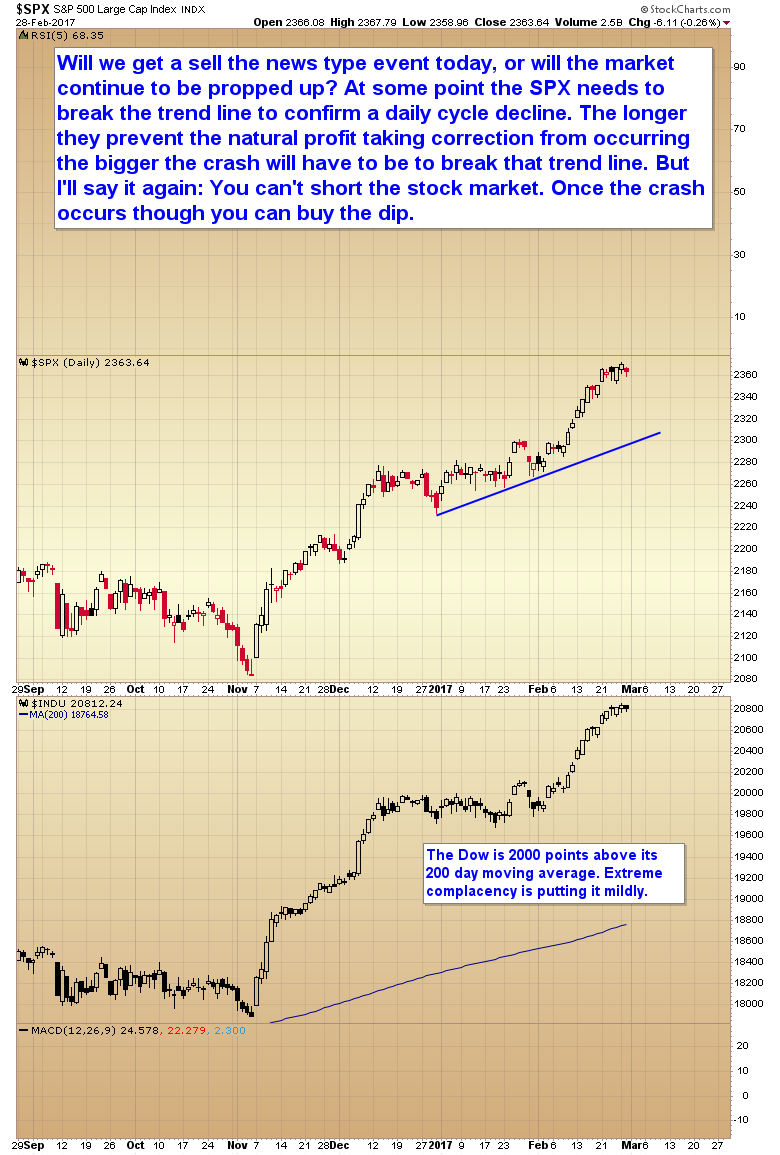
At some point the stock market needs to break the price trend line to confirm a daily cycle decline. The longer they prevent the natural profit taking correction from occurring the bigger the crash will have to be to break that trend line.
Short term Elliott wave view in SPX suggests that the rally from 1/23 low is unfolding as a 5 waves Elliott wave impulse structure where Minor wave 1 ended at 2301, Minor wave 2 ended at 2267.2, and Minor wave 3 remains in progress but close to ending.
Internal of Minor wave 3 shows an extension and subdivided also as an impulse structure where Minute wave ((i)) ended at 2289.1, Minute wave ((ii)) ended at 2271.6, Minute wave ((iii)) ended at 2368.2 and Minute wave ((iv)) ended at 2352.6.
Index has broken above the previous peak at 2368.2 suggesting Index is likely already in wave ((v)) of 3 towards minimum extension area of inverse 123.6-161.8% fib ext area of proposed wave ((iv)) at 2372-2378.
Once wave 3 is complete, index should do a 3 waves pullback to correct the cycle from 2267.2 in Minor wave 4 before the rally resumes in Minor wave 5. We don’t like selling the Index and expect buyers to appear again after Minor wave 4 pullback is complete in 3, 7, or 11 swing.
SPX 1 hour chart

Elliott Wave Degree

At Elliottwave-Forecast, we offer 24 hour coverage of 52 instruments from Monday – Friday using Elliott Wave Theory as primary tools of analysis. We provide Elliott Wave chart in 4 different time frames, up to 4 times a day update in 1 hour chart, two live sessions by our expert analysts, 24 hour chat room moderated by our expert analysts, market overview, and much more! With our expert team at your side to provide you with all the timely and accurate analysis, you will never be left in the dark and you can concentrate more on the actual trading and making profits. Check out our 14 day Trial to sample everything we have to offer.
 In this week’s issue:
- Weekly Commentary
- Strategy of the Week
- Stocks That Meet The Featured Strategy
- Stockscores’ Market Minutes Video – Why Winning Traders Win Stockscores Trader Training
- 7 Reasons to Say No to the Trade
- Stock Features of the Week – Abnormal Breaks US

Stockscores Market Minutes – Why Winning Traders Win
Seemingly minor differences exist between what winning and losing traders do. This week, I discuss one of these simple differences that came make a massive difference in your trading success. Plus, my weekly market analysis and trade of the week on TV. Click Here to Watch
To get instant updates when I upload a new video, subscribe to the Stockscores YouTube Channel
Trader Training – 7 Reason to Say No to the Trade
As investors, our natural inclination is to seek out stocks that have good qualities. We look for reasons to buy the stocks we are considering and often forget to look for the negatives. Since there are thousands of stocks to consider and almost all of them can have some reason for buying them, it may be better to reverse how we approach the analysis of stocks. Looking for reasons not to buy a stock will emphasize a higher standard for the stocks you do buy and will help to improve your overall market performance.
Here is a list of common reasons I use to throw a stock out of consideration:
Too Much Volatility
Volatility is uncertainty. Virtually every good chart pattern that I use to find winners demonstrates a break out from low volatility. The narrower the range before the breakout, the more important the breakout becomes. If the stock’s price is moving all over the place before it makes a break through resistance then there is a much greater chance that the breakout is false and will likely fall back. Ignore stocks that have a lot of price volatility before the break out.
Not Enough Reward for the Risk
A stock can go two ways, up or down, after you buy it. If the upside potential is not enough to justify the downside risk, then you should ignore the opportunity. I like stocks to have at least double the upside potential for the downside risk. That way, you don’t have to be right even half of the time to make money, provided you are disciplined of course.
Lack of Optimism
Fundamentals do not matter. It is the perception of Fundamentals that matter. If investors are not showing some optimism about a company’s prospects then it is likely that they are not paying any attention to the company’s fundamentals. Look for rising bottoms on the chart as an indication that investors are optimistic, if there aren’t any, leave the stock alone.
No Abnormal Behavior
The stock market is efficient most of the time. That means that you can not expect to consistently beat the stock market because all available information is priced in to the stock and your success at predicting new information can only be random. To beat the market, we have to look for break downs in market efficiency. I find that the best way to do this is look for abnormal behavior in the trading of a stock because it implies that there is significant new information playing a role in the stock’s performance. I don’t consider any stock that lacks abnormal behavior in its recent trading.
Too Far Up
The higher a stock goes, the riskier it becomes. I don’t like to chase stocks higher. If I look at a 6 month chart of a stock and it has made more than two steps up, I don’t consider it. A one day run of substantial gains is not a concern; I want to ignore stocks that have been in upward trends for some time. Look for stocks that are breaking from periods of sideways trading, not up trends.
Lack of Liquidity
The more often a stock trades, the easier it is to get in and out of it. Stocks that are not actively traded tend to have wider spreads between their bids and asks and it can be difficult to move in and out of the stock. Don’t consider stocks that don’t trade every day and they should trade at least 50 times a day but more is better.
Mixed Messages
I always try to look at a stock’s chart on more than one time frame. If the message is not the same on both charts, I leave them alone. When day trading, look at the daily and intraday charts. When position trading, look at the daily and weekly charts.
Any time you think a stock has great potential, give this list a look and see if any of these factors show up. If so, it may be a good idea to move on and look for something else.

This week, I ran the Abnormal Breaks US Market Scan strategy in search of US listed stocks that are breaking from good chart patterns on the daily and weekly time frames. Here are three names that stand out for position trades:

1. IMGN
IMGN made a big upside break with strong volume today, moving up from a rising bottom after breaking the downward trend line in late December. Support at $2.45.
2. AIMT
AIMT breaks the downward trend line from a rising bottom with good volume supporting the strong price action. Support at $19.40.
3. BLD
BLD is breaking out of a cup and handle pattern on the daily with strong price and volume action. Support at $37.95.
References
- Get the Stockscore on any of over 20,000 North American stocks.
- Background on the theories used by Stockscores.
- Strategies that can help you find new opportunities.
- Scan the market using extensive filter criteria.
- Build a portfolio of stocks and view a slide show of their charts.
- See which sectors are leading the market, and their components.
Disclaimer
This is not an investment advisory, and should not be used to make investment decisions. Information in Stockscores Perspectives is often opinionated and should be considered for information purposes only. No stock exchange anywhere has approved or disapproved of the information contained herein. There is no express or implied solicitation to buy or sell securities. The writers and editors of Perspectives may have positions in the stocks discussed above and may trade in the stocks mentioned. Don’t consider buying or selling any stock without conducting your own due diligence.

-
I know Mike is a very solid investor and respect his opinions very much. So if he says pay attention to this or that - I will.
~ Dale G.
-
I've started managing my own investments so view Michael's site as a one-stop shop from which to get information and perspectives.
~ Dave E.
-
Michael offers easy reading, honest, common sense information that anyone can use in a practical manner.
~ der_al.
-
A sane voice in a scrambled investment world.
~ Ed R.
Inside Edge Pro Contributors

Greg Weldon

Josef Schachter

Tyler Bollhorn

Ryan Irvine

Paul Beattie

Martin Straith

Patrick Ceresna

Mark Leibovit

James Thorne

Victor Adair