Stocks & Equities

Good Time to Take Profits

Market Summary

The Dow extending its streak of record-setting gains to 11 days, the longest such streak since 1987, as increases in utilities and other safety plays outweighed declines in financials. Both the S&P 500 and the Nasdaq rose for a fifth straight week, while the Dow brought its string of weekly gains to three. As seen in the chart below, since the presidential election the major stock indexes have been on a tear. The only major asset classes to fall during this time are precious metals and bonds which are being adversely impacted by the threat of higher interest rates.

43786 a

A standard chart that we use to help confirm the overall market trend is the Momentum Factor ETF (MTUM) chart. Momentum Factor ETF is an investment that seeks to track the investment results of an index composed of U.S. large- and mid-capitalization stocks exhibiting relatively higher price momentum. This type of momentum fund is considered a reliable proxy for the overall stock market trend. We prefer to use the Heikin-Ashi format to display the Momentum Factor ETF. Heikin-Ashi candlestick charts are designed to filter out volatility in an effort to better capture the true trend. The updated chart below maps the aggressive bullish surge. However, now we are starting to see the first technical signs indicating a possible pullback since the so-called Trump rally started. Overbought markets like the current situation can continue indefinitely, but now stock prices are converging into a tight range near resistance levels. Also, momentum levels are starting to turn down.

MTUM Daily Chart

In the chart below the dollar has stalled a bit following remarks by Trump, who once said that the dollar was “too strong,” stoking speculation that his administration might abandon the longstanding “strong dollar” policy. Gold settled higher last week, logging its highest finish in more than three-and-half months, and for a fourth straight week of gains, as the metals complex was boosted by a softer dollar. Treasury bonds recovered last week, beginning after the release of minutes from the Federal Reserve’s latest policy meeting. In the minutes, Fed officials sounded somewhat more reluctant to raise interest rates than in recent remarks from Fed Chairwoman Janet Yellen and a bevy of other Fed officials.

UUP, Gold and T-Bonds Daily Chart

Market Outlook

Jeff Hirsch in the Almanac Trader mentions how tempestuous March markets tend to drive prices up early in the month and batter stocks at month end. Julius Caesar failed to heed the famous warning to “beware the Ides of March” but investors have been served well when they have. Stock prices have a propensity to decline, sometimes rather precipitously, during the latter days of the month. March is the end of the first quarter, which brings with it Triple Witching and an abundance of portfolio maneuvers from The Street. March Triple-Witching Weeks have been quite bullish in recent years, DJIA up 9 of the last 11. But the week after is the exact opposite, DJIA down 19 of the last 29 years—and frequently down sharply for an average drop of 0.5%. The updated graph below displays first quarter performance for the major asset classes. After plunging at years-end you can see that gold has staged a dramatic comeback as a hedge against inflation and uncertainty about global reactions to Trump social-economic policies. The Nasdaq is the next best performer which has been the market leader since early last year. We look for the leaders to perform well to provide evidence of market strength.

YTD Performance

The CBOE Volatility Index (VIX) is known as the market’s “fear gauge” because it tracks the expected volatility priced into short-term S&P 500 Index options. When stocks stumble, the uptick in volatility and the demand for index put options tends to drive up the price of options premiums and sends the VIX higher. In the daily chart below the Volatility Index crashes to its lowest levels as the S&P 500 continues making a series of all-time highs.

VIX and S&P500 daily Charts

The American Association of Individual Investors (AAII) Sentiment Survey measures the percentage of individual investors who are bullish, bearish, and neutral on the stock market for the next six months; individuals are polled from the ranks of the AAII membership on a weekly basis. The current survey result is for the week ending 02/22/2017. Optimism among individual investors about the short-term direction of the stock market is at a six-week high, according to the latest AAII Sentiment Survey. The rebound is occurring as neutral sentiment is at a seven-week low. Bullish sentiment, expectations that stock prices will rise over the next six months is at 38.5%. Optimism was last higher on January 11, 2017 (43.6%). The rise puts bullish sentiment even with its historical average of 38.5%. Though bullish sentiment had been below average over the five previous weeks, it was never unusually low. Rather, optimism had merely fluctuated within the lower half of its typical range before rebounding to back to its historical average this week. Neutral sentiment, expectations that stock prices will stay essentially unchanged over the next six months, fell to 29.2%. Neutral sentiment was last lower on January 4, 2017 (28.6%). The historical average is 31.0%. Bearish sentiment, expectations that stock prices will fall over the next six months, is 32.30%, pessimism remains above its historical average of 30.5% for the fifth time in six weeks. This week’s rebound in optimism comes as both large- and small-cap stocks rose to new record highs.

AAII Sentiment

The National Association of Active Investment Managers (NAAIM) Exposure Index represents the average exposure to US Equity markets reported by NAAIM members. The blue bars depict a two-week moving average of the NAAIM managers’ responses. As the name indicates, the NAAIM Exposure Index provides insight into the actual adjustments active risk managers have made to client accounts over the past two weeks. The current survey result is for the week ending 02/22/2017. Fourth-quarter NAAIM exposure index averaged 84.15%. Last week the NAAIM exposure index was 95.89%, and the current week’s exposure is 100.83%. The NAAIM Exposure Index rises to extremely elevated levels as the equity indexes keep continue making all-time highs. Sellers have virtually disappeared as earnings season winds down and it is reasonable to expect NAAIM exposure to remain high.

NAAIM Exposure Percent

Trading Strategy

Not all investors are sold on the Trump rally, however with some worrying about valuations or a forthcoming pullback. The potential impact that President Trump could have on the domestic and global economy continues to cause uncertainty or concern among some investors, though encouraging others. Also influencing investor sentiment are earnings, consumer sentiment and the magnitude and timing of future interest rate increases. At such frothy levels a smart move is to consider taking some profits from the recent run up or at least hedging long bullish positions. In the near term we don’t fight the trend which is our friend. Every pullback or pause should be considered an opportunity to load up on shares from your target stock list. In the graph below, cyclical stocks are the leading sectors with the Energy group being the only loser.

S&P Sector ETFs 30-Day Performance

Feel free to contact me with questions @ TheOptionPlayer.com

5 Charts That Show 2017 Could Be a Banner Year for Retailers

cartoon-retailers-money-02-2017

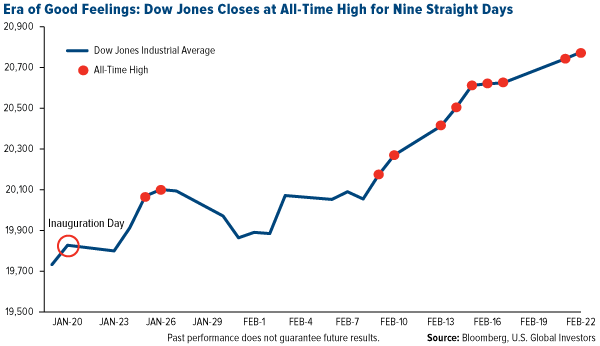
Thursday morning, Treasury Secretary Steven Mnuchin told CNBC that we could expect “significant” tax reform by August, including tax cuts for middle-income Americans and corporations. Like clockwork, the major stock indices rallied to all-time highs in intraday trading. As of yesterday, the Dow Jones Industrial Average has closed at record highs for the past nine days, and it wouldn’t surprise me if this gets stretched out to 10 days—or longer.

Era of Good Feelings: Dow Jones closes at all-time high for nine straight days
click to enlarge

Investors aren’t the only ones jumping on the couch with joy, however. American consumers are expressing levels of confidence we haven’t seen in years, suggesting 2017 could be a banner year for retailers, who already saw a phenomenal year-over-year sales increase of 5.6 percent in January. This, of course, bodes well for the U.S. economy going forward, as consumer spending makes up an estimated 70 percent of the country’s economic activity.

Beside a host of positive economic data—low unemployment, strong household income growth—recent consumer polls and surveys show Americans feel confident about their financial prospects in the coming year and are ready to start splurging.

Consumer Exuberance at 13-Year High

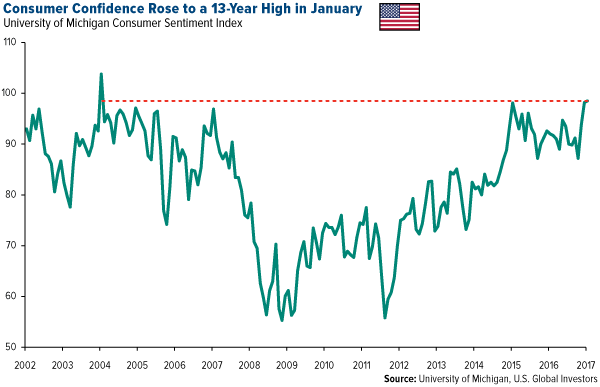
The closely watched University of Michigan Consumer Sentiment Index raced up to a 13-year high in January, posting a final reading of 98.5. There’s little doubt that much of this exuberance stemmed from President Donald Trump’s pledges to cut and simplify taxes and deregulate businesses. Although the index cooled to 95.7 in February, this still bodes very well for retailers.

Consumer Confidence Rose to a 13-Year High in January
click to enlarge

On Surer Financial Footing

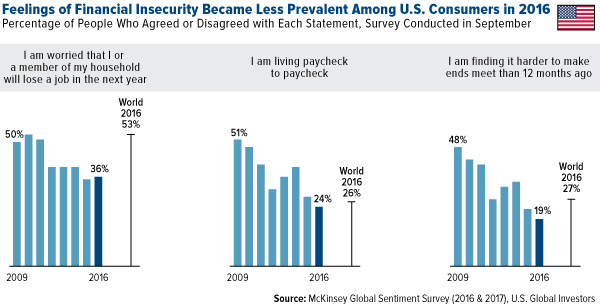
According to McKinsey & Company’s recent Consumer Sentiment Survey, conducted online in September, more American consumers expressed feelings of stronger financial security than at any time in the past eight years. When asked if they were living paycheck to paycheck, for instance, less than a quarter said yes, compared to more than half of respondents who answered in the affirmative in 2009. In addition, fewer U.S. consumers said they were using money-saving strategies such as using coupons and loyalty cards or waiting for a sale before making a big-ticket purchase.  

Consumer Confidence Rose to a 13-Year High in January
click to enlarge

U.S. Among the Most Confident Countries

In the fourth quarter of 2016, American consumers were the world’s third-most confident consumers, according to Nielsen’s just-released Consumer Confidence Report. The country moved up an amazing 17 points during the three-month period, the most of any country in the 63-country survey. It was also one of only two countries representing Europe or the Americas to appear in the top 10, the other being Demark at number nine. By all measures, Americans were optimistic about the coming year. Six in 10 said now was a good time to buy the things they wanted, and intentions to spend on vacations rose 11 percent. Meanwhile, recessionary fears dropped dramatically.

Top 10 Most Optimistic Countries in Global Consumer Confidence Survey
Q4 2016
Score Country Change from Previous Quarter
136 India +3
132 Philippines 0
123 United States +17
120 Indonesia -2
112 Vietnam +5
110 Thailand +2
108 United Arab Emirates 0
108 China +2
107 Denmark 0
106 Pakistan +5

Before moving on, I must say that it’s incredible to see India retain the number one spot for the eighth consecutive quarter, despite the effects of Prime Minister Narendra Modi’s demonetization scheme in November.

Strong Retail Sales Expected… With a Caveat

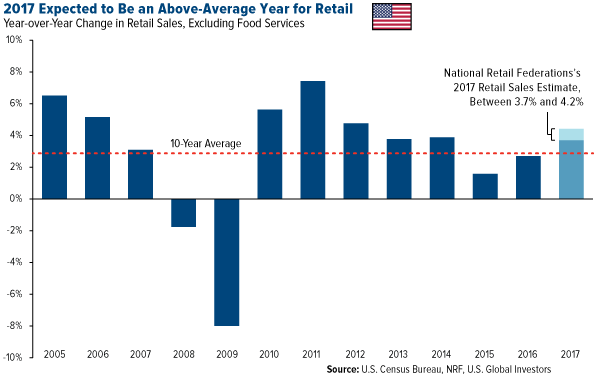
All of this renewed optimism will translate, hopefully, into stronger retail sales. The National Retail Federation (NRF) projected 2017 sales, excluding automobiles, fuel and restaurants, to grow between 3.7 percent and 4.2 percent from 2016. This would put growth above the 10-year average of 2.9 percent and make it the best year since 2012.

Consumer Confidence Rose to a 13-Year High in January
click to enlarge

The NRF tempered this enthusiasm, however, by pointing out the risks of Trump’s protectionist agenda, writing that “lawmakers should take note and stand firm against any policies, rules or regulations that would increase the cost of everyday goods for American consumers.”

This attitude was echoed by Walmart CFO Brett Biggs, who told reporters this week that he was most concerned about Trump and House Republicans’ plan for a border adjustment tax.

“Clearly anything that would potentially raise prices for our customers in the U.S. is a concern for us,” Biggs said, according to Business Insider.  

This week, Trump met with eight retail CEOs, whose companies represent a combined $270 billion in sales in 2016. Two of these CEOs in particular, Target’s Brian Cornell and Best Buy’s Hubert Joly, voiced their strong opposition to a border tax, as it could significantly raise prices and dampen consumers’ feel-good mood.

With that said, I hope President Trump will make the right decision for American businesses and consumers, with respect to trade. Enthusiasm right now seems to be riding predominantly on tax reform and deregulation, and it’s at risk of being derailed by higher taxes at the border.

All opinions expressed and data provided are subject to change without notice. Some of these opinions may not be appropriate to every investor. By clicking the link(s) above, you will be directed to a third-party website(s). U.S. Global Investors does not endorse all information supplied by this/these website(s) and is not responsible for its/their content.

The Dow Jones Industrial Average is a price-weighted average of 30 blue chip stocks that are generally leaders in their industry.

The University of Michigan Confidence Index is a survey of consumer confidence conducted by the University of Michigan.  The report, released on the tenth of each month, gives a snapshot of whether or not consumers are willing to spend money.

The online Consumer Sentiment Survey was in the field from September 3 to 27, 2015, and garnered responses from at least 1,000 consumers in each of 21 countries, plus another 1,000 consumers across the Middle East and 250 consumers in Taiwan. Because the survey was administered online, the sample largely reflects the characteristics of the typical online population—younger, urban, and more affluent.

The Nielsen Global Consumer Confidence Survey is an online survey of more than 30,000 respondents across countries in Africa, Asia-Pacific, Europe, Latin America, the Middle East and North America. It uses age and gender quotas to ensure the results are representative of Internet users. Scores above 100 indicate optimism.

Holdings may change daily. Holdings are reported as of the most recent quarter-end. None of the securities mentioned in the article were held by any accounts managed by U.S. Global Investors as of 12/31/2016.

Barrons: Ominous Warning From Michael Belkin May Foreshadow A Stock Market Collapse

King-World-News-We-Just-Witnessed-Something-Not-Seen-Since-The-2008-Collapse-864x400 cBarrons has interviewed Michael Belkin, the man who counsels the largest sovereign wealth funds, hedge funds, pension funds, and institutional money in the world, and his warning may foreshadow a stock market collapse.

For a portion of the interview from Barrons go HERE


….related: 

Stock Market Crash 2017; reality or all Hype

Big Bases : Big Moves in the World Stock Markets

Before we look at some of the 2009 bull market uptrend channels there are a couple of more big consolidation patterns I would like to show you on some of the stock market indexes. The $DAX, German stock market, broke out of its 13 year triangle consolidation pattern back in 2012. Late last year it broke out of the blue bull flag with a nice clean backtest to the top rail. The big triangle consolidation pattern also had a smaller triangle as part of its internal structure.

dax-1-768x912


…continue reading this remarkable examination of stock markets HERE


Investing in Life Sciences Under the Trump Presidency

crystalballgraph580Stocks in all areas of life sciences including biotech to pharma have been on a roller coaster since Donald Trump won the election in November. Wealth advisor Kristin McFarland discusses the big picture for pharmaceutical investment under the new administration.

As of February, a great deal of uncertainty still remains as firms—and the stock market—try to predict the Trump administration’s next moves. There is a lot on the table right now that could work for—or against—life sciences companies, specifically pharmaceuticals. 

What does the future hold for pharmaceuticals under President Trump?

This is the billion dollar question that no one really knows the answer to. The president hasn’t announced anything yet but based on what we do know, changes could be good for the pharmaceutical industry, bad, or leave things mostly unchanged. 

Here’s a quick summary:

– President Trump was not as outspoken about his plans to reduce prescription prices as Mrs. Clinton was but he has remarked that something needs to be done about the prices of medications

 – The president would like to see a streamlined FDA approval process and favors an overall reduction in regulations 

– Mr. Trump also ran on the desire to lower the tax rate, specifically on businesses

– Mr. Trump has mentioned the possibility of allowing Americans to import lower cost drugs from outside the U.S.

– President Trump’s recent travel ban could impact the ability and desire for scientists in the international community to come to U.S.

– Any plans regarding prescription drug prices for consumers will likely be heavily tied to Mr. Trump’s proposal to replace the Affordable Care Act (“Obamacare”) 

Of course these points would still be subject to approval and implementation, but it does leave a lot of uncertainty—and markets tend to dislike uncertainty. 

The same rules still apply

We do know the new administration plans to shake things up. Whatever changes are to come may be beyond the control of the average citizen, but keep in mind there are still plenty of things you cancontrol.

1. Evaluate in neutral terms: Regardless of any personal feelings you may have either for or against the new president, it is critical to be as impartial as possible when deciding how to manage your investments. Allowing personal feelings about how the administration may help or harm the economy can be a slippery slope. 

2. Focus on the long term: Recall the basic principles of a diversified long-term investment strategy: the market is sure to go up and down as it reacts to short term headlines—expect it—and stay the course. Often the worst thing investors can do is react to market volatility by selling low and reentering when prices are high. 

3. Diversify, diversify, diversify—the best way to mitigate your risk is to have a diversified portfolio of investments across industries, geographies, and asset classes. This especially includes equity based compensation. Individuals often hold too much equity in their employer’s stock which can have devastating consequences if not managed properly. 

Managing your investments

Stop and consider any changes before you increase or decrease your investment. Buying more equity or retaining shares you would have otherwise liquidated for cash based on what you expect to happen in the industry is a lot like stock picking or active management. It has been well documented that these approaches are largely unsuccessful. According to S&P Indices Versus Active (SPIVA®), over the past 10 years, 82% of actively managed large-cap funds have failed to outperform their benchmark. Mid and small-cap managers have had even more difficulty outperforming their benchmark; over the same 10-year period 88% of managers have failed in this regard. 

Industries with a lot of M&A activity may have more risk

There is a lot of movement in life sciences. Staff will come and go as drugs are approved, denied, R&D expands or contracts, and companies are often acquired. There are a number of ways a company’s stock could be treated after an acquisition. Shares may be given a new valuation based on the terms of the deal and cashed out, or converted to shares of the new company’s stock, or perhaps even left unchanged. Price fluctuations are common as the market weighs in on the deal. 

Related Articles

Kristin McFarland, CFP®, MBA, is a wealth advisor at Darrow Wealth Management, an SEC registered investment advisor in Massachusetts. The material contained in this article is for general information only and should not be construed as the rendering of personalized investment, legal, accounting or tax advice. If you would like to discuss your personal situation, please contact McFarland directly.

Want to read more Life Sciences Report articles like this? Sign up for our free e-newsletter, and you’ll learn when new articles have been published. To see recent articles and interviews with industry analysts and commentators, visit our Streetwise Interviews page.