
Stocks & Equities
Sent to subscribers on February 16, 2017, 6:55 AM.
Briefly: In our opinion, speculative short positions are favored (with stop-loss at 2,410, and profit target at 2,200, S&P 500 index).
Our intraday outlook is now bearish, and our short-term outlook is bearish. Our medium-term outlook remains neutral, following S&P 500 index breakout above last year’s all-time high:
Intraday outlook (next 24 hours): bearish
Short-term outlook (next 1-2 weeks): bearish
Medium-term outlook (next 1-3 months): neutral
Long-term outlook (next year): neutral
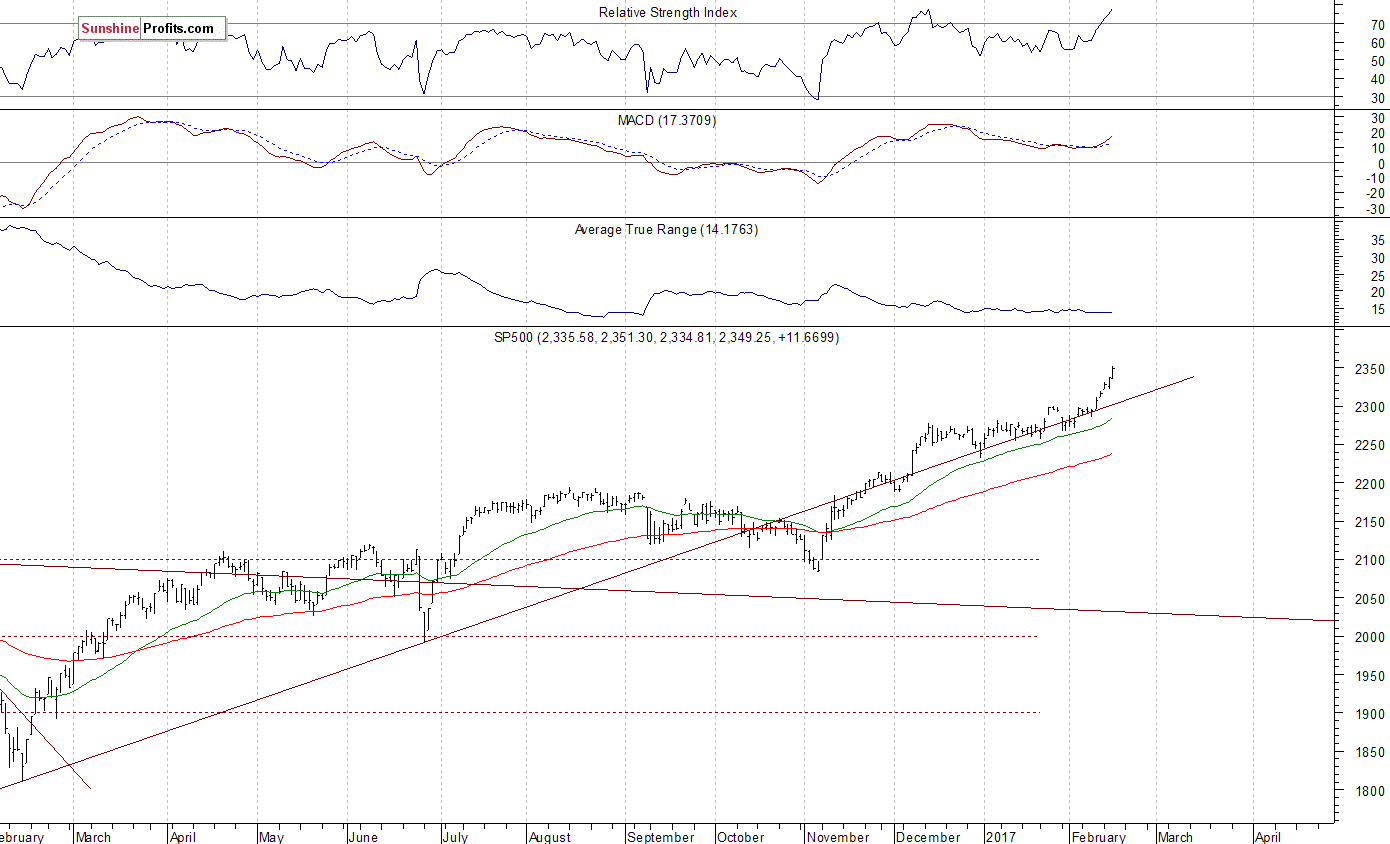
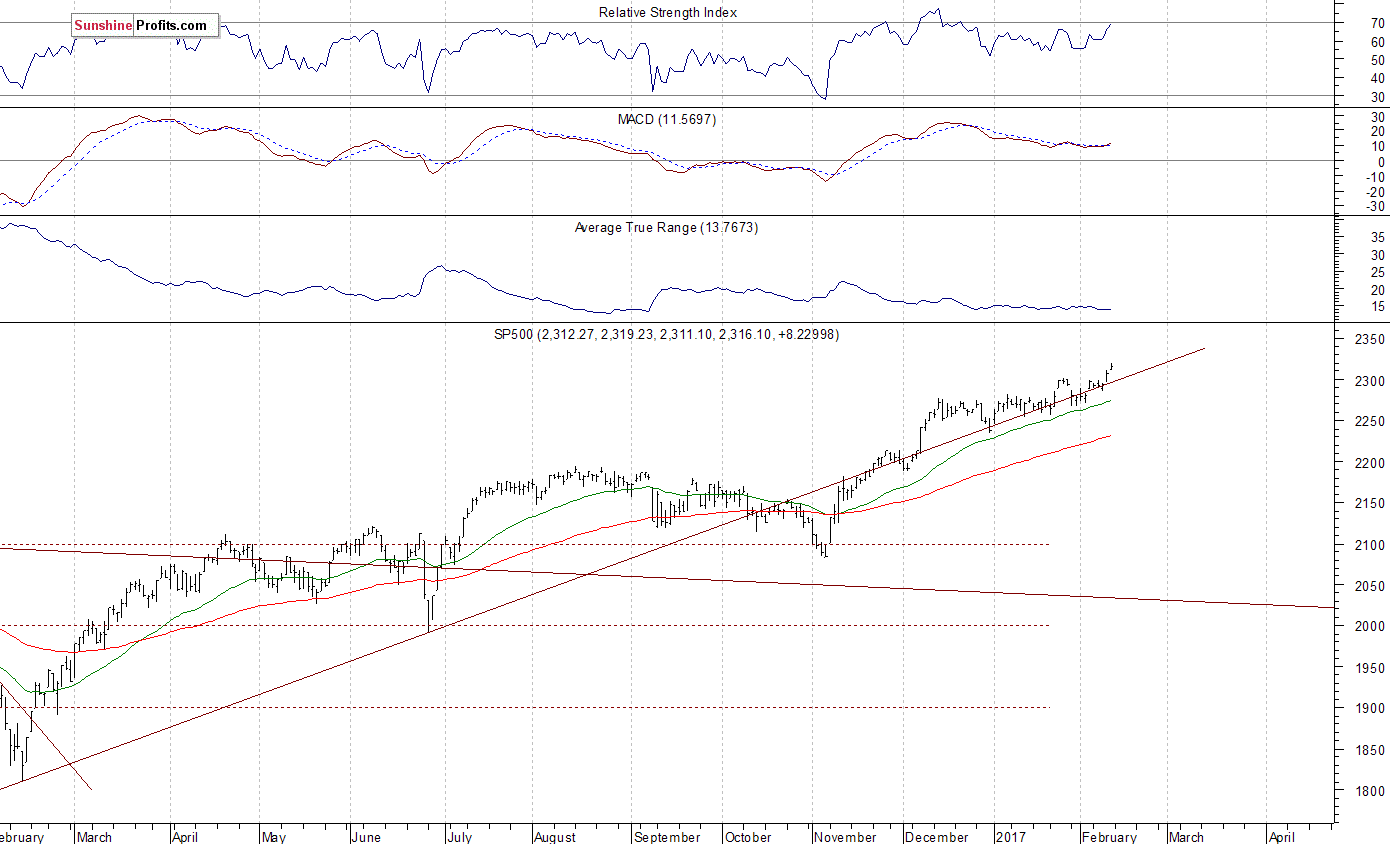
The main U.S. stock market indexes gained 0.5-0.6% on Wednesday, extending their short-term uptrend, as investors reacted to economic data, quarterly corporate earnings releases. The S&P 500 index has reached yet another new all-time high at the level of 2,351.30, following slightly lower opening of the trading session. The Dow Jones Industrial Average trades above the level of 20,600, and the technology Nasdaq Composite Index is now above 5,800 mark. All three major indexes trade at new record highs. Will the market extend its year-long medium-term uptrend even further before some more meaningful downward correction? The nearest important level of support of the S&P 500 index is at around 2,320, marked by Monday’s daily gap up of 2,319.23-2,321.42. The next support level is at around 2,300-2,310, marked by previous level of resistance and Friday’s daily gap up of 2,311.08-2,311.10. We can see some short-term volatility following three-month-long rally off last year’s November low at around 2,100. Is this a topping pattern before downward reversal? The uptrend accelerates, and it looks like a blow-off top pattern accompanied by some buying frenzy. The S&P 500 index trades above its medium-term upward trend line, as we can see on the daily chart:
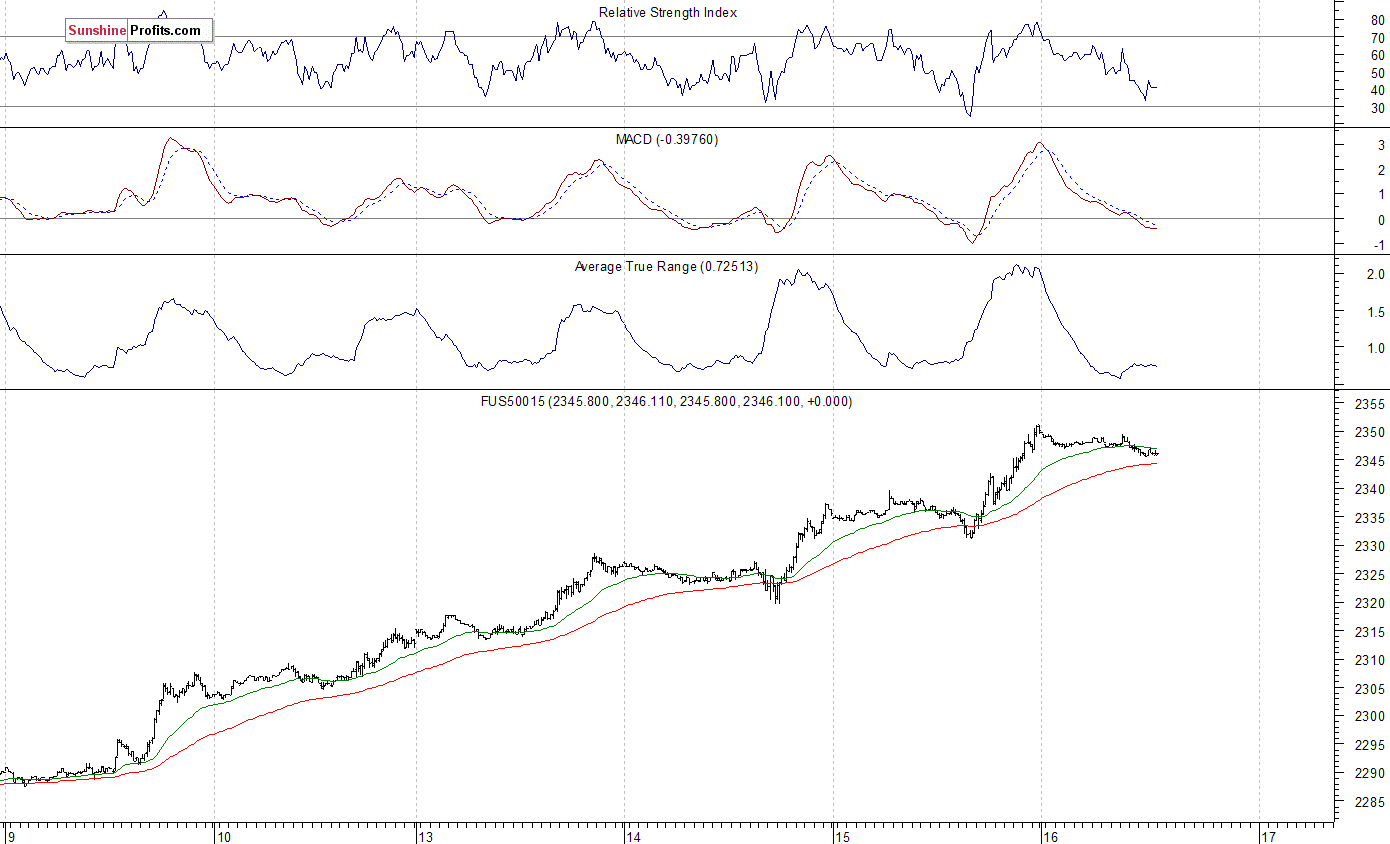
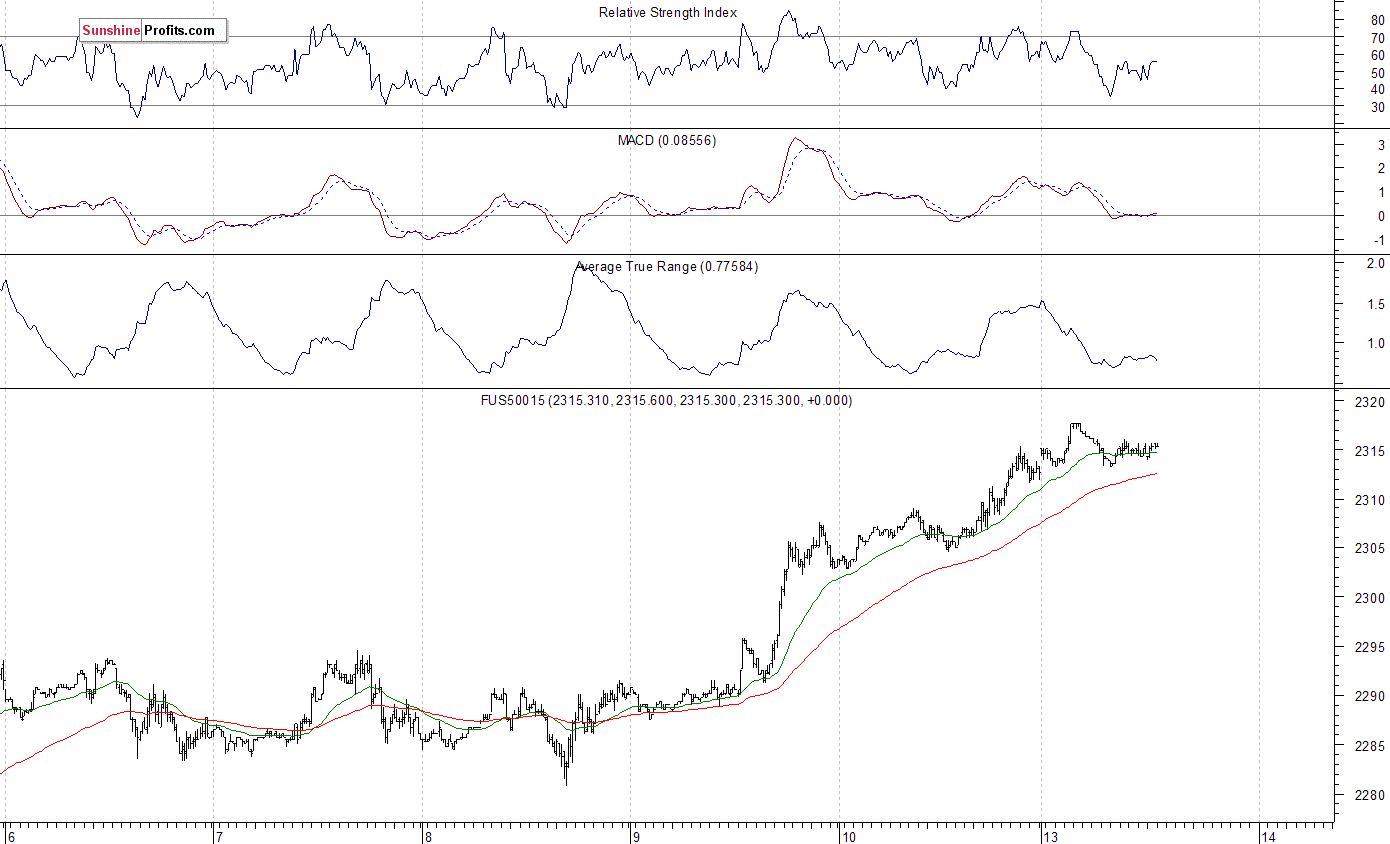
Expectations before the opening of today’s trading session are slightly negative, with index futures currently down 0.1-0.2%. The European stock market indexes have lost 0.2-0.5% so far. Investors will wait for another series of economic data announcements: Housing Starts, Building Permits, Initial Claims, Philadelphia Fed at 8:30 a.m. The market expects that Housing Starts along with Building Permits were little changed in January, the weekly Initial Claims number was at 242k, and the Philadelphia Fed number was at 17.5 in February. The S&P 500 futures contract trades within an intraday consolidation following yesterday’s rally. The nearest important level of support is at around 2,340, marked by recent local high. The next support level remains at 2,325-2,330, marked by previous level of resistance. On the other hand, resistance level is at around 2,350, marked by new record high. There have been no confirmed negative signals so far. However, we can see short-term overbought conditions, along with negative technical divergences. Is this a topping pattern or just an intraday consolidation before another leg up?
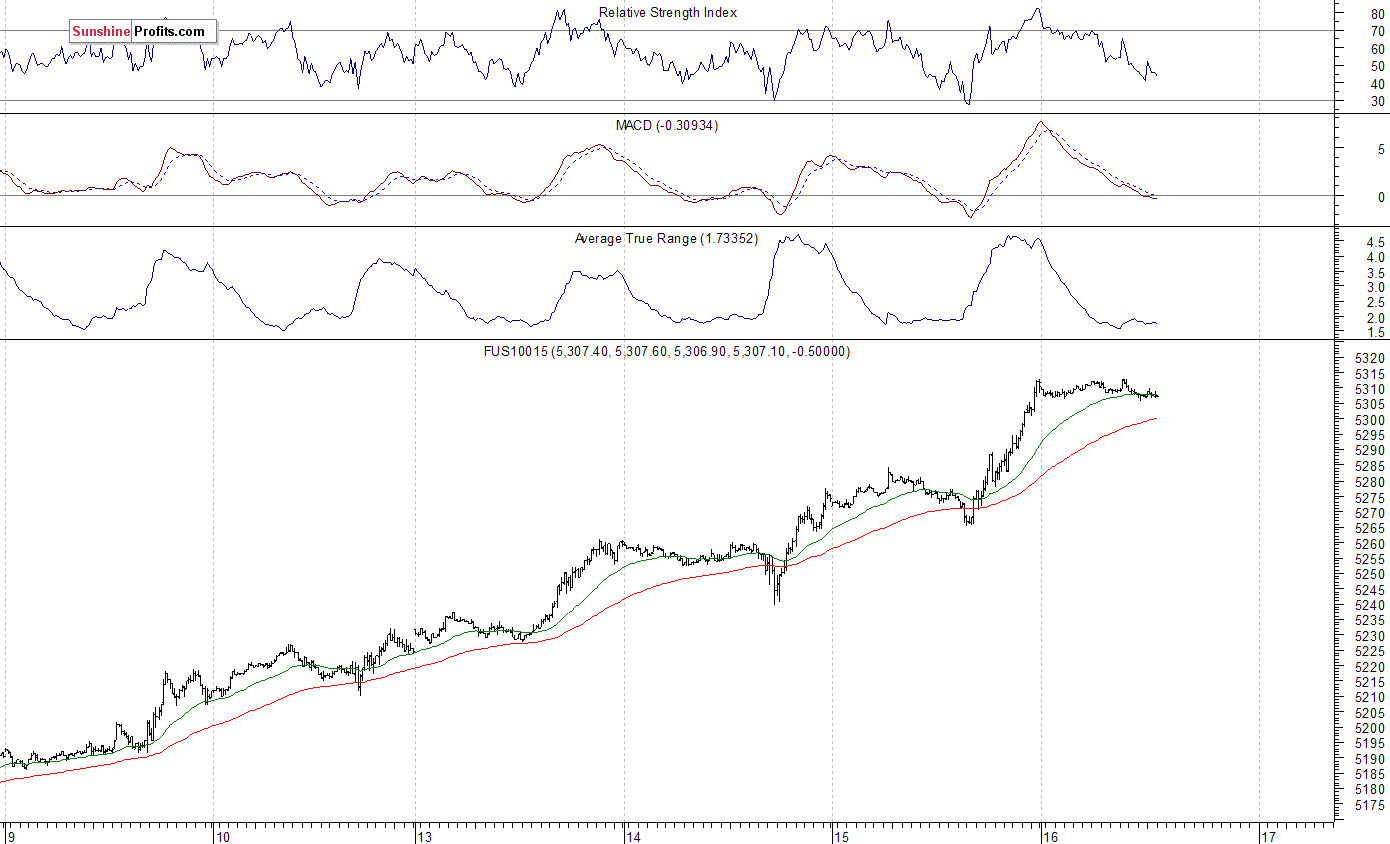
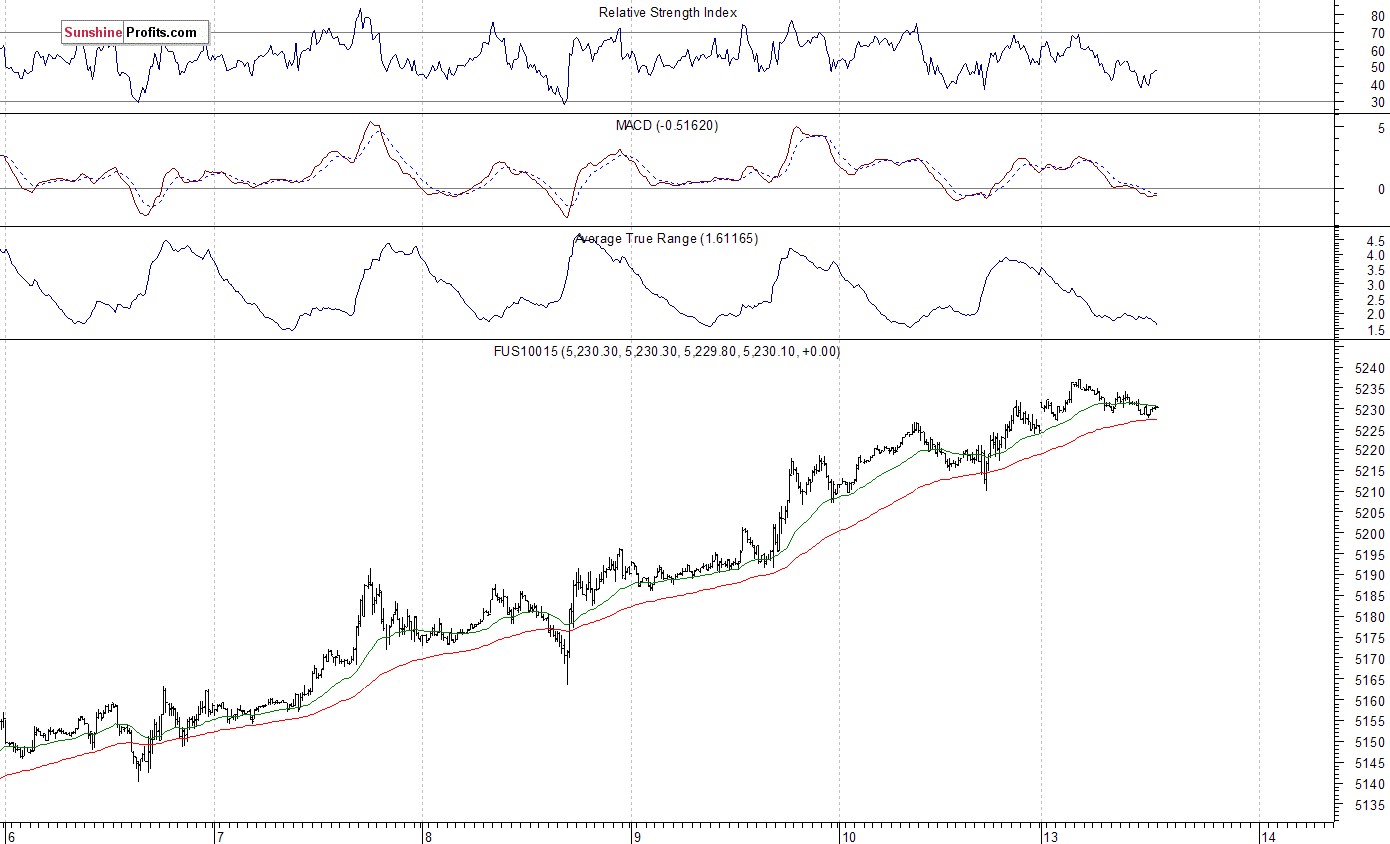
The technology Nasdaq 100 futures contract follows a similar path, as it currently trades within an intraday consolidation after yesterday’s rally. It has reached new all-time high above the level of 5,300. The technology sector stocks have been relatively stronger than the broad stock market recently following better-than-expected quarterly earnings releases. The nearest important support level is at 5,280-5,300, marked by previous level of resistance, and the next support level is at around 5,250, among others. The market trades along new all-time highs, as the 15-minute chart shows:
Concluding, the broad stock market accelerated its rally on Wednesday, as investors’ sentiment remained very bullish. The S&P 500 index has reached yet another new all-time high within an eight-year-long bull market off 2009 low. Will the uptrend continue despite some clear short-term overbought conditions? Or is this a topping pattern before downward correction?
Our speculative short position from December 14 has been closed on Tuesday, at the stop-loss level of 2,330 (S&P 500 index). We lost 61.65 index points on that trade, betting against year-long medium-term uptrend off last year’s February local low. It is always important to set some exit price level in case some events cause the price to move in the unlikely direction. Having safety measures in place helps limit potential losses while letting the gains grow.
There have been no confirmed negative signals so far. However, we still can see medium-term overbought conditions accompanied by negative technical divergences. Therefore, we continue to maintain our speculative short position (opened yesterday at 2,335.58 – opening price of the S&P 500 index). Stop-loss level is at 2,410 and potential profit target is at 2,200 (S&P 500 index). You can trade S&P 500 index using futures contracts (S&P 500 futures contract – SP, E-mini S&P 500 futures contract – ES) or an ETF like the SPDR S&P 500 ETF – SPY. It is always important to set some exit price level in case some events cause the price to move in the unlikely direction. Having safety measures in place helps limit potential losses while letting the gains grow.
To summarize: short position in S&P 500 index is justified from the risk/reward perspective with the following entry prices, stop-loss orders and profit target price levels:
S&P 500 index – short position: profit target level: 2,200; stop-loss level: 2,410
S&P 500 futures contract (March) – short position: profit target level: 2,197; stop-loss level: 2,407
SPY ETF (SPDR S&P 500, not leveraged) – short position: profit target level: $220; stop-loss level: $241
SDS ETF (ProShares UltraShort S&P500, leveraged: -2x) – long position: profit target level: $15.47; stop-loss level: $12.98
Thank you.
Paul Rejczak
Stock Trading Strategist
Stock Trading Alerts

 Have you ever been presented with an opportunity and missed out on it? Well, here is an opportunity you Do NOT want to miss out on.
Based upon my unique “Cycle Analytical” work combined with my “Proprietary Predictive Analytics Model”, I can assure you that there are new highs to be made in the U.S. stock. Appling my unique metric, which are not available to the public, I can inform you that the stock markets are not overbought or overextended, at present. The market remains in a clear bullish trend! This next new leg is very sustainable!
Technically Speaking, It Is Now Back To “Buy The Dip”:
The SPX, Dow Jones and the Nasdaq Composite all closed at new all-time highs last Friday, February 10th,2017. The Trump Rally is just getting started according to Bloomberg.
Investors should expect that the global markets will continue their bull market run throughout the first half of 2017 rather than forming a top which leads to a bear market. “Extremes” have lost their’ meanings, at this point. The Federal Reserve has given the green light to major banks in the U.S. to raise dividends and buy back shares of their companies. The huge thrust in momentum has now returned to the four U.S. stock indexes.
Emerging Markets will out perform the US stocks over the next 10 years. Other topics include Donald Trump, India, China economy, Commodity rally and MORE….in this 13 minute interview
…also from Marc: Trump is a very Great Talker


When did the distortion start occurring in the markets when increasing UNCERTAINTY can come with an increase in COMPLACENCY and SENTIMENT?

The short answer is: When Wall Street and its media maven lap dogs began controlling the public narrative. I place our newly minted Twitter King, “the Donald” at the intersection of both!
…related:
Stock Trading Alert: Stocks At Record Highs – Will Uptrend Accelerate?
Stock Trading Alert originally sent to subscribers on February 13, 2017, 6:56 AM.
Briefly: In our opinion, speculative short positions are favored (with stop-loss at 2,330, and profit target at 2,150, S&P 500 index).
Our intraday outlook remains bearish, and our short-term outlook is bearish. Our medium-term outlook remains neutral, following S&P 500 index breakout above last year’s all-time high:
Intraday outlook (next 24 hours): bearish
Short-term outlook (next 1-2 weeks): bearish
Medium-term outlook (next 1-3 months): neutral
Long-term outlook (next year): neutral
The U.S. stock market indexes gained between 0.3% and 0.5% on Friday, extending their short-term uptrend, as investors’ sentiment remained bullish following quarterly earnings, tax cut plan, economic data releases, among others. The S&P 500 index has reached new all-time high at the level of 2,319.23. The Dow Jones Industrial Average continues to trade above support level of 20,000, and the technology Nasdaq Composite Index is now above the level of 5,700. All three major indexes trade at new record highs. Will the market extend its year-long medium-term uptrend even further before some more meaningful downward correction? The nearest important level of support of the S&P 500 index is at 2,300-2,310, marked by previous level of resistance and Friday’s daily gap up of 2,311.08-2,311.10. The next support level is at around 2,285-2,290, marked by last week’s Friday’s daily gap up of 2,283.97-2,287.88. We can see some short-term volatility following November – January move up. Is this a topping pattern before downward reversal? The S&P 500 index still trades along medium-term upward trend line, as we can see on the daily chart:
Expectations before the opening of today’s trading session are slightly positive, with index futures currently up 0.1-0.2%. The European stock market indexes have gained 0.1-0.9% so far. Investors will wait for more quarterly corporate earnings releases, tomorrow’s and Wednesday’s inflation data, Retail Sales, Industrial Production releases, among others. The S&P 500 futures contract trades within an intraday consolidation following last week’s move up. The nearest important level of support is at around 2,300, marked by previous level of resistance. The next support level remains at 2,280-2,285. On the other hand, resistance level is at 2,315-2,320, marked by new record high. There have been no confirmed negative signals so far. However, we can see some short-term overbought conditions, along with negative technical divergences. Is this a topping pattern or just an intraday consolidation before another leg up?
The technology Nasdaq 100 futures contract follows a similar path, as it currently trades within an intraday consolidation after last week’s rally. It has reached new all-time high above the level of 5,235. The technology sector stocks have been relatively stronger than the broad stock market recently following better-than-expected quarterly earnings releases. The nearest important support level is at 5,200, marked by previous level of resistance, and the next support level is at around 5,180, among others. The market trades along new all-time highs, as the 15-minute chart shows:
Concluding, the broad stock market continued its short-term uptrend on Friday, as the S&P 500 index reached new record high close to the level of 2,320. Will the uptrend extend even further? Or is this some topping pattern before a downward correction? There have been no confirmed negative signals so far. However, we still can see medium-term overbought conditions accompanied by negative technical divergences. Therefore, we continue to maintain our speculative short position (opened on December 14 at 2,268.35 – daily opening price of the S&P 500 index). Stop-loss level remains close to current market price, at 2,330 and potential profit target is at 2,150 (S&P 500 index). You can trade S&P 500 index using futures contracts (S&P 500 futures contract – SP, E-mini S&P 500 futures contract – ES) or an ETF like the SPDR S&P 500 ETF – SPY. It is always important to set some exit price level in case some events cause the price to move in the unlikely direction. Having safety measures in place helps limit potential losses while letting the gains grow.
To summarize: short position in S&P 500 index is justified from the risk/reward perspective with the following entry prices, stop-loss orders and profit target price levels:
S&P 500 index – short position: profit target level: 2,150; stop-loss level: 2,330
S&P 500 futures contract (March 2017) – short position: profit target level: 2,145; stop-loss level: 2,325
SPY ETF (SPDR S&P 500, not leveraged) – short position: profit target level: $214.5; stop-loss level: $232.5 (updated)
SDS ETF (ProShares UltraShort S&P500, leveraged: -2x) – long position: profit target level: $16.35; stop-loss level: $14.00 (calculated using trade’s opening price on Dec 14 at $14.78).
Thank you.
Paul Rejczak
Stock Trading Strategist
Stock Trading Alerts

-
I know Mike is a very solid investor and respect his opinions very much. So if he says pay attention to this or that - I will.
~ Dale G.
-
I've started managing my own investments so view Michael's site as a one-stop shop from which to get information and perspectives.
~ Dave E.
-
Michael offers easy reading, honest, common sense information that anyone can use in a practical manner.
~ der_al.
-
A sane voice in a scrambled investment world.
~ Ed R.
Inside Edge Pro Contributors

Greg Weldon

Josef Schachter

Tyler Bollhorn

Ryan Irvine

Paul Beattie

Martin Straith

Patrick Ceresna

Mark Leibovit

James Thorne

Victor Adair