Stocks & Equities

Stock Trading Alert: Uncertainty As Investors Await Series Of Quarterly Earnings Releases

Sent to subscribers on January 23, 2017, 6:54 AM.

Briefly: In our opinion, speculative short positions are favored (with stop-loss at 2,330, and profit target at 2,150, S&P 500 index).

Our intraday outlook remains bearish, and our short-term outlook is bearish. Our medium-term outlook remains neutral, following S&P 500 index breakout above last year’s all-time high:

Intraday outlook (next 24 hours): bearish
Short-term outlook (next 1-2 weeks): bearish
Medium-term outlook (next 1-3 months): neutral
Long-term outlook (next year): neutral

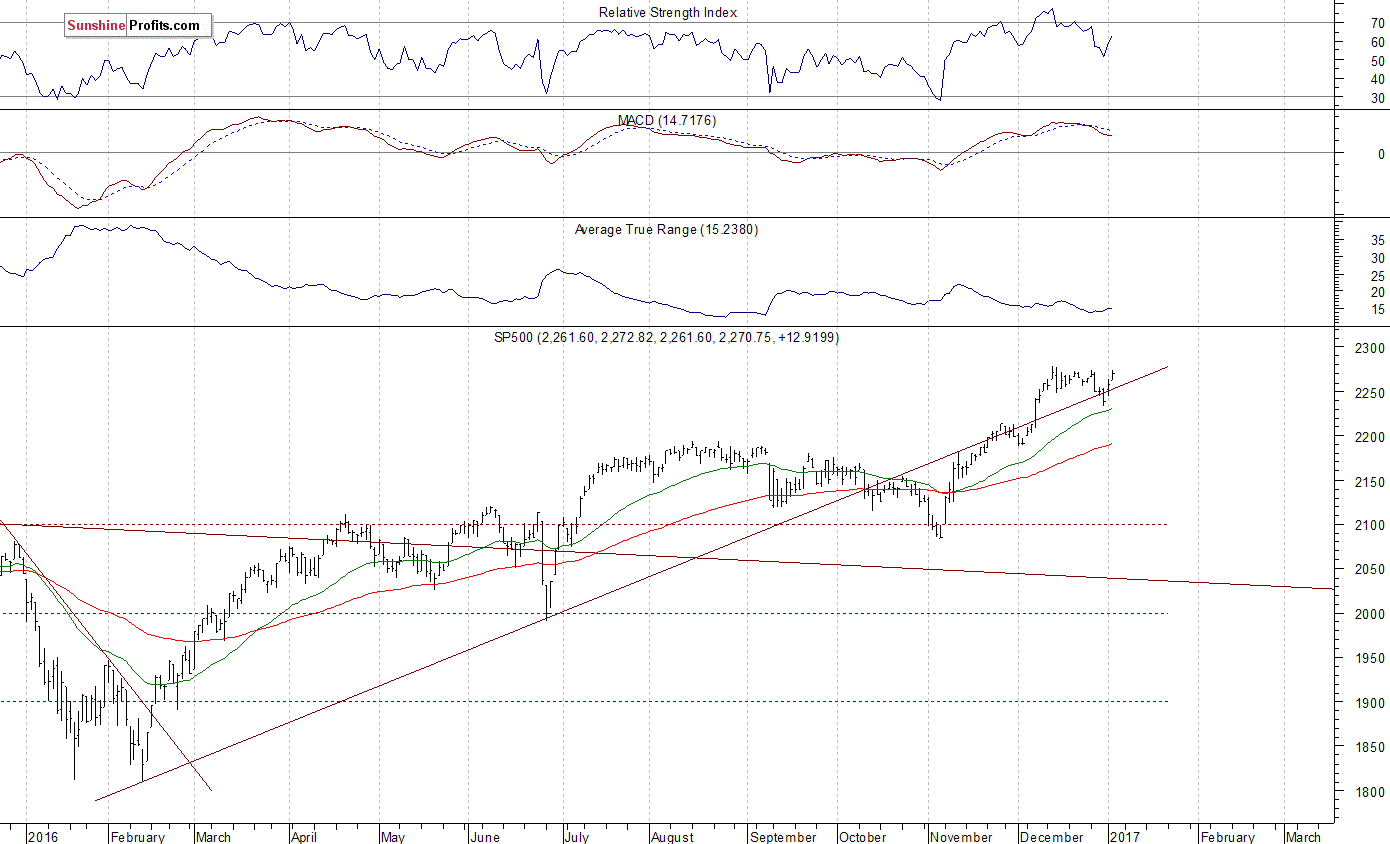
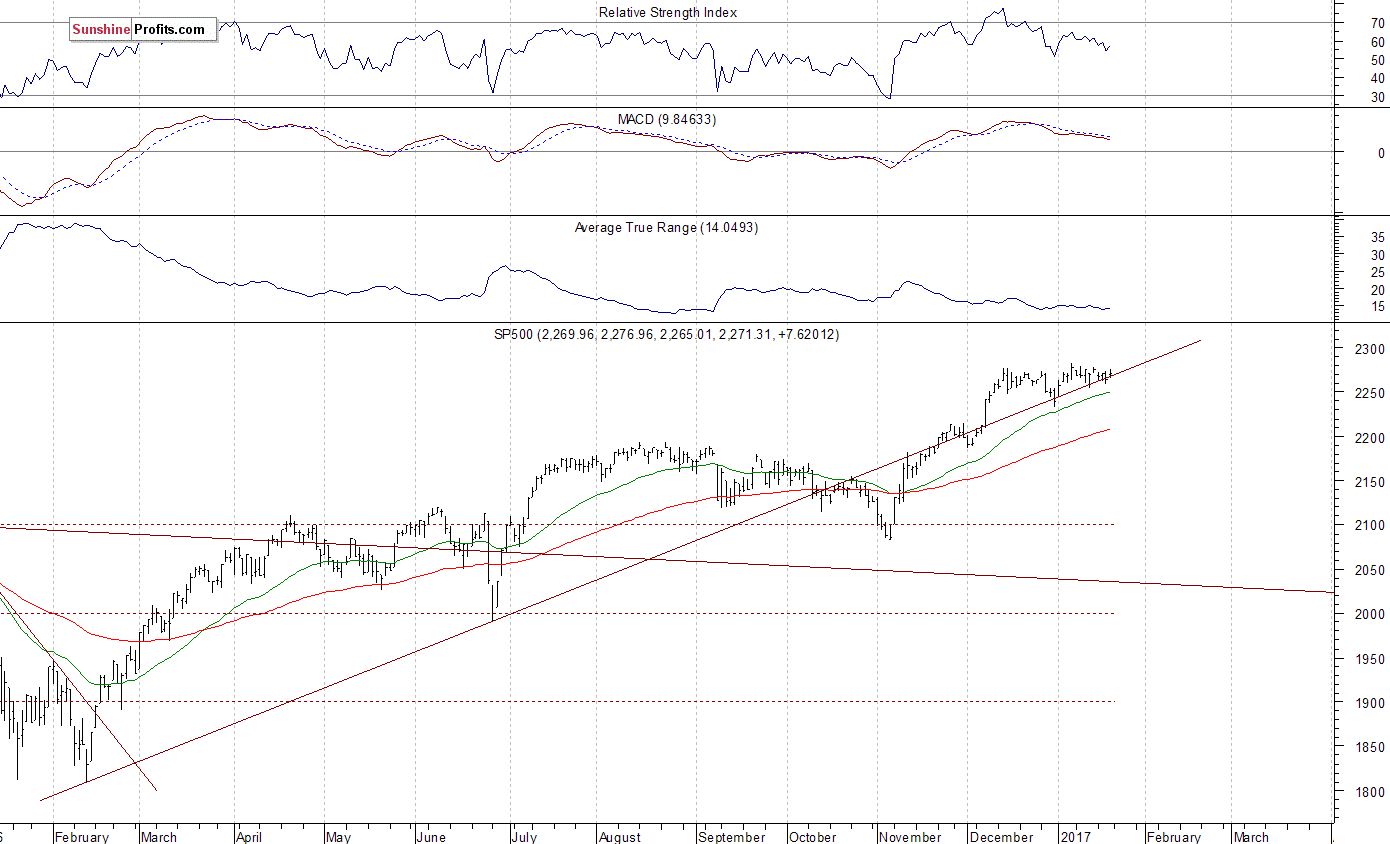
The main U.S. stock market indexes gained between 0.2% and 0.5% on Friday, extending their short-term consolidation, as investors reacted to economic data releases, Donald Trump’s Presidential Inauguration, among others. The S&P 500 index continues to trade close to its January 6 new record high of 2,282.10. Generally, all three major stock market indexes extend their fluctuations along new all-time highs. The Dow Jones Industrial Average trades relatively close to round resistance level of 20,000 and the technology Nasdaq Composite has reached its new record high a week ago at the level of 5,584.26. Will the market extend its year-long medium-term uptrend even further before some more meaningful downward correction? The next possible resistance level of the S&P 500 index remains at 2,300 mark. On the other hand, the nearest support level is at around 2,255-2,260, marked by recent local lows. The next support level is at 2,230-2,240, marked by the late December local low. We can see new long-term highs within almost eight-year-long bull market from 2009 multi-year low of 666.8. However, the index extends its over month-long consolidation. It still trades along medium-term upward trend line, as we can see on the daily chart:

1

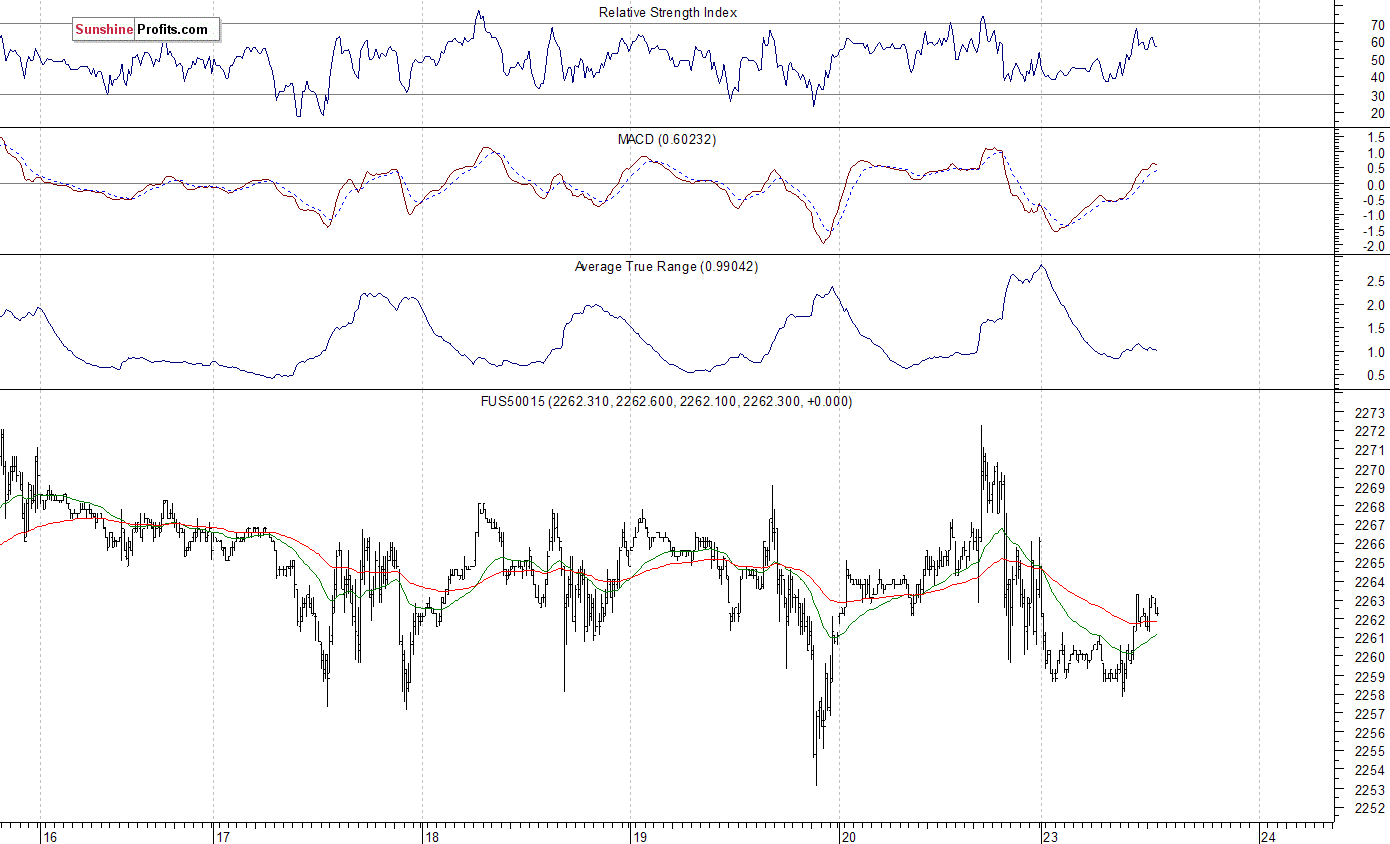
Expectations before the opening of today’s trading session are slightly negative, with index futures currently down 0.1-0.2%, as investors take short-term profits off the table following Friday’s advance. The market has retraced its Friday’s move up. The main European stock market indexes have lost 0.3-0.4% so far. The S&P 500 futures contract trades within an intraday consolidation, following an overnight move down. The nearest important support level remains at 2,245-2,250, marked by previous local low. On the other hand, resistance level is at around 2,270-2,275, marked by local highs. Is this a topping pattern before downward correction of the November – December rally? Or just consolidation within an uptrend? There have been no confirmed negative signals so far. The futures contract continues to trade within an over week-long consolidation along 2,260-2,270, as the 15-minute chart shows:


S&P 500 futures contract - S&P 500 index chart - SPX

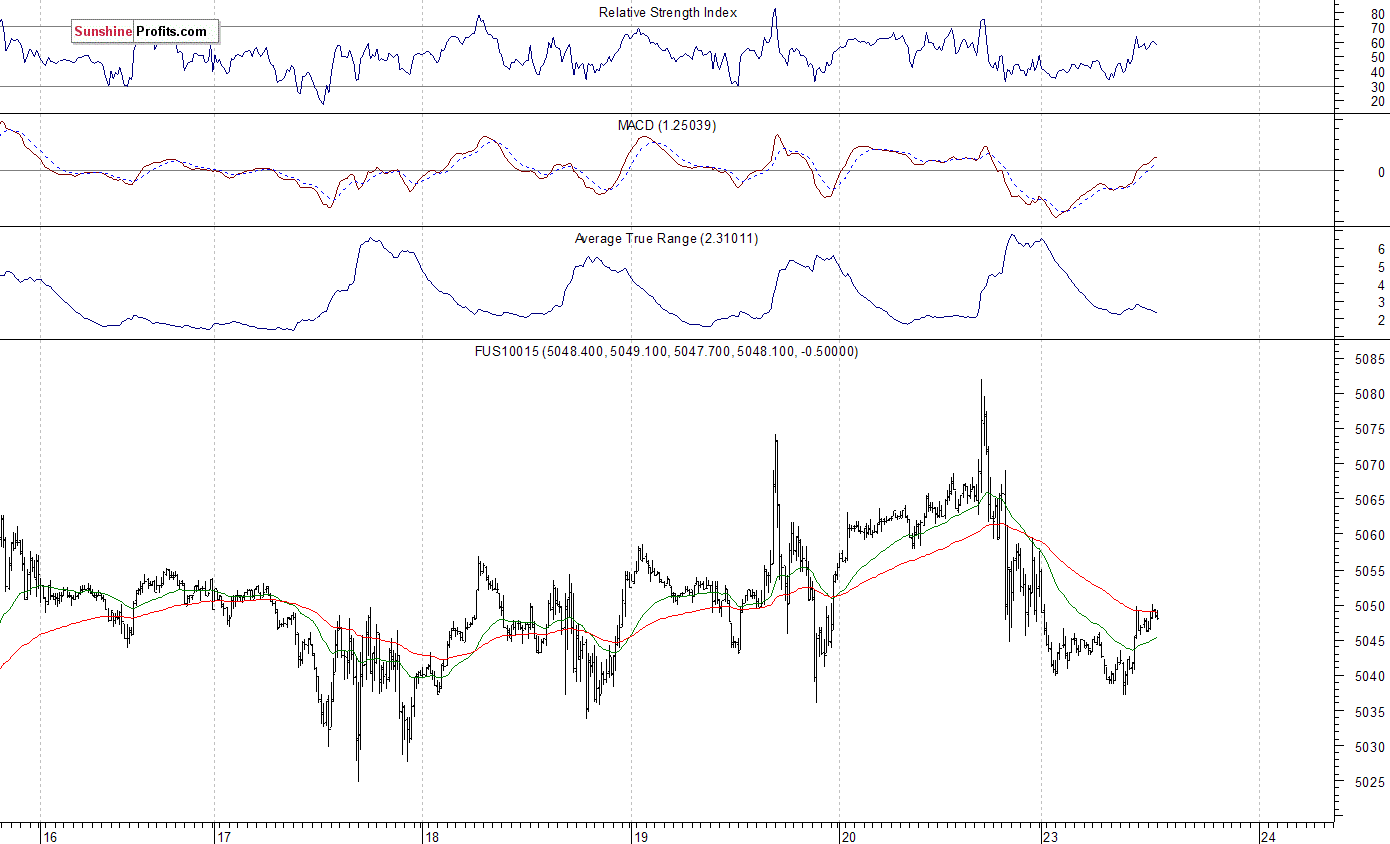
The technology Nasdaq 100 futures contract follows a similar path, as it currently trades within an intraday consolidation, following an overnight move down. The market remains relatively close to its Friday’s new all-time high above the level of 5,080. However, it looks like an intraday flat correction within a short-term downtrend. The next potential resistance level is at 5,100 mark. On the other hand, support level remains at 5,040-5,050, marked by some recent local lows. The next support level is at 4,980-5,000, marked by previous level of resistance. Will the technology Nasdaq 100 futures contract continue its medium-term uptrend even further? There have been no confirmed negative signals so far. However, we still can see short-term overbought conditions:

Nasdaq100 futures contract - Nasdaq 100 index chart - NDX

Concluding, the broad stock market extends its short-term fluctuations along new record highs, as investors await quarterly corporate earnings releases. Will those reports drive the broad stock market higher before some more meaningful downward correction? There have been no confirmed negative signals so far. However, we still can see medium-term overbought conditions accompanied by negative technical divergences. Therefore, we continue to maintain our speculative short position (opened on December 14 at 2,268.35 – daily opening price of the S&P 500 index). Stop-loss level remains at 2,330 and potential profit target is at 2,150 (S&P 500 index). You can trade S&P 500 index using futures contracts (S&P 500 futures contract – SP, E-mini S&P 500 futures contract – ES) or an ETF like the SPDR S&P 500 ETF – SPY. It is always important to set some exit price level in case some events cause the price to move in the unlikely direction. Having safety measures in place helps limit potential losses while letting the gains grow.

To summarize: short position in S&P 500 index is justified from the risk/reward perspective with the following entry prices, stop-loss orders and profit target price levels:

S&P 500 index – short position: profit target level: 2,150; stop-loss level: 2,330
S&P 500 futures contract (March 2017) – short position: profit target level: 2,145; stop-loss level: 2,325
SPY ETF (SPDR S&P 500, not leveraged) – short position: profit target level: $214; stop-loss level: $232
SDS ETF (ProShares UltraShort S&P500, leveraged: -2x) – long position: profit target level: $16.35; stop-loss level: $14.00 (calculated using trade’s opening price on Dec 14 at $14.78).

Thank you.

….also from Sunshine Profits: Oil Trading Alert: Time for Drop below $50?

Paul Rejczak
Stock Trading Strategist
Stock Trading Alerts

Cisco – Still Dominant

ciscoThe field of routers and switches which has made Cisco famous is likely to change dramatically over the next few years.

Competition from HP and Juniper Networks continues to be fierce, but other players like Huawei are also hampering Cisco’s development, especially in China.

We believe, however, that Cisco’s strength lies in its considerable experience which, in our opinion, will enable it to… CLICK HERE for the complete analysis

Volatility Insights: What Can You Learn From The Big Short Interest In The VIX Futures?

Summary

– VIX shorts are currently near a 5-year high.

– Spot VIX has been realizing low volatility.

– There is a better relationship between the net positioning and the market.

I have been a regular contributor on SA when it comes to the topic of volatility. Naturally, I receive a number of questions being posed to me in regards to various topics. However, as of late, I have been getting questions about the heavy short interest in the VIX futures and whether this means anything. Of course, the question can be posed more bluntly. Does the heavy short interest in the VIX futures mean that we are about to see a bout of increased volatility in the near future?

Now I have my opinions and thoughts. However, I also let the data educate me. In this case, I will walk through the historical data on the VIX futures with you and perhaps we can answer some questions, and perhaps we can get some more interesting questions coming out of this exercise.

Now let’s look at where the VIX shorts currently stand:

526047-14848357958554265 origin

….for more and larger charts go HERE


Marc Faber: Take a Gamble on Trump

1465823697 marcfaberThere are many advantages to spread betting not least the flexibility to engage in transactions whilst on the move and in your spare time. In addition to this, as you don’t own the asset there is no need for large capital investment. The basic principle of this form of investment and trading is a simple one. However, albeit straightforward it would be prudent to enlist the support of a professional such as the CMC markets, an online trading and investment company.

The recent United States Presidential election has, as would be expected caused some nervousness in the markets, however careful analysis is required to determine the possible impact on the markets over the coming months and in particular the impact on spread betting.

To look at this in detail we need to consider the principles of spread betting. There are different methods of spread betting but we will concentrate on online trading. This provides an excellent method of monitoring the markets and managing individual spread betting. We have already touched on the advantages of the process but in addition to this a key factor is the fact that spread betting is considered to be gambling and as such any profit is not subject to taxation. Unlike some forms of trading the investor does not buy shares but buys a stake (points). In addition the investor can also sell their stake. The point at which the stake is sold is the important factor as this will dictate the profit (or loss) that will be made. Spread betting allows the trader to trade on the price of movement of thousands of financial markets including commodities, indices, stocks and shares.

The fact that the trader is trading on the price of movements on thousands of financial markets is where the outcome of the US Presidential elections becomes a factor, in that elections affect markets and confidence in them which in turn impacts on values. Trump continues to affect the stock market but concerns his election would have disastrous effects on the markets have simply not come to fruition with markets holding firm. So, for the time being it remains “business as usual”. The coming months are of course difficult to predict but it is possible to analyse the potential impact of Trump’s proposed policies on the markets.

Trump’s plan on tax is the reduction of 7 income tax brackets to just 4 which would lead to tax cuts for many and in some cases will see some households pay no income tax at all. This may well increase spending and boost both the dollar and the indices. In addition, Trump claims he will half corporation tax to encourage US companies to keep their activities in the US rather than using less expensive territories abroad. This again is likely to lead to higher stock prices. In addition cutting regulation on business should have a positive impact on the markets. If Trump is able to deliver this, as promised, within his first 100 days of office it is likely this will improve market optimism. Increase in spending will also likely boost the economy and in turn increase stock and share values. This has to be tempered with the strict management of the national debt over the mid to long term duration of the administration. Concern on how Trump’s policies will be funded may have a negative impact on the economy but one that in the short term is unlikely to impact significantly on the markets. Managing debt plays part of his overall plan.

The end result of the new President taking up office is that the markets are likely to be at worst stable but are actually more likely to be boosted. This should provide the spread better significant opportunities to see their stakes increase in value to allow a good profit to be made if carefully monitored and managed. Online technology will allow the spread better to monitor the markets closely and buy and sell at the most opportune times. Online management of transaction should allow them to act promptly regardless of their physical location.

So with a little optimism and nerve there remains profit to be made.

….also from Tyler Bolhorn:

Be Afraid of the Fear of Missing Out + Strategy of the Week

Use This Trade to Stomp a Boring Market

tradingboard

  • A tight range ahead of Dow 20,000
  • Dominating the post-election melt up
  • Plus: Holding our breath before the inauguration…
  • Rude Numbers: When to Buy When to Sell

The weeks following the election lit a fire under the stock market.

In an epic rally, the Dow Industrials shot higher by 2,000 points in a matter of weeks. Forgotten sectors offered traders fresh gains every single day. The struggles from earlier in the year vanished.

How quickly things change.


Right now, the market action is downright boring. The major averages have barely budged in 2017. Just as the market spit out a record gain to finish the year, a new record for standing still is now in the books…

“A funny thing happened after the third-largest rally since 1900 for the Dow from the U.S. election until year-end (+7.8%)—it is now in the midst of the smallest monthly range ever,” explains the LPL Financial Research team. “That’s right, with the Dow flirting with the big 20,000 level, it has simply stopped moving, up or down, and the daily ranges have been historically small.”

There are just too many distractions for investors these days. As a result, stocks are holding their breath as we barrel toward the inauguration.

But that doesn’t mean there aren’t any trades lurking under the surface of the major averages…

While almost every investor on the planet is laser focused politics and Twitter rants, our eye is drawn to the tech sector.

The big tech darlings that everyone left for dead in late 2016 have come roaring back to retake their rightful throne as market leaders. This is one of the best places to look for a new trade—even if the market is stuck in a tight range for now.

It’s important to note that big tech hasn’t completely dominated the post-election melt up. At the beginning of December, traders kicked the market’s most flashy, popular tech stocks to the curb. The FANGs—Facebook, Amazon, Netflix, Google— received the biggest beating as folks piled into materials and banks. By Dec. 1, each of these once-coveted stocks had dropped at least 4.5% since election day.

The new year has been much kinder to these mega-caps. Facebook shares are up more than 11% so far this year. Netflix is up 7%. Google has gained 4%. Tech stocks are officially back in favor as the averages tread water.

But if we truly want to book outsized gains, we have to hitch a ride with the most powerful stocks in the sector. 

That’s where semiconductors come into play.

Semiconductors have slapped around the rest of the market since they fought off their lows and broke out to new 2016 highs all the way back in June. Now they’re ready to continue their dominance as the tech sector comes back into focus.

SemisDominate

The S&P 500 has gained 18% over the past 12 months. Over that same timeframe, the tech sector has posted gains nearing 25%. But semiconductors blow them both out of the water. The VanEck Vectors Semiconductor ETF (NYSE:SMH) boasts 12-month gains of more than 48%.

Semiconductors were the ultimate snapback trade for a market melt-up—especially when you consider the sector’s lagging performance leading up to its big breakout back in June 2016. You probably recall that investors wanted absolutely nothing to do with these stocks when the market was struggling in 2015.

But now that the semis have regained a leadership role, we can expect to see the trend continue higher. That not just bullish for the tech sector, but the entire market.

Sincerely,

Greg Guenthner

Rude Numbers
When to Buy… When to Sell

Screen Shot 2017-01-18 at 7.12.16 AM

….also:

Will the Stock Market Bull Continue to Charge or is it time to sell the news