
Stocks & Equities

![]()
Stockscores.com Perspectives for the week ending January 16, 2017

In This Week’s Issue:
- Weekly Commentary
- Strategy of the Week
- Stocks That Meet The Featured Strategy
- Stockscores’ Market Minutes Video – Adapt to the Market
- Stockscores Trader Training – Be Afraid of the Fear of Missing Out
- Stock Features of the Week – Stockscores Simple Canada
Stockscores Market Minutes – Adapt to the Market
Trading strategies can be improved by considering the state of the overall market. What works in an up trending market may not work as well if the market is heading lower or sideways. That topic, my regular weekly market analysis and the trade of the week on Sanchez Energy (SN). Click Here to Watch
To get instant updates when I upload a new video, subscribe to the Stockscores YouTube Channel
Trader Training – Be Afraid of the Fear of Missing Out
Traders, particularly those who need to make money rather than those who would like to make money, tend to have a fear of missing out. They hear about a trading idea or find an opportunity with their own effort and make the trade with less thought than they might put into buying a microwave. They can invest thousands of dollars on an impulse, much like the drunken gambler who throws down $1000 on Five Red.
One reason for this sort of reckless approach to trading is the belief that trading ideas are like gifts. They only come along from time to time and you should feel grateful for the opportunity. If you spend 10 hours researching a company or receive the occasional bit of insight from someone who should know more than the rest of us, it’s easy to understand why you wouldn’t want to let a seemingly promising trade slip through your fingers. The problem is that this gratitude for trading ideas leads you to lower your standards and place trades that are not much more than a gamble.
Have you ever made a trade and then, just a few minutes or days later, asked yourself what the heck you were thinking? If you are normal, then it’s likely that you have because it is easy to focus on the dream of making a profit. You should focus your attention on the trading situation as it has been presented to you by the market rather than the words of an expert. Some trading opportunities are so well marketed that it’s hard to see the truth because you fixate on the profit potential that has been dangled before you as the prize.
It is critical to only take trades that meet the criteria of a strategy that you have found to have a positive expected value. Rather than look for a reason to take the trade, which is easy, look for a reason not to. Ask yourself, “If I buy this stock, who will be selling to me, and what does she know that I don’t know?” Looking at the other side of the argument will often highlight considerations that you have missed.
Being fussy is a lot easier when you recognize that the market-even a slow market-will give you opportunities. The markets have been pretty quiet this year but there are still stocks outperforming the market every day.
And if you can’t find a trade today, tomorrow or in the next week, eventually you will. There is always another bus coming down the road. If you miss one, just wait for the next.
I have found that you will actually make more money by trading less. If you maintain a very high standard for what trades you make, you will always pass on some trades that end up doing very well. By being selective, however, you will also avoid many marginal trades that would tie up your capital and then incur a loss. By being fussy and trading less, you end up taking only the very best trades and your results will be better overall.
It is easy to be fussy when the market is strong and there are lots of opportunities. It’s like fishing when every time you cast your line you get a bite. With that kind of success, you will quickly throw back any fish that is too small because you know there’s going to be something better coming along soon. You only take the best of the best.
When the fish stop biting and you spend hours with no bounty, you take the first fish that grabs your hook. It could be a tiny fish that you would never keep on even an average day, but with your desire to catch something, you keep it anyway. It would be better to have just not gone fishing at all.
You’ll do the same thing when trading a slow market. Eager to make a profit, you will take trades that show some potential even if they don’t meet all of your requirements. You will work hard to uncover a trade rather than wait for the obvious no-brainer trades that you take when the market is in a giving mood.
I like to say that in trading, when the going gets tough, the tough get lazy. You can’t control the market, so if the market is not giving you opportunities, it’s better to do nothing. Your hard work will not change what the market does.
This is hard for many people who have been programmed to relate hard work to success. If you try harder than the next person in a sport, you should get a better result. If you study harder for an exam, you should get a better mark. If you work longer hours at your job, you should make more money. In the stock market, if you work harder to find good trades, you will probably lose money.
The best trades are easy to find. Working hard to uncover something leads you to find questionable trades that you have to talk yourself into. It’s better to walk away when you have doubts.
This is not to say that hard work is not rewarded in trading. Traders who work hard at practicing their analytical skills or developing new strategies will be rewarded. People who devote their time and effort to improving their emotional control will be better traders. These are things that you can control and affect with hard work, but hard work won’t change what the stock market does.

US markets were closed Monday for the Martin Luther King holiday and that meant Canadian markets were quite slow. With that in mind, I ran the Stockscores Simple Canada market scan and found a couple of penny stocks that look interesting after Monday’s session:
1. V.MMS
V.MMS is breaking up from a rising bottom after recently breaking its pull back. Support at $0.07. (Weekly chart – M/T Ed)

2. T.QRM
T.QRM breaking through $0.21 resistance today on strong volume after building an optimistic rising bottom over the past month. Support at $0.15. (Daily chart M/T Ed.)

References
- Get the Stockscore on any of over 20,000 North American stocks.
- Background on the theories used by Stockscores.
- Strategies that can help you find new opportunities.
- Scan the market using extensive filter criteria.
- Build a portfolio of stocks and view a slide show of their charts.
- See which sectors are leading the market, and their components.
Disclaimer
This is not an investment advisory, and should not be used to make investment decisions. Information in Stockscores Perspectives is often opinionated and should be considered for information purposes only. No stock exchange anywhere has approved or disapproved of the information contained herein. There is no express or implied solicitation to buy or sell securities. The writers and editors of Perspectives may have positions in the stocks discussed above and may trade in the stocks mentioned. Don’t consider buying or selling any stock without conducting your own due diligence.

For of all sad words of tongue or pen, the saddest are these: ”It might have been!”
John Greenleaf Whittier
For a long time, our theme was to view all sharp pullbacks through a bullish lens as the trend based on our trend indicator was trading firmly in bullish territory. Secondly, onecritical psychological component was in our favour too- the masses were either bearish or they cursed this market from the sidelines (neutral camp); hence the slogan the most hated bull market in history. We must deter for a second by stating that a mild or brutal correction comes down to what level you embraced this market. If you embraced this Stock Market Bull in the early stages from 2009 -2011, then a mild correction would seembrutal or back breaking in comparison to someone who just jumped into the market. A 15-20% correction would knock the socks out of them, but for you, it would appear to be nothing but a blip; this is why we have consistently stated that the best time to open long positions when the masses are in a state of despair.
Having said that what does the future hold?
Towards the end of last year around Dec, we stated that we were getting a tad bit nervous as the crowd had started to embrace this bull market. Up until the Trump win, which we saw as a bullish event for the markets, while most experts viewed it as a death omen, the masses were either bearish or sitting on the sidelines. Bullish sentiment was generally below 40%, and the combined score of the individuals in the bearish and neutral camp was almost always above 55% and in most cases above 65%. After Trump had won the markets experienced an initial shock but recouped twice as fast as they did with Brexit and never looked back since. During this monstrous rally, the sentiment gradually started to improve, and for the past 11 weeks, the percentage of individuals in the bullish camp hasalways been above the 40% mark. On three occasions in the past 11 weeks, the bullish sentiment soared above the 50% mark something we had not experienced even once over the past 30 months. As we pay close attention to the masses, this had to be treated as a significant development.
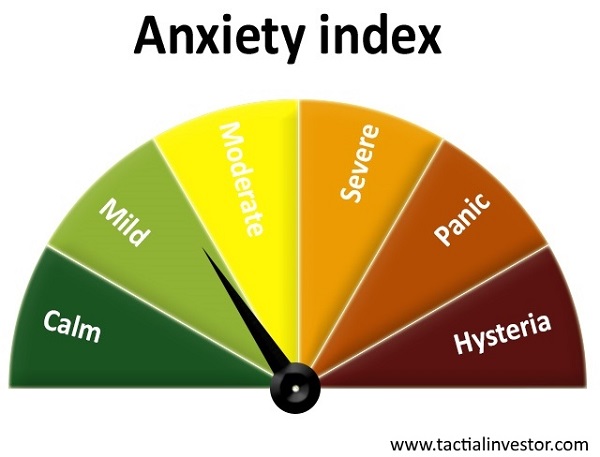
The anxiety index for the past 24 months has oscillated between the severe and hysteria zones. At the moment the gauge is sitting in the mild zone. When we combine this with the fact that more individuals are embracing this market, it suggests that being cautious might for the 1st time in many months be the most prudent form of action. Additionally, the markets are extremely overbought and are begging for any excuse to let out some steam.

The Dow has experienced a new vertical takeoff after the results of the election results were announced; -fast, furious breaks outs are usually followed with substantial pullbacks. As can be seen in the above charts the technical indicators are trading in the extremely overbought ranges and given the massive change in sentiment over the past two months caution is warranted. The risk to reward ratio is not in favour of the average investor anymore. The market needs to let out some steam; a 10% pullback would be quite nice and would pull it back to the point of the current break out-former resistance turned into support. This would be enough to scare the living daylights out of the masses. In this case, we would favour an even stronger correction, perhaps a test of the 200-daymoving average which would put the fear of God in almost 90% of investors and thus creating a splendid buying opportunity for the astute investor. Our goal is not to focus on ideal targets but the mass sentiment, and that is why we have developed a host of tools to monitor the masses one of which we have posted above. If the Dow drops down to 18,000 ranges, but the masses are not fearful, then we would not view the situation as a buying opportunity.
A weekly close below 19,600 will signal that of the 18,200-18,600 ranges is likely. If the markets close below 18,200 on a weekly basis, it is possible they could trend much lower, but we do not want to look that far into the future and will address that hurdle when and if the Dow touches that zone.
Buy the rumour and sell the news factor
The masses panicked when they found out that Trump had won. The fake news media sites started huffing and puffing about the dire consequences the markets would face if Trump won. Several weeks earlier we went on a limb and in an article titled “Mass Psychology states Trump win Equals stock market buying opportunity” we made the following comments.
A Trump win will create uncertainty, and the lemmings will flee for the exits; markets will pull back sharply and viola the same old cycle will come into play. The cycle of selling based on fear which equates to opportunity for those who refuse to allow their emotions to do the talking. Full Story
We repeatedly advised our subscribers to view a Trump win through a positive lens. However, now we feel that the markets have priced in the all the positive factors associated with a Trump win (at least in the short term time frames) and some bloodletting is in order. In other words, it might be time to put the principle of “buy the rumour and sell the news” into use.
Conclusion
When you think about it, everything comes down to perception. Alter the angle of the observation slightly, and you modify the perception. What appears bullish to one could be viewed as an extremely bearish development by another. When it comes to investing the goal should be to determine what view the masses hold whether it is valid or not is irrelevant for the difference between a truth and deception comes down to perception also. If the masses are leaning strongly towards a particular outlook, history indicates that taking a contrary position usually pays off.
The masses have for the first time embraced this bull market. From a mass psychology perspective, this is alone is not a huge negative. Mass Psychology dictates that the masses need to turn euphoric before one abandons the ship. It is not the time to abandon ship, but it is time to take a breather and let the storm clouds pass.
The Dow industrials exploded upwards and have experienced a near vertical move over the past two months. Under such conditions, one should not be shocked if the markets let out a stronger dose of steam than they have over the past 24 months.
One man’s remorse is another man’s reminiscence.
Ogden Nash
….related: Stock Markets: Short Sharp Pullback
Stock Trading Alert originally sent to subscribers on January 12, 2017, 6:54 AM.
Briefly: In our opinion, speculative short positions are favored (with stop-loss at 2,330, and profit target at 2,150, S&P 500 index).
Our intraday outlook remains bearish, and our short-term outlook is bearish. Our medium-term outlook remains neutral, following S&P 500 index breakout above last year’s all-time high:
Intraday outlook (next 24 hours): bearish
Short-term outlook (next 1-2 weeks): bearish
Medium-term outlook (next 1-3 months): neutral
Long-term outlook (next year): neutral
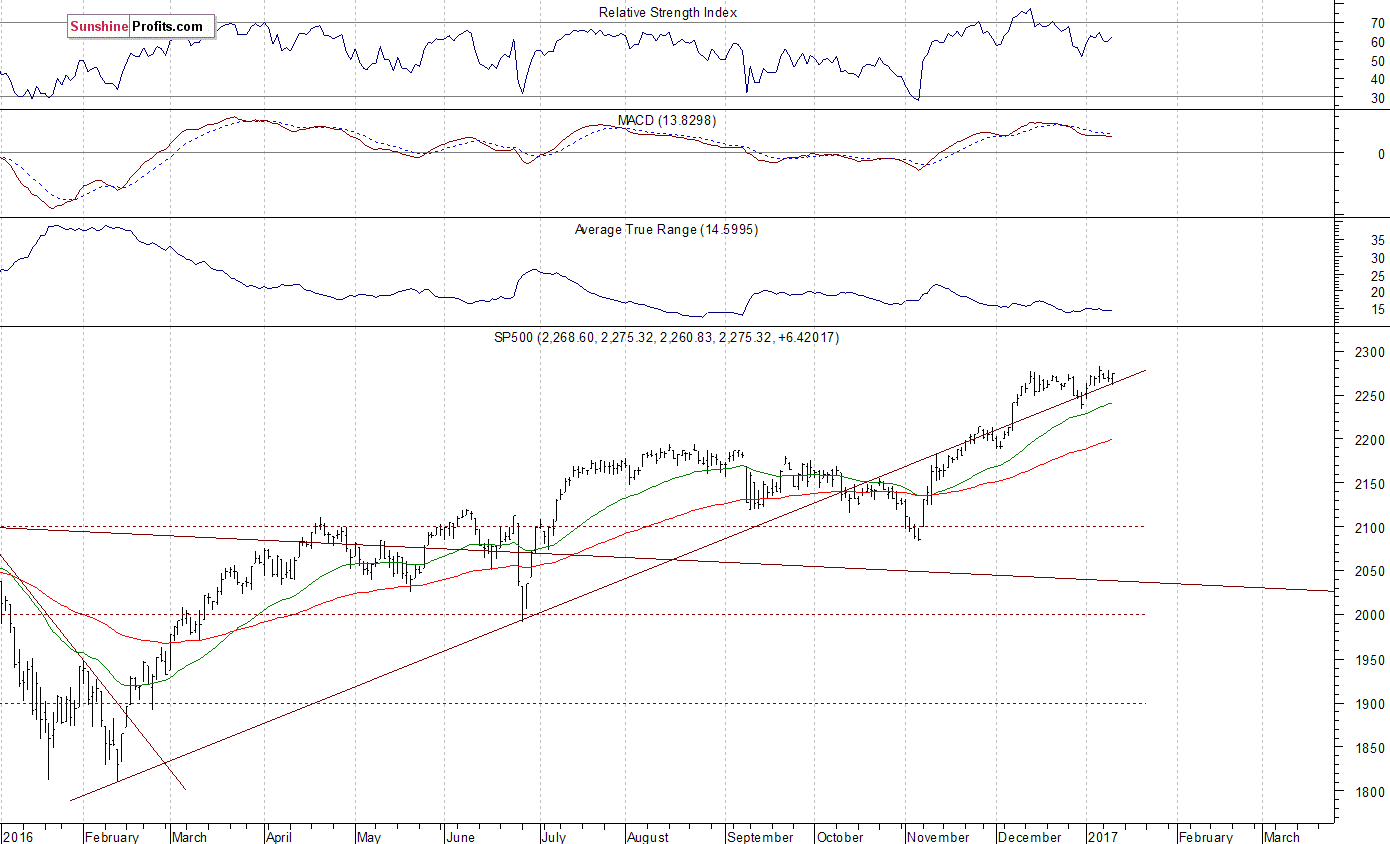
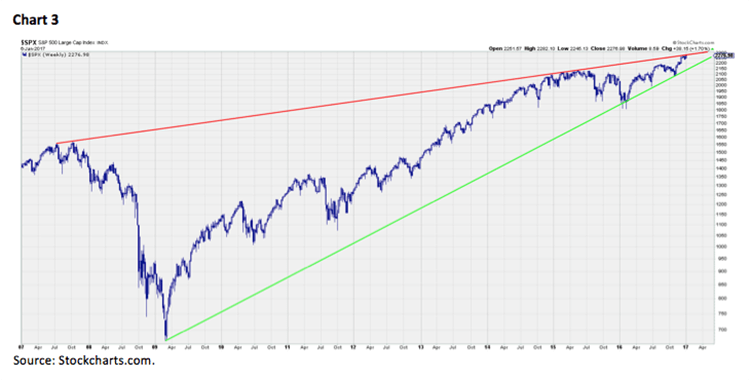
The main U.S. stock market indexes gained between 0.3% and 0.5% on Wednesday, extending their short-term consolidation, as investors reacted to economic data releases, U.S. President-Elect press conference, among others. All three major stocks market indexes continue to trade along their all-time highs. The S&P 500 index remains relatively close to its Friday’s new record high of 2,282.10, and the Dow Jones Industrial Average trades close to round resistance level of 20,000. The technology Nasdaq Composite has reached new record high on Tuesday. Will the market extend its year-long medium-term uptrend even further before some more meaningful downward correction? The next possible resistance level of the S&P 500 index is at 2,300 mark. On the other hand, the nearest support level is at around 2,260, marked by last week’s consolidation. The next support level is at 2,230-2,240, marked by recent local low. We can see a new long-term high within almost eight-year-long bull market from 2009 multi-year of 666.8. However, the index remains within its month-long consolidation. It continues to trade along its medium-term upward trend line, as we can see on the daily chart:
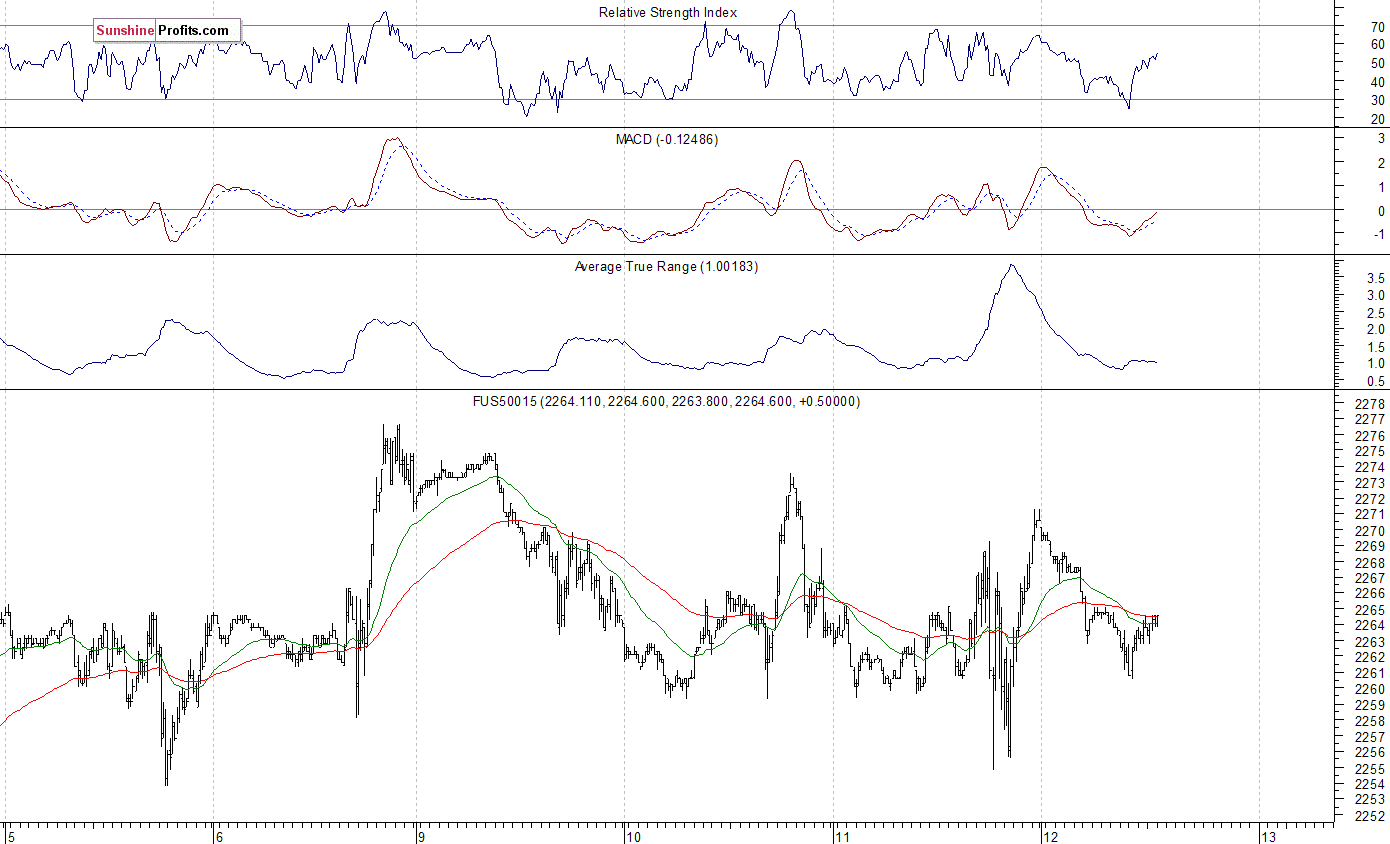
Expectations before the opening of today’s trading session are negative, with index futures currently down 0.2-0.3%, as investors take profits off the table. The European stock market indexes have lost 0.1-0.4% so far. Investors will now wait for the Initial Claims number announcement at 8:30 a.m. The S&P 500 futures contract trades within an intraday consolidation, following an overnight move down. It retraces some of its yesterday’s rally from support level at around 2,255-2,260. For now, it looks like a flat correction within an intraday downtrend. Overall, the market extends its last week’s consolidation along the level of 2,260-2,265. The nearest important level of resistance is at around 2,275, marked by local high. On the other hand, the next support level is at 2,230-2,240, marked by previous local lows. Is this a topping pattern before downward correction of the November – December rally? There have been no confirmed negative signals so far. The futures contract trades along its recent local lows, as the 15-minute chart shows:
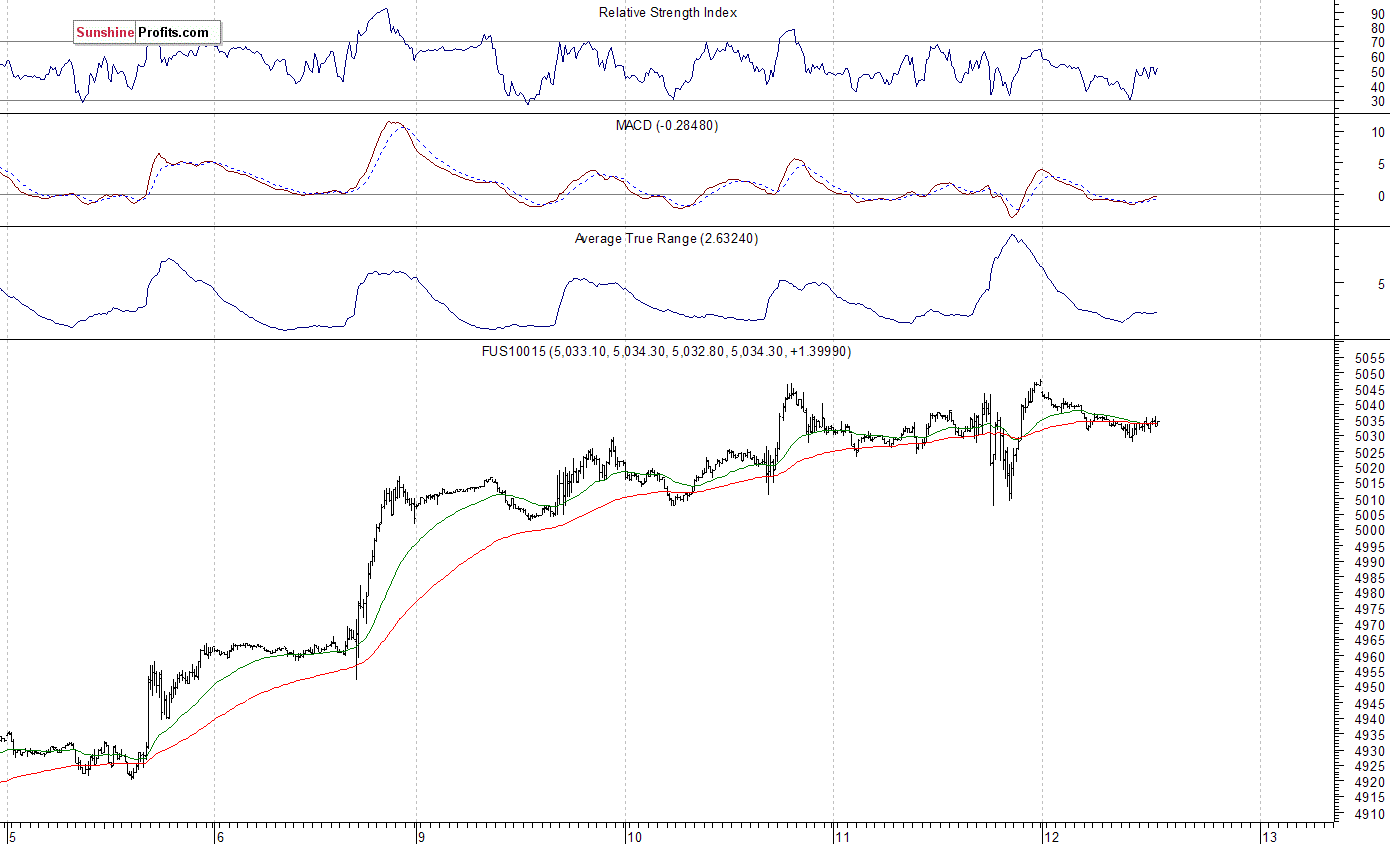
The technology Nasdaq 100 futures contract remains relatively stronger than the broad stock market. It reached new record high yesterday, as it got slightly above its Tuesday’ high, just below the level of 5,050. So, the nearest important level of resistance is at around 5,050. On the other hand, support level is at 4,980-5,000, marked by previous level of resistance. For now, it looks like another relatively flat correction within a short-term uptrend. Will the technology Nasdaq 100 futures contract accelerate its medium-term uptrend? There have been no confirmed negative signals so far. However, we still can see some short-term overbought conditions:
Concluding, the broad stock market extended its short-term consolidation on Wednesday, as the S&P 500 index bounced off support level at 2,260, before closing up 0.3%. Will stocks continue higher before some more meaningful downward correction? There have been no confirmed negative signals so far. We still can see medium-term overbought conditions accompanied by negative technical divergences. Therefore, we continue to maintain our speculative short position (opened on December 14 at 2,268.35 – daily opening price of the S&P 500 index). Stop-loss level remains at 2,330 and potential profit target is at 2,150 (S&P 500 index). You can trade S&P 500 index using futures contracts (S&P 500 futures contract – SP, E-mini S&P 500 futures contract – ES) or an ETF like the SPDR S&P 500 ETF – SPY. It is always important to set some exit price level in case some events cause the price to move in the unlikely direction. Having safety measures in place helps limit potential losses while letting the gains grow.
To summarize: short position in S&P 500 index is justified from the risk/reward perspective with the following entry prices, stop-loss orders and profit target price levels:
S&P 500 index – short position: profit target level: 2,150; stop-loss level: 2,330
S&P 500 futures contract (March 2017) – short position: profit target level: 2,145; stop-loss level: 2,325
SPY ETF (SPDR S&P 500, not leveraged) – short position: profit target level: $214; stop-loss level: $232
SDS ETF (ProShares UltraShort S&P500, leveraged: -2x) – long position: profit target level: $16.35; stop-loss level: $14.00 (calculated using trade’s opening price on Dec 14 at $14.78).
Thank you.
Paul Rejczak
 Jan 10th 8:45 PM
“Despite New Year bullishness from our early January indicators and our expectation for full-month January Barometer gains that will support our modestly bullish 2017 Forecast, a mid-January break in equities is looking increasingly likely. Since 1996 this January break has been more pronounced and more consistent. This trade, last featured in the Commodity Trader’s Almanac 2013, is beginning to set up nicely right now.
The stock market has demonstrated a tendency to retreat after the first of the New Year, especially when there has been a strong fourth quarter gain. Once the New Year begins we often see a profit taking correction. Investors tend to sell stocks to lock in profits in order to defer taxes from capital gains after the New Year begins. Even though the best time to be long the overall equity markets lasts from October through late April, this January break can certainly give short-term, nimble traders a nice return. With stocks struggling to move higher this week this trade is setting up a little later this year.
Also consider that since the New York Stock Exchange began observing the Martin Luther King, Jr. holiday on the third Monday in January in 1998 that the stock market has exhibited strength in the days before the market is closed on that third Monday and weakness after. This also coincides with the pattern of weakness during January’s expiration week. S&P 500 has been down 13 of the last 18 years during the week, while suffering some heavy losses on expiration Friday in 10 of the last 18 years.”
Mark Leibovit
….related: Buy C-R-A-P

 We live in a modern world of acronyms and buzzwords, and the financial industry is certainly no exception. In fact, it may be one of the worst culprits, what with FANG, ZIRP, TINA, BREXIT, QUITALY, BRIC, etc. all entering the lexicon over the last few years. Yet, creating some catchy collection of consonants remains one of the most surefire ways to attract attention in this business since it, admittedly, makes for a great headline and gives strategists like us something fun to write about (“fun” being a relative measure).
Well, now the new eye-catching acronym to watch, according to Tom Lee of Fundstrat is C-R-A-P – Computers, Resources, American Banks, and Phone Carriers – which are all levered to the investment recovery, inflation, and deregulation expected over the next year. Before I comment further on those recommendations, though, I want to point out that I like to follow Tom Lee’s thoughts because, like us, he lets the data do most of his thinking, and, like us, he was one of the few pundits last year who actually saw potential for the U.S. stock market.
related: Tyler Bollhorn: Strength in Weekness

-
I know Mike is a very solid investor and respect his opinions very much. So if he says pay attention to this or that - I will.
~ Dale G.
-
I've started managing my own investments so view Michael's site as a one-stop shop from which to get information and perspectives.
~ Dave E.
-
Michael offers easy reading, honest, common sense information that anyone can use in a practical manner.
~ der_al.
-
A sane voice in a scrambled investment world.
~ Ed R.
Inside Edge Pro Contributors

Greg Weldon

Josef Schachter

Tyler Bollhorn

Ryan Irvine

Paul Beattie

Martin Straith

Patrick Ceresna

Mark Leibovit

James Thorne

Victor Adair