
Stocks & Equities
Gold miners have surged over the last few days with the shiny metal’s recovery in recent sessions. Biotechs have also made a bit of a comeback while metals and mining, east Asian equity indices, and oil services have also done well. Over the past week natural gas has gotten positively demolished, down over 16%. Turkey is down almost 6% as USDTRY continues to skyrocket higher amidst further purges of academics and the media by Erdogan. Oil has also undperformed, dropping on the order of 2%. Most equity indices haven’t dropped that much with the worst US-focused equity ETF we track (DES) dropping only 1.1%.

See Bespoke’s full daily ETF Trends report by starting a no-obligation free trial to our premium research. Click here to sign up

Stock Trading Alert originally sent to subscribers on January 5, 2017, 6:56 AM.
Briefly: In our opinion, speculative short positions are favored (with stop-loss at 2,330, and profit target at 2,150, S&P 500 index).
Our intraday outlook remains bearish, and our short-term outlook is bearish. Our medium-term outlook remains neutral, following S&P 500 index breakout above last year’s all-time high:
Intraday outlook (next 24 hours): bearish
Short-term outlook (next 1-2 weeks): bearish
Medium-term outlook (next 1-3 months): neutral
Long-term outlook (next year): neutral
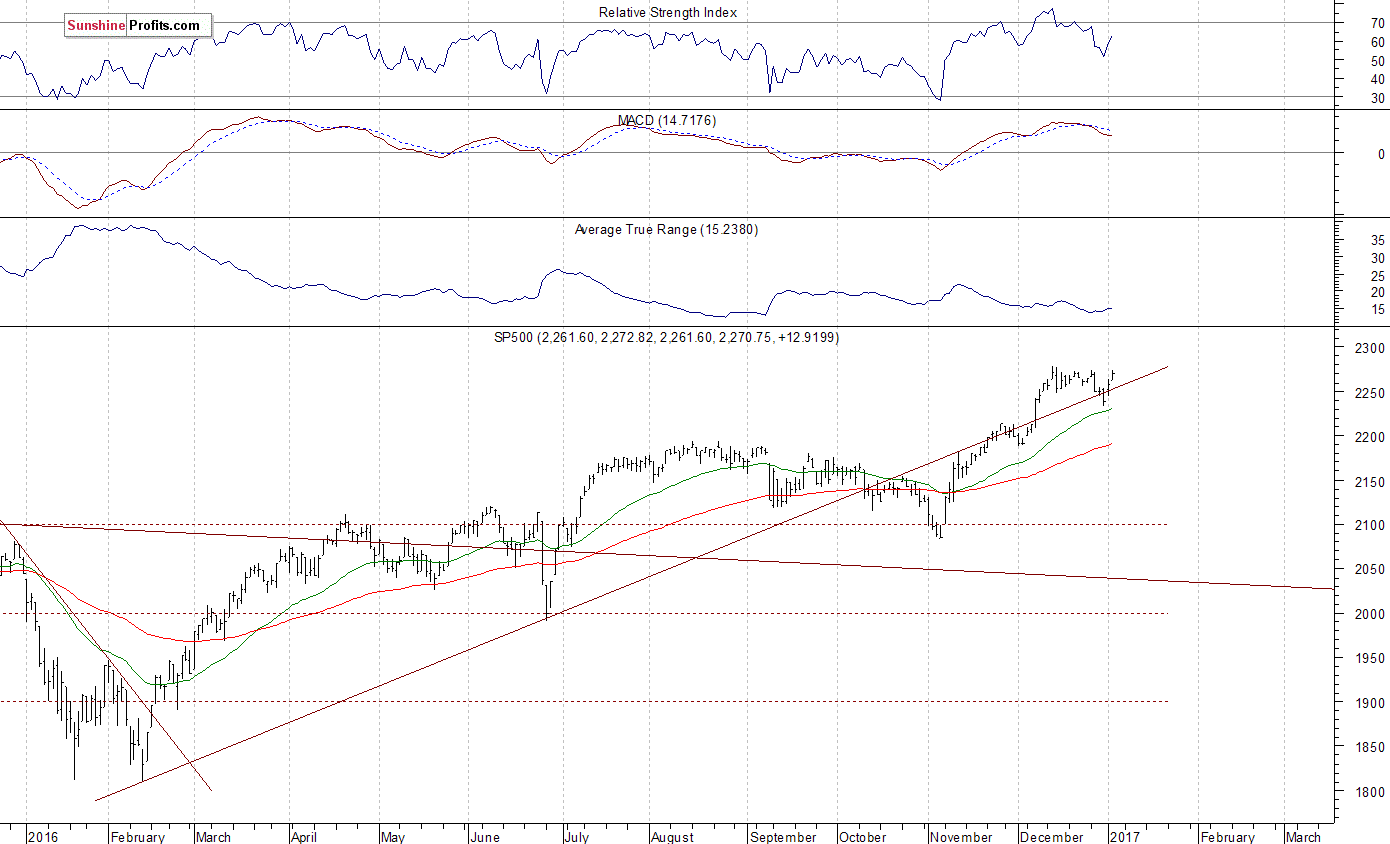
The main U.S. stock market indexes gained between 0.3% and 0.6% on Wednesday, extending their short-term uptrend, as investors’ sentiment remained bullish following Tuesday’s rally. The S&P 500 index continues to trade relatively close to its December 13 all-time high of 2,277.53. For now, it looks like a flat correction within an uptrend off last year’s early November low. But will the market extend its year-long uptrend even further before some more meaningful downward correction? The nearest important level of resistance remains at around 2,280, marked by record high, and the next resistance level is at 2,300 mark. On the other hand, support level is at 2,250, marked by recent resistance level. The next support level remains at 2,200-2,220. The index continues to trade along its medium-term upward trend line. It also trades within a few-week-long consolidation, as the daily chart shows:
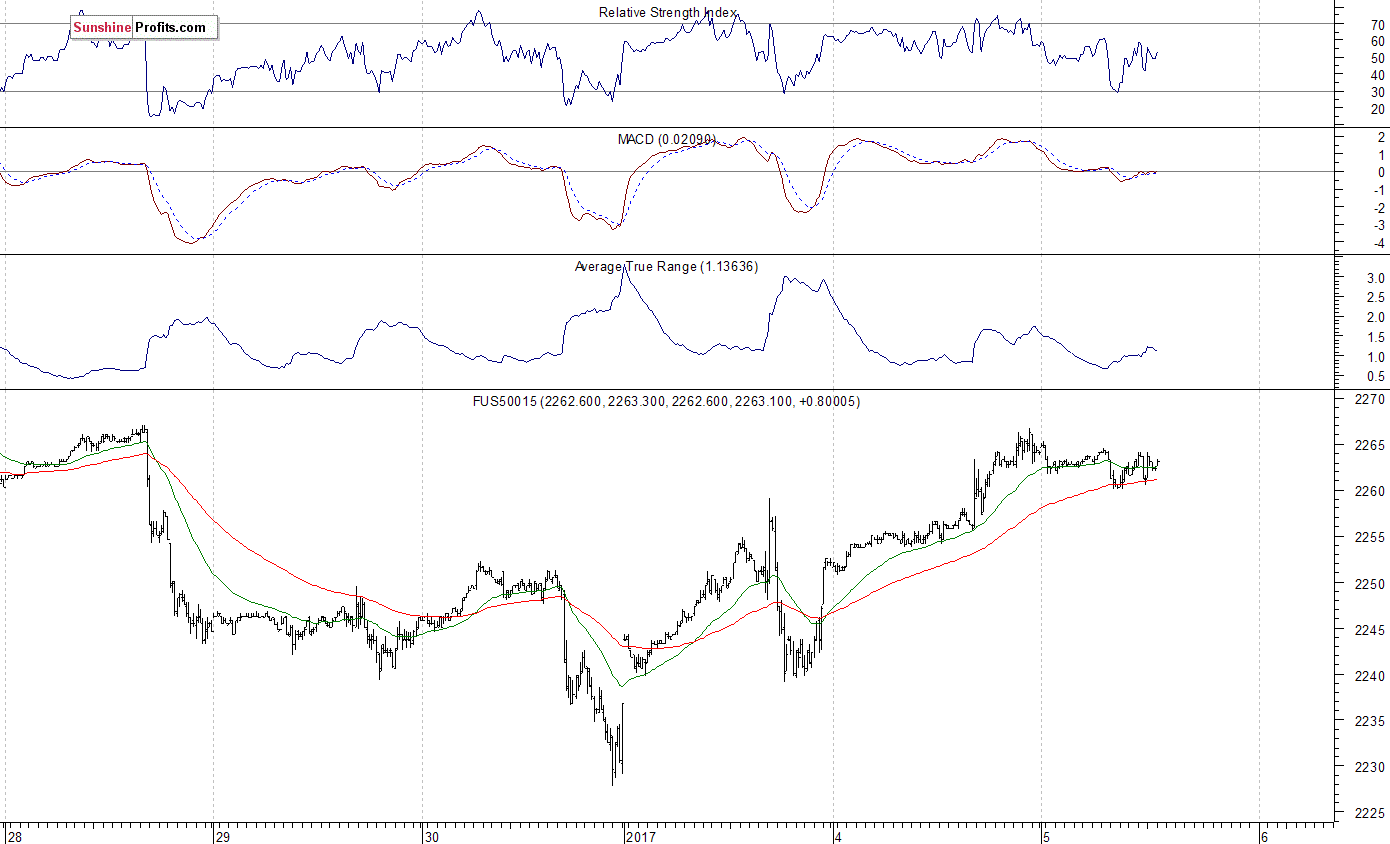
Expectations before the opening of today’s trading session are virtually flat, following yesterday’s move up. The index futures are currently down 0.1%. The European stock market indexes have been mixed so far. Investors will now wait for some economic data announcements: ADP Employment Change at 8:15 a.m., Initial Claims at 8:30 a.m., ISM Services number at 10:00 a.m. The ADP Employment Change report is a measure of the change in non-farm, private employment. It is a relatively important announcement ahead of tomorrow’s monthly jobs data release from the U.S. Bureau of Labor Statistics. The S&P 500 futures contract trades within an intraday consolidation, as investors take some short-term profits off the table following this week’s advance. It continues to trade above Friday’s local highs along the level of 2,250. The next important level of resistance is at around 2,270-2,280, marked by previous consolidation along record highs. On the other hand, support level is at 2,250-2,255, marked by yesterday’s consolidation, among others. The next support level is at around 2,240, marked by recent local low. For now, it looks like a flat correction within a short-term uptrend. However, the market remains below the resistance level marked by December consolidation. Will it break above its record highs?
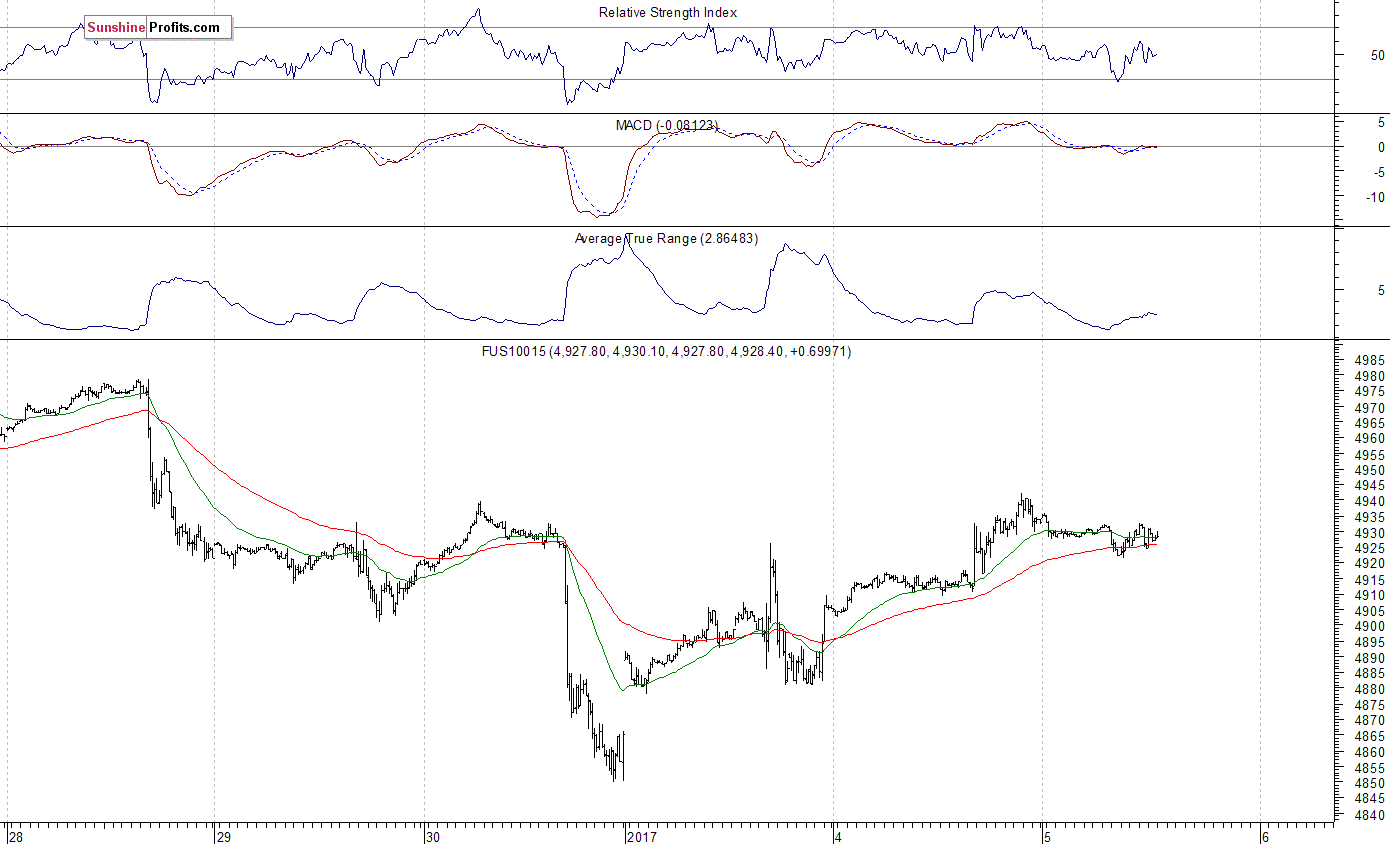
The technology Nasdaq 100 futures contract follows a similar path, as it currently trades within an intraday consolidation. The market has retraced its Friday’s sell-off following a bounce off support level at around 4,850. The nearest important level of resistance is at around 4,920-4,940, marked by local highs, and the next resistance level is at 5,000 mark. For now, it looks like an upward correction within a short-term downtrend. Will the technology Nasdaq 100 futures contract resume its medium-term uptrend and break above round resistance level of 5,000? The technology stocks continue to fluctuate following November – December rally, as we can see on the 15-minute chart:
Concluding, the broad stock market retraced its late December decline over the past two days, as investors’ sentiment improved sharply following global stock markets rally. Is this a new short-term uptrend or just upward correction? The S&P 500 index got back to its December trading range, marked by record high of 2,277.53. We still can see some medium-term overbought conditions accompanied by negative technical divergences. Therefore, we continue to maintain our speculative short position (opened on December 14 at 2,268.35 – opening price of the S&P 500 index). Stop-loss level remains at 2,330 and potential profit target is at 2,150 (S&P 500 index). You can trade S&P 500 index using futures contracts (S&P 500 futures contract – SP, E-mini S&P 500 futures contract – ES) or an ETF like the SPDR S&P 500 ETF – SPY. It is always important to set some exit price level in case some events cause the price to move in the unlikely direction. Having safety measures in place helps limit potential losses while letting the gains grow.
To summarize: short position in S&P 500 index is justified from the risk/reward perspective with the following entry prices, stop-loss orders and profit target price levels:
S&P 500 index – short position: profit target level: 2,150; stop-loss level: 2,330
S&P 500 futures contract (March 2017) – short position: profit target level: 2,145; stop-loss level: 2,325
SPY ETF (SPDR S&P 500, not leveraged) – short position: profit target level: $214; stop-loss level: $232
SDS ETF (ProShares UltraShort S&P500, leveraged: -2x) – long position: profit target level: $16.35; stop-loss level: $14.00 (calculated using trade’s opening price on Dec 14 at $14.78).
Thank you.
Paul Rejczak
Stock Trading Strategist
Stock Trading Alerts

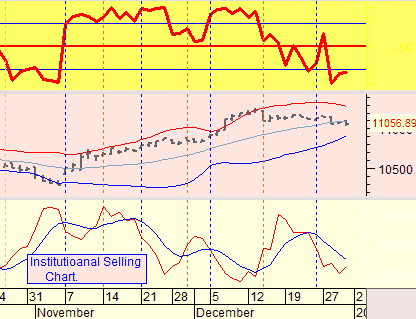
Institutional Selling trend lines showed that it has been trending lower. (Note that less selling is a positive and more selling is a negative.) The top part of the chart showed a small up tick in Upper-Q4 negative territory.
Sounds like good news except that Institutional Buying and Selling activity just showed the first day of Institutional Distribution on Friday’s close.
What now?
This needs be a test day because Institutional Selling had an up tick but it did not make a higher/high tick yet, so Institutional Selling is still technically in a down trend.
2016 was the year I finally decided to codify my niche as a psychology-focused market contrarian, putting the Alice, Red Queen and Rabbit components of NFTRH’s logo right there on my inner forearm, forever.
This is because I love the imagery and themes of NFTRH’s guiding metaphorical story, Alice in Wonderland, and because the weird technical tools I use are generally in service to one thing; being right when the herds are going the wrong way. The concept originally came to me as the markets were beginning their descent into the crash of 2008 as the newly launched market management service needed a view that was apart from the emotional herds then preparing to go down the drain. Alice’s quote (Lewis Carroll), a portion of which occupies my other inner forearm was perfect in this regard…
“If I had a world of my own, everything would be nonsense. Nothing would be what it is, because everything would be what it isn’t. And contrary wise, what is, it wouldn’t be. And what it wouldn’t be, it would. You see?”
2016 was a year that fit NFTRH’s niche to a tee and it is no coincidence that it has been a good one, performance wise (though in full disclosure, the last couple of weeks have taken a chunk of profits back as I give the markets some leeway through the ‘Santa’ seasonal). Let’s take a stroll through 2016 before taking a brief look ahead to 2017.
The year started with the topping pattern (that wasn’t, or isn’t yet) in the S&P 500. For all the world it looked like a top, walked like a top and quacked like a top. But it wasn’t a top! That was proven when SPX rebounded from its lower low to the 2014 and 2015 lows and then rose to cross the 20 and 50 week exponential moving averages back up again. This was similar to the 2011 whipsaw, but on a grander scale. Now of course, the would-be topping pattern may be a left shoulder to a bearish Head & Shoulders pattern in construction. But even if so, the ultimate high could be well higher (ref. the 1998-2000 situation). As of now, the market is bullish. Period.

But considering that Casino Patrons are momo’ing the market and dumb money is strongly over bullish, and the market is over valued (one important valuation metric being the greater interest being paid on ‘risk free’ Treasury bonds vs. the S&P 500) as the media TRUMPets a new promotion; namely bond-eroding inflation as far as the eye can see due to coming fiscal policy changes. The Treasury bond bull market is DEAD trumpet the mainstream financial media. Well, for another view, let’s compare what the public was doing last summer during the NIRP! hysteria vs. today.

Thanks to the data from Sentimentrader we are able to see that herds of dumb money (per the Public Optimism Index or OPTIX) were thundering into Treasury bonds despite historically low yields last summer because… BREXIT!!! and NIRP!!!. This was just in time to create a top in bonds prior to dynamic changes over the second half of the year. Now the public hates bonds because… Trump, because… inflation, because… media. Well, Trump’s election did not cause the bond market to fall apart; it was already bearish after last summer’s big, momentum-fueled sentiment event put the dumb money all in.
Now, who was taking the bearish side of the market last summer? The same people taking the bullish side today; the Commercial Hedgers AKA the smart money. For the sake of space, let’s not cover too much old ground. You can see the Hedgers’ general positioning in the post in which I poked the trend following, rabble rousing media in the eye as it used a simple line drawn by Louise Yamada to make a big declaration in order to get people all worked up (and emotional).
Above we have covered the early part of the year with respect to the stock market’s failure to do what it was ‘supposed’ to do, and some incredible contrarian bond market dynamics in 2016. Now switching back to stocks, we had two great sentiment events this year, which anecdotally at least, seemed to get the max number of players going the wrong way. Those would be the BREXIT and US Election hysterias. Common themes attended both of these events, keeping us on the bull side of the barn. We poked the media in the eye about these promotions as well…
For each situation sentiment was over bearish right into the actual event. The other common theme – for the broad US stock market at least – was that major technical support was completely intact, as we noted occasionally in public and constantly in NFTRH reports. What do they say about an intact uptrend? When pullbacks occur on over bearish sentiment during an uptrend, it is usually a buying opportunity.
Looking at a specific sector, when an industry (in this case Semiconductor Equipment) had positive fundamentals (as we tracked each month) and is technically intact, a bearish sentiment backdrop was a buy, as we noted back in May. AMAT and LRCX came to be our primary Semi Equipment picks.
AMAT Chirps, B2B Ramps, Yellen Hawks and Gold’s Fundamentals Erode
During the time frame of the above linked posts, I was being told that a renowned technology “expert” was exactly opposite my stance, bearish the semis and bullish on gold. You may or may not remember me grousing about that last summer. My belligerence even lost me a long-time NFTRH subscriber…
Today, I note small and large analytical sources falling all over themselves recommending these Semi Equipment companies. Trend followers all…
I would estimate that 90% of what you read in the financial media, whether at the big shops like Bloomberg and Marketwatch or out there in the blogsphere where we little guys think we can add value to your investment theses, is unadulterated trend-following. It’s what sells. And your eyeballs need to be sold.
The financial media complex is not set up to tell you what is likely to happen. It is set up to tell you what has happened or ishappening. From there it will often extrapolate to tell you what will happen, and with current events backing the extrapolation at any given time, 90% of information consumers will take it seriously, forgetting later just who provided the faulty information as it gets lost in the massive buzz of the electronic media industry.
2016 was mainly an exercise in maintaining discipline with respect to technical analysis signposts (most notably, simple support and resistance levels) and discipline from a contrary perspective.
“Nothing would be what it is, because everything would be what it isn’t. And contrary wise, what is, it wouldn’t be. And what it wouldn’t be, it would. You see?”
At this moment in time I cannot tell you whether the S&P 500 will proceed directly to our long-held operating target of 2410 or not. I cannot tell you whether it will get there in our lifetimes or get cut through like warm butter in January.
But that is the whole point; we are at the traditional time of year when the bizarre ritual of crystal ball and tea leave reading is put on display by the financial media as last year’s Wrong Way Corrigans attempt to get it right this year, knowing full well that media consumers do not take the time to go back and check records.
Here is my lone prediction; 98% of these predictions will prove totally bogus and my follow-on prediction is that only 5% of the reading audience will even care or remember come December 26, 2017.
So I’ll leave you with a simple note that in 2016, when the market was over bearish and people thought they knew bearish outcomes were in the offing, the opposite proved true. Today, at the dawn of a new year, sentiment analysis states that increasingly dumb money has made a commitment to what it thinks is a “new secular bull market” in the wake of the supposedly market-friendly Trump election and its fiscal stimulus to come.
NFTRH 427’s Wrap Up segment addressed this…
- The US market went bullish last winter and has remained bullish ever since, with an intervening major support test. We talked about that oncoming test for what seemed like forever, it came about and was successful. The US market is bullish.
- Will it go bearish? The contrary setup is there, with a majority believing fiscal policy will create a new secular bull. Meanwhile, there continue to be sectors that have been out of favor, which may be winners going forward. I’d remain open to continued bulling or a reversal to bearish. It is the market’s decision, not ours.
- But I’d continue to argue that you cannot have a new secular bull market when the old bull market, a short secular or long cyclical bull from 2009, never ended. That was why we gauged the ‘higher low’ major support test. A failure would have ended the bull. Support held and the bull remained intact.
If contrary sentiment analysis paves a way for a future risk ‘off’ view, the likes of Treasury Bonds and Gold, key components of the lowly risk ‘off’ trade, will have their day. I recommend you sit back, relax and let the contrarian signals come in without taking on the pressure and unrealistic expectations of pretending to know. It worked in 2016, after all.
Subscribe to NFTRH Premium for your 30-45 page weekly report, Biiwii.com
The chart for Institutional Buying and Selling activity for last Friday’s close is now posted. If you look at the chart you will see that Institutional Buying had a an up tick and Institutional Selling showing an up tick.
Note the vacillation going on with the up and down Accumulation and Distribution movement.
While Institutional Investors were in Accumulation they were also selling, so be cautious.

also current market sentiment:


-
I know Mike is a very solid investor and respect his opinions very much. So if he says pay attention to this or that - I will.
~ Dale G.
-
I've started managing my own investments so view Michael's site as a one-stop shop from which to get information and perspectives.
~ Dave E.
-
Michael offers easy reading, honest, common sense information that anyone can use in a practical manner.
~ der_al.
-
A sane voice in a scrambled investment world.
~ Ed R.
Inside Edge Pro Contributors

Greg Weldon

Josef Schachter

Tyler Bollhorn

Ryan Irvine

Paul Beattie

Martin Straith

Patrick Ceresna

Mark Leibovit

James Thorne

Victor Adair