
Stocks & Equities
Uncertainty and mystery are energies of life. Don’t let them scare you unduly, for they keep boredom at bay and spark creativity. R. I. Fitzhenry
In September we penned a second article in the Alternative Dow theory series, titled “Dow theory no longer relevant-Better Alternative exists where we stated that the Dow theory as it stood was no longer relevant. Here is a brief excerpt from that article.
The transports topped out in November of 2014, and according to the Dow theory this is a big negative; the Dow industrials should have followed suit. Instead, the Dow soared higher paying no heed to this theory proving to a large degree that this theory has lost its value. After all, it is a theory and the definition of a theory is “a supposition or a system of ideas intended to explain something, especially one based on general principles independent of the thing to be explained.”
That is why way back in 2006 we offered a Dow theory Alternative that has proved to be far more accurate and reliable than the Dow theory. Just to let this sink in, the transports topped out almost two years ago and instead of trending lower the markets have surged to new highs. If you look at the above chart, the Transports appear to be finally gathering momentum and to break out. In the Dow theory alternative, we stated it was the Utilities that lead the way as opposed to the Dow transports, well let’s see if that holds true.
Instead of the markets breaking down, due to the negative divergence between the Dow transports and the Dow industrials, the market after experiencing a very brief shock due to a Trump win, recouped and went on to soar to new highs. For the record, we predicted in September that a Trump win would prove to be an excellent buying opportunity in advance of the development.
From a pure trading perspective, a Trump win would provide contrarian players with an incredibly attractive buying opportunity. Like Brexit, the crowd is bound to overreact as they stampede for the exits, creating opportunity instead of disaster. The experts were dead sure that Brexit was going to create chaos; turns out that the only mess it created was amongst the experts when they were forced to eat their rubbish. Before Brexit, we stuck to our theme that any correction should be viewed as a buying opportunity. Just as Brexit was all bark and no bite; the same phenomenon is likely to play out if Trump wins. All the Naysayers from every crack and crevice will emerge screaming the end of the world and when the world does not end they will be forced to crawl under the rock again. It would be good to keep this saying in mind if Trump wins “dance when the crowd panics and standstill when they jump up with joy”. Regarding who is the better candidate, we will let our readers make that call. Tactical Investor
Now to the million dollar question; is the stock market ready to crash and has the Trump effect run its course?
The simple answer is no; the stock market is not ready to collapse. It is, however, ready to experience a correction in the not too distant future. The correction could range from mild to slightly sharp, but a crash is not imminent. Human nature is such that, it does not favour simple answers, it looks for complex answers even if they are unwarranted.
Let’s start with the Trump effect
The only reason we brought Trump up in the article we penned in September was because the sentiment was intensely negative; we knew that if he won, it would create a shock effect, similar but stronger in nature than Brexit. As the trend was up, such an event had to be viewed through a bullish lens. The Trump effect falls more along the lines of Gossip, so we are not going to delve into it much
There is a mania gripping the markets, which is almost irrational in nature to some degree. Some Individuals seem to have assigned Trump with a demigod status, and they believe that he can solve all their problems. This is an impossible task for anyone, so there is bound to be some disappoint going forward. Whether the disappointment will be mild or extreme is something that time will tell. He has done a few things that seem to resonate well with his followers so until they abandon him; it is likely the Trump effect will run for a bit longer. If he sticks to his promise of getting rid of red tape, lowering corporate taxes and getting rid of two rules for every new rule created, it should provide an environment that is conducive for business. The markets are forward looking beasts, and they view Trump through a bullish lens; never fight the trend, unless you want to experience the bitter feeling of defeat.
Is the Dow Theory irrelevant and what lies in store for this market going forward?
We still lean to the argument that there is a better alternative than the Dow Theory and in fact, we think the Dow theory as it stands is entirely irrelevant. You can read the article we listed above if you want to find out why we feel this way. Regarding the second question, we briefly addressed above, and as stated while the Crowd is not as nervous as it was back in October and early November; the masses are not euphoric. Current sentiment data seems to confirm this outlook. However, the main reason the markets will not crash is that the trend is still up and until the trend changes direction; all sharp pullbacks should be seen through a bullish lens.
As we alluded to in the alternative Dow Theory article, the Dow utilities lead the way up and or down.
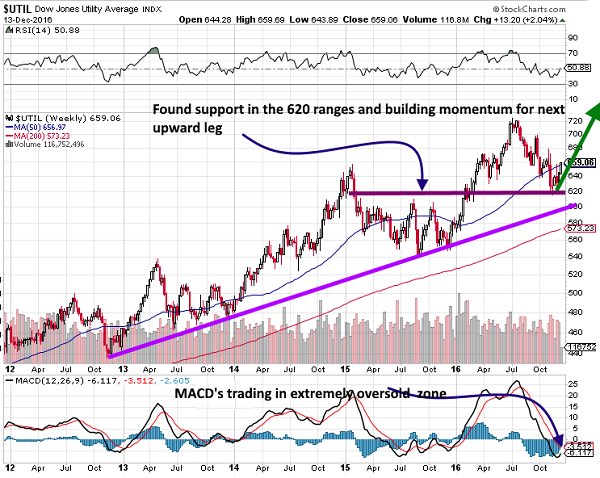
It looks like the Utilities are coiling up to break out again. This suggests that the Dow industrials will follow in their footsteps. If you look at the utilities, you will see that in general, it tends to lead the way up and down and is a better barometer of what to expect from the markets than the Dow transports. The utilities are coming out of a correction, so this means that the Dow is likely to experience a correction sometime in the 1st part of next year before rallying higher. The correction should fall in the 5-10% ranges. We use the utilities as a secondary indicator. Our primary indicator is the trend, and as the trend is up, we would view a strong pullbacks as a buying opportunity.
Tactical Investor Proprietary Sentiment indicators

The last time we put this data out publicly, the anxiety index was trading close to the Hysteria zone. Granted it has advanced quite a bit since then, but the gauge is still far from the calm or euphoric zone. The masses have still not embraced this market, and until they do, sharp pullbacks need to be treated as bullish developments.

The number of individuals in the bullish camp has risen in comparison to the early November and October data, but the combined score of individuals in the neutral and bearish camps is still higher than those that are bullish. We would only start to get nervous when the number of bulls surges past the 60% mark; until then the path of least resistance is up. Individuals in the neutral camp are bulls with no cajones or bears with no teeth, and they are just waiting for the perfect moment to take another beating.
Conclusion
Yes, this bull market will experience a back breaking correction one day, but that day is still not upon us. No bull market has ever ended without the masses jumping in; in other words, the masses need to turn euphoric. Some of the most famous and foolish naysayers out there, love to use the term “the truth hurts” when talking about the markets. Does the truth really hurt; is the truth not supposed to liberate you or set you free. The most egregious of these naysayers will hide behind such names, and come out with fantastic proclamations that make no sense whatsoever and sound more like the ravings of a lunatic. Instead of reacting to such individuals in a negative manner, think of them as the best contrarian indicator out there. This is valuable data for one day these fools will embrace this market, and when they do, you will know the end is near. Disqus is a good source if you are looking for individuals of such a calibre.
The Dow utilities are getting ready to break out, and as they lead the way up, it is likely that the Dow will continue to follow in its footsteps. Like the Utilities the Dow is likely to experience a correction before trending significantly higher, and this is most liable to occur in the 1st quarter of next year.
The trend (as per our trend indicator) is still bullish, and it is showing no signs of weakening. Until it changes direction, the market is not likely to crash. We can already tell you what will happen the moment the markets start to pullback. They will sing the same song; something we had already described in past articles when we discussed Brexit, the possibility of a Trump win, etc. The naysayers will rush out once again proclaiming that all hell is going to break loose. They are not students of history and refuse to learn from it; instead, they seem almost to take masochistic pride in repeating the same mistakes over and over again, in the hopes that they will be correct. One day they will be right, but by that time anyone who had listened to them would have been bankrupted several times over. As the markets drop, the Dr’s of Doom will scream louder and louder; momentarily it will appear that these guys have finally struck Gold. Then the brief period of joy will vanish, and their songs of joy will turn into pain as the market suddenly puts in a bottom and rallies upwards. Like cockroaches, they will disappear in the woodwork waiting for the next moment to sing the same miserable tune of gloom. Don’t fall for this rubbish; in fact,even rubbish has some value; it can be used as compost.
A fool despises good counsel, but a wise man takes it to heart.
Confucius


![]()
In This Week’s Issue ending December 12, 2016:
- Weekly Commentary
- Strategy of the Week
- Stocks That Meet The Featured Strategy
- Stockscores’ Market Minutes Video – Why Trade Normal
- Stockscores Trader Training – How Much Can a Day Trader Make
- Stock Features of the Week – Intraday Pullback Day Trade
Note: some of you have received a course email from us by mistake today, please ignore.
Stockscores Market Minutes – Why Trade Normal?
Stocks that go up consistently over time usually start their trends with abnormal price and volume action. This week, I describe this concept and how it can help you trade better. Plus my regular weekly market analysis and the trade of the week on $NE. Click Here to Watch
To get instant updates when I upload a new video, subscribe to the Stockscores YouTube Channel
Trader Training – How Much Can a Day Trader Make?
How much can you make trading the stock market? This is the question I get asked the most. It is not a whole lot different to how much does a doctor or lawyer make? How much does a professional athlete make? The answers to these questions have a huge variance depending on the situation and it is no different for traders. The short answer is that it depends on market conditions, trader skill and capital available. However, I can give you some greater detail to help you understand the economics for my approach to active trading.
To give you the long answer to the question, there are a few concepts that have to be defined. First is reward for risk, the metric that I use to measure profitability.
Here is how reward for risk works. First you have risk tolerance, how much you are willing to lose on any one trade. Since trading is game of uncertainty, we must play the game knowing that we will lose some of the time. There is some randomness to the market so you can’t control when you will lose but you can have some control over how much you will lose when you are wrong. By exiting a position when the loss level gets to a certain point, you put a cap on the size of the loss.
Suppose you buy a stock at $10 and from your analysis of the chart, you think it is appropriate to plan to lose if the stock falls to $9. In this case, your risk per share is $1. If your risk tolerance is $100, then you should buy 100 shares. If your risk tolerance is $1000 then you should buy 1000 shares.
If you then sell the stock at $15, you will have earned a reward of $5 per share and a reward for risk of 5. With a risk tolerance of $100, you make $500 while a risk tolerance of $1000 gives you a reward of $5000. The reward for risk of 5 is the same whether you risked $100 or $1000.
Next, we have to consider the capital required for a level of risk tolerance. Using the same example, a $100 risk tolerance required the purchase of 100 shares of a stock that cost $10 per share. The position size is $1000. If you take $1000 of risk, you buy more shares and the total cost is $10,000.
It is possible to use margin when trading which means you put up a portion of the cost of the position and the brokerage will loan you the rest. Using margin carries more risk since it increases the potential percentage loss you can incur but it also increases the percentage gain. In general, brokerages will lend you up to 2/3 of the position size when day trading and half of the position size when you hold the position overnight. Holding stocks over night or for multiple days is riskier than getting in and out in the same day.
So, if we assume in our example that we are day trading the stock, we will only have put up one third of the capital to take the position. For $100 of risk, we buy 100 shares at $10 which is a position size of $1000. With 3 to 1 margin, we have to use $333 of our own capital with the brokerage carrying the rest of the cost. With $1000 of risk, we would need $3333 in capital for this position.
A very general rule is that you can take your risk tolerance and multiply it by 100 to determine how much capital you will need to trade (assuming you can use 3 to 1 margin). So, a $100 risk tolerance requires at least $10,000 in capital to carry the 3 – 5 positions that I would typically carry each day.
This rule is dependent on market conditions, there are times when the action in the market is in lower priced stocks which require much less capital than when the action is in the high priced stocks which tend to be less volatile, and therefore require more capital.
For example, November was a more capital intensive month. The US election caused a good rally larger cap companies that are higher priced and take more capital. In November, my quick calculation was that you needed more like 200 times your risk tolerance to take the trades that I found.
I will use November to answers the question of how much you can make day trading. To keep it honest, I will use the trades that I identified in real time for subscribers to my live trading webinars that I ran for two hours each morning. These trades were called out as I found them with an audience of traders who watched my screen via webcast (this is a service that anyone who has completed my Active Trader course on Stockscores can subscribe to). For simplicity, the results I recorded were simply holding the positions taken in the first two hours of the day until the close. I did not include trades that I took after the first two hours or positions that I sold before the close. Doing so would have improved the overall performance.
In November, these trades earned a cumulative reward for risk of about 115. This means $100 of risk should have earned a gain of $11,500. $1000 of risk earns $115,000. It would take about $20,000 to make $11,500 and $200,000 to make $115,000 (since the capital requirement in November was about 200 times the risk). This capital requirement is a rough estimate, I did not look at each day to figure out the exact amount of capital required. Trading commissions and slippage would have some cost but are not a large impact on this performance.
So, on a percentage basis, this is a very nice return. However, a few caveats. First, these economics work so long as your risk tolerance does not get too high. The market has to absorb your buy and sell orders in a short amount of time so trying to apply my strategies with $10,000 of risk per trade gets more difficult since it is harder to move in and out of larger positions. Basically, these economics make sense using $1 million or less of capital.
Second, market conditions have a big effect on the amount of trading opportunities and the profitability of each trade. November was poor the first week leading up to the US election, good after the election, then slow for a few days and then good going in to December. It was not a great month overall but pretty good.
By contrast, October was probably the worst month I have seen in years. Traders were nervous ahead of the US election which meant there was a lack of commitment by them. This lowered the success rate of my strategies but also the profit per trade. Overall, October had a losing reward for risk of 11. Not really a big loss for a bad month but still a loss.
This highlights an important point. Trading is not like other jobs where you expect a consistent stream of income. It tends to be streaky, meaning you can have a slow period followed by a strong period. There are times when one sector is strong and then it will go very cold.
This means you have to be flexible and willing to go where the action is. My approach is to always focus on abnormal activity so I am always trading where there is action. A trader who focuses on trading a certain industry group or price range of stocks may find their performance very volatile compared to what I might do.
Trading is a skill that, like anything else, takes time to develop. I can teach anyone willing to work hard my strategies and processes but that does not mean they will be successful. It is no different than taking piano lessons, going to medical school or playing hockey. You only get good at it with time and practice. Getting good training will help you learn quicker and be more effective but you still have to do the work.
Need some motivation? Financially, traders are the highest earners of any profession – traders managing large funds can earn over a $billion a year. From a lifestyle perspective, you can do it anywhere that has a reliable internet connection. Trading does not require you be good looking, charismatic or physically capable. There is no racism or sexism, the market does not care what your background is whether you went to a fancy school. All that matters is how you buy and sell. I think it is the perfect career but remember one very important thing.
Trading is simple, but it is not easy.

This week, I highlight an example of the kind of day trades that I look for. Too late to consider this now, just an example of what I was doing in the November study that I reference this week.
1. AKAO
Entry on AKAO at 10:40ET. Entry price is $8.79, support at $8.43 for a risk per share of $0.36. At time of writing the stock is at $11.50 for a gain of $2.71, an RR of 7,5 ($2.71/$0.36).

References
- Get the Stockscore on any of over 20,000 North American stocks.
- Background on the theories used by Stockscores.
- Strategies that can help you find new opportunities.
- Scan the market using extensive filter criteria.
- Build a portfolio of stocks and view a slide show of their charts.
- See which sectors are leading the market, and their components.
Disclaimer
This is not an investment advisory, and should not be used to make investment decisions. Information in Stockscores Perspectives is often opinionated and should be considered for information purposes only. No stock exchange anywhere has approved or disapproved of the information contained herein. There is no express or implied solicitation to buy or sell securities. The writers and editors of Perspectives may have positions in the stocks discussed above and may trade in the stocks mentioned. Don’t consider buying or selling any stock without conducting your own due diligence.
By one measure, the Dow Industrials Index is now at its second-most ‘overbought’ level since 1980. The measure I’m referring to is the 14-day RSI (Relative Strength Index), a short-term momentum oscillator shown in the bottom section of the following Dow chart.
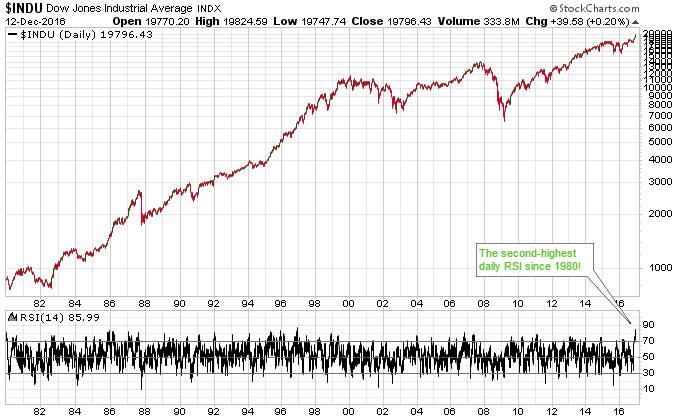
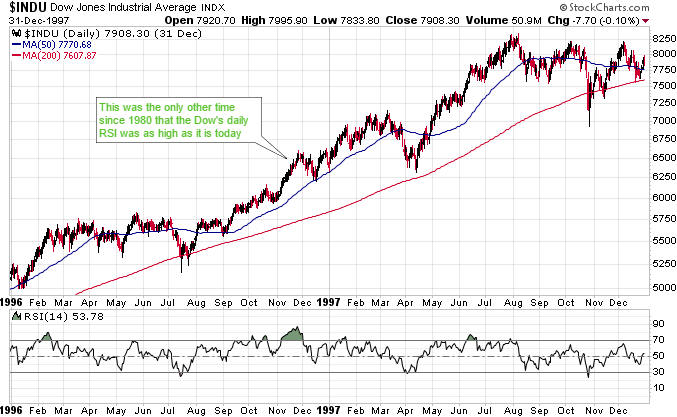
Being the most something-or-other (the most overbought/oversold, optimistic/pessimistic, etc.) since a distant past time often isn’t as important as it sounds. For instance, the only time since 1980 that the Dow’s daily RSI(14) was as high as it is today was in November of 1996 (interestingly, almost exactly 20 years ago), but nothing dramatic happened during the days, weeks or months that followed the November-1996 momentum extreme.
As illustrated below, a pullback to the 50-day moving average (MA) got underway within a few days of the momentum extreme, after which the Dow resumed its long-term advance. There was a more significant short-term pullback (to the 200-day MA) a few months later and an intermediate-term correction a few months after that (more than 8 months after the momentum extreme), but the bull market continued for another 3 years.
A short-term momentum extreme occurred at the price peak that was followed by the October-1987 stock market crash, but it is a lot more common for such extremes to be followed by nothing more serious than a routine multi-week correction. With measures of market breadth pointing to a 6-12 month extension of the bull market we probably won’t get anything more bearish than a routine multi-week correction within the next couple of months, although I admit that the near-vertical rally since the Presidential Election has me ‘on edge’.

 Stock Valuation in the Age of Trump
Over & Under
Tech Bubble Redux
We Are Overdue for a Correction
Something’s Gotta Give
Investing in a Rising-Interest-Rate World
Hands Off the Wheel
Some Thoughts on the Trump Rally
New York and Florida
“Price is what you pay. Value is what you get.”
– Warren Buffett
“There is no safe store of value.”
– Alan Greenspan
“In the short-run, the market is a voting machine – reflecting a voter-registration test that requires only money, not intelligence or emotional stability – but in the long-run, the market is a weighing machine.”
– Attributed to Benjamin Graham by Warren Buffett in a 1993 Berkshire Hathaway letter
The actual quote, from Graham’s 1934 book Security Analysis, is:
In other words, the market is not a weighing machine, in which the value of each issue is registered by an exact and impersonal mechanism, in accordance with its specific qualities. Rather we should say that the market is a voting machine, whereon countless individuals register choices which are partly the product of reason and partly the product of emotion…. Hence the prices of common stocks are not carefully thought out computations, but the resultant of a welter of human reactions. The stock market is a voting machine rather than a weighing machine. It responds to factual data not directly, but only as they affect the decisions of buyers and sellers.
Stock Valuation in the Age of Trump
The presidential transition brings new surprises almost every day. Last week Donald Trump’s spokesman revealed, via an offhand comment, that President-Elect Trump had sold all his publicly traded stocks back in June. That’s months before he won the election and faced conflict-of-interest questions.
Did Trump time his exit right? So far, the answer looks like “no.” The S&P 500 Index is now higher than it was at any point during June. Much of that gain came in the furious post-election Trump rally. Nonetheless, Trump has other concerns now, so being out of stocks is probably the right position for him.
As for the rest of us, we have decisions to make. With market benchmarks touching new all-time highs and both fiscal and monetary policies at a turning point, asset allocation is critical. Do you have too much exposure, or not enough?
In the long run, the answer depends largely on valuations. Today we’ll look at stock valuation several different ways, see what history tells us about the future, and then think about how to react. There are good reasons to think that the Trump rally could morph into the stereotypical and expected Santa Claus rally. Toward the end of the letter, I will comment on why. It’s actually kind of a rational process. And then what? My conclusion is going to be (drum roll, please) that you should currently be long the stock market, but that your asset allocation model should be changed dramatically. I am finishing up a white paper this month that will be ready in January, in which I talk about portfolio construction and asset allocation.
As I look out over the coming years, I am convinced that we’ll see the blowing up of the biggest bubbles in history, including those of government debt and government promises, and not just in the US but all over the world, leading to an eventual global crisis of biblical proportions – although it isn’t clear what the immediate cause of the crisis will be. Right now I am looking at Italy with intense focus.
Before we plunge in, I want to remind you that our Mauldin Economics VIP offer will expire shortly. Your invitation to join us is waiting for you here.
Let’s start with some basics. Stocks are fractional ownership shares of a business. Each share’s value is a function of the entire company’s value. The company, in turn, is worth the present value of its anticipated future profits, relative to other alternatives. We say “anticipated” future profits because we can’t know for sure what they will be. This uncertainty is why stock prices fluctuate. The amount buyers will pay changes as they acquire new information about the company’s circumstances.
(The same basic model holds for shares in hedge funds or bonds or almost any other investment. Your investment represents the potential to participate in a future stream of returns.)
The most common way to measure valuation is with the price-to-earnings ratio (P/E). How much will you pay today for the right to own future earnings? If you expect earnings to be $10 per share per year, and you’re willing to pay $100 for a share, the P/E ratio or “multiple” is 10.
(A brief aside: That number may seem quite high if you’re the owner of a non-public small business. If your business earns $100,000 a year, can you sell it for $1 million? Probably not. You might get 3x earnings or 5x earnings. The difference has to do with the liquidity and capital markets access that go with being a publicly listed company. That’s worth a lot. If there were two otherwise identical businesses and only one was publicly traded, the public one would be worth at least twice as much as the private one. Maybe more. Which is the reason that many private equity funds buy a number of related small businesses until they have scale and then take them public. That’s called a rollup. The act of going from private to public produces a large-multiple return. At least that’s what the private equity investor hopes.)
Analysts compile P/E and other indicators from many companies to give us valuation metrics on entire markets and indexes. This is where we get opinions like “The market is overvalued” (or undervalued). You can see overvaluation and undervaluation in this chart from my friend Ed Easterling of Crestmont Research.

The red line is the combined P/E ratio of the S&P 500 as originally reported. The green and blue lines are adjusted Crestmont and Shiller versions, which occasionally diverge. The P/E ratio spent most of the last century between 10 and 25. The times it went below 10 correlate with market bottoms, i.e. “undervaluation,” while the times it spiked over 25 were “overvalued” manic tops.
You might think that the P/E would be a pretty good timing indicator. That’s true for very long periods. The problem is that P/E ratios can stay undervalued or overvalued for years. They can also go to extremes well below 10 and well above 25 and stay there for uncomfortably long spans. Keynes had it right when he said, “The market can stay irrational longer than you can stay solvent.”
Presently, all three P/E versions are near or above 25, indicating overvaluation. This doesn’t mean the end is near – though it could be. But it does suggest that we are not at the beginning of another long-term bull market. The next chart illustrates the past and present trend in a different way.
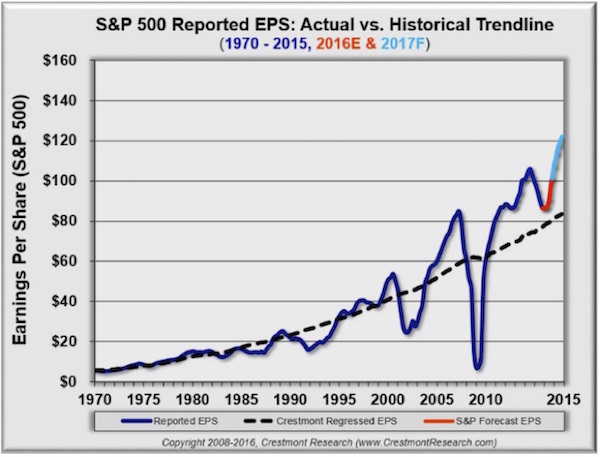
Direct your attention to the dashed line. It’s Ed’s long-term earnings baseline, which he adjusts to reflect the relationship of earnings to economic growth. Reported earnings per share go below the baseline during bear markets and above it in bullish periods. Currently it is way above trend and is projected by S&P and many others on Wall Street to become even more so.
Again, this indicates that the market is at the very least fully valued and more likely overvalued. And again, we can’t rule out its becoming even more overvalued. But at some point, earnings and the baseline will converge again. Knowing when and how they will do so is a different matter.
For another view on valuation, let’s go to Steve Blumenthal of CMG Capital Management. Steve’s On My Radar newsletter is both free and priceless, partly because he subscribes to the very expensive Ned Davis Research (NDR) and shares some of its best analysis.
We’ll see something from NDR in a minute. First, I want to highlight what Steve calls the Buffett Indicator, so-called because Warren Buffett once termed it the best single valuation measure he knew. That’s high praise from the Sage of Omaha.
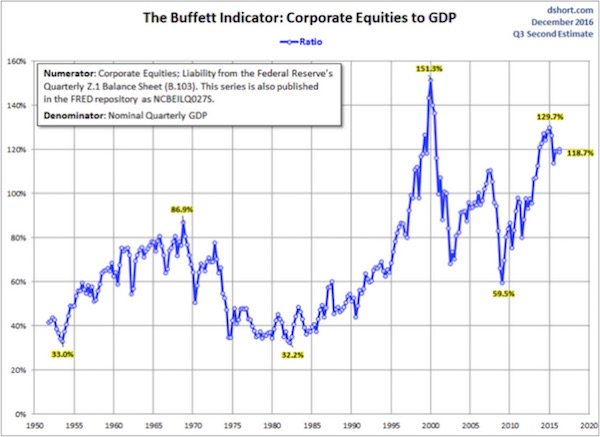
The low points in the chart coincide with the beginning of long-term bull markets in 1954, 1982, and the present one that began in 2009. Likewise, the high points mark the beginning of painful losing periods.
The interesting thing here is that right now the Buffett Indicator, while down from its late 2014 peak, is still higher than it was before the 2008 financial crisis. That should not be encouraging if you’re a bull. Buffett himself said the 70%–80% area of this indicator was the zone where buying stocks was likely to work out best. Presently we are way above that.
I will add one word of caution regarding this indicator: It assumes that GDP remains a meaningful statistic, even though the economy has changed considerably in recent decades. I’ve written about the quirks and vagaries of GDP before. We still use GDP because we have nothing better, but take it with a grain of salt if you’re using it as part of a timing decision.
Steve’s next chart is from Ned Davis and shows us the S&P 500 median P/E back to 1964, which is 16.9 (dotted green line). The distance we are above or below the median is a valuation clue.
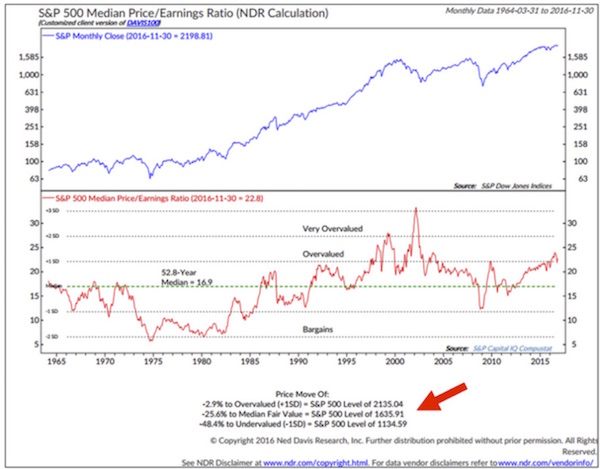
By this standard, “fair value” of the S&P 500 is 1635.91 (red arrow). We’re well above that now. NDR considers one standard deviation over that level as “overvalued,” which would be 2135.04. At 2259.5 as I write this, we’re getting deeper into overvalued territory.
Could the market get more overvalued? Absolutely. It did in the tech bubble. And for reasons I will outline later, price-to-earnings could be dramatically reshaped in the near future. So again, the present level doesn’t necessarily mark a top, but it does suggest caution… and possibly a lot of caution, depending on the political winds or the whims of the new Republican leadership. Optimism, deserved or not, about the US situation aside, Europe’s or China’s having a serious crisis could throw the world into a global recession that would mean a recession in the US. A serious bear market, which is always the result of a recession, will not simply push the S&P 500 back down to fair value; the S&P will keep falling into undervalued territory, which NDR marks at 1134.59. That’s around a 50% drop from the current level. Gulp.
Steve’s next NDR chart takes some explaining. It shows the percentage of household financial assets invested in stocks (blue line) versus the S&P 500 total return for the following 10 years (dotted line). Notice that the right axis is inverted and the dotted line tracks pretty close to the solid blue one. The correlation is 0.91, which is extraordinarily high. What the chart shows us is that a higher percentage of household assets in equities points to a lower annualized return over the next 10 years.
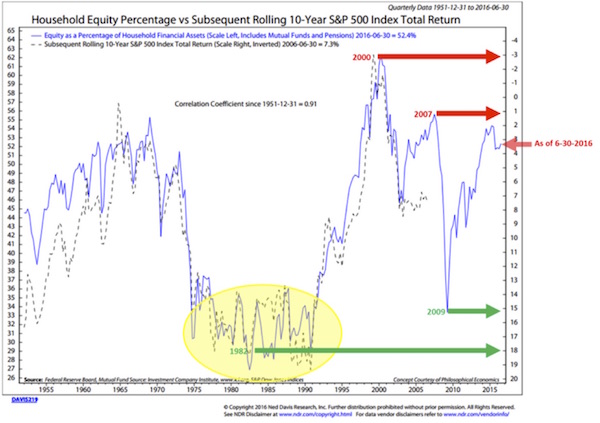
Note the green arrow at the 2009 low. It points off to the right scale just below 15. That suggests that someone who bought stocks at that low point and holds them until 2019 will realize a roughly 15% annualized return.
That’s the good news. The bad news is that the red arrow at 6-30-2016 means that the 10 years ending 6-30-2026 should produce a 3.25% annual gain. That’s not awful, of course, but it is nowhere near the 7% or more that many pensions and insurance companies think they can earn on their portfolios – and since we all know that bonds earn less than equities do, they are really hoping to get closer to 10% on their equity portfolios. It’s therefore a problem for everyone, stock investor or not. Your taxes may have to make up the difference.
(Sidebar: Speaking of pensions, I’m extraordinarily distressed about the Dallas Police and Fire Pension Board fund disaster that has been recently revealed … after I bought my home in Dallas. To completely make up the funding shortfall could require a doubling of my already high property taxes. When people talk about Texas being a low-tax state, that’s because they typically don’t pay attention to property taxes, which are much higher here than in most other states.)
We Are Overdue for a Correction
Since I’m blatantly borrowing from my friend Steve Blumenthal, let me show yet another piece of good research that he included in yesterday’s letter. Bottom line: We are way overdue for a correction. Again, our situation is not the worst it’s ever been, but we are beginning to bump up against historical lines in the sand. Here’s the chart, which shows the number of days before the start of 5%, 10%, and 20% corrections.
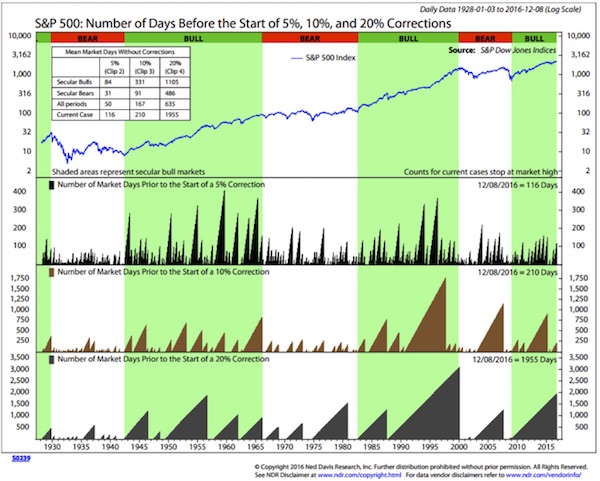
Here is how you read this chart:
The top section shows the history of the S&P 500 Index from 1928 to present.
The next three sections show the number of days prior to the start of 5%, 10%, and 20% corrections. Think of this as a study of history. It is normal to get corrections in the markets. Let me note that Ned Davis thinks a secular bull market began in 2009. I think history is going to show that not to be the case. I think we are still in a very long-term secular bear, although there has been a clear cyclical bull market since 2009. I think the next global recession (hopefully not a depression) will potentially give us a vicious bear market that will mark the end of this secular bear. However, that is neither here nor there as far as the data Ned Davis presents.
You can see that it has been 116 days since we had a 5% correction. Since 1928, the average number of days before a 5% correction occurred was 50. In secular bull periods the average number of days was 84. In secular bear periods the average number of days was 31.
Note that we have been 210 days without a 10% correction. Since 1928, the average number of days before a 10% correction occurred was 167. In secular bull periods the average number of days was 331, while in secular bear periods the average number of days was 91. (This is where the difference between being in a secular or a cyclical bull market becomes pertinent.)
It has been 1955 days since we suffered a 20% correction. Since 1928, the average number of days before a 20% correction occurred was 635. In secular bull periods the average number of days was 1105. In secular bear periods the average number of days was 486.
The current case of 1955 days without a 20% correction is more than three times the average of 635 days (for the whole period from 1-3-1928 to 12-8-2016).
For this record number of days, let us all join hands and exclaim, “Thank you, Fed, BOJ, and ECB!”
So far, we have seen compelling evidence from several sources and methodologies that US stocks are overvalued. Yet just in the last month we saw investors react to the US election by bidding the benchmarks up to new all-time highs. This implies they expect even higher prices next year. Can it happen?
Louis Gave of Gavekal took on that question in a lengthy and masterful presentation last week titled “Something’s Gotta Give” (article is behind paywall). He had more questions than answers. The prime question, says Louis, is whether the US economy is a “coiled spring” ready to bounce higher based on the new political environment. We know changes are coming. Are they the kinds of changes that will help the economy, and therefore corporate earnings, grow enough to justify sharply increased stock prices in an already overvalued stock market?
The first one concerns government spending. Part of the present rally comes from expectations that Trump and the Republican Congress will launch an infrastructure stimulus program and also raise defense spending. That’s not a sure thing. Even if it were, Louis points out that higher government spending historically correlates with lower P/E ratios.
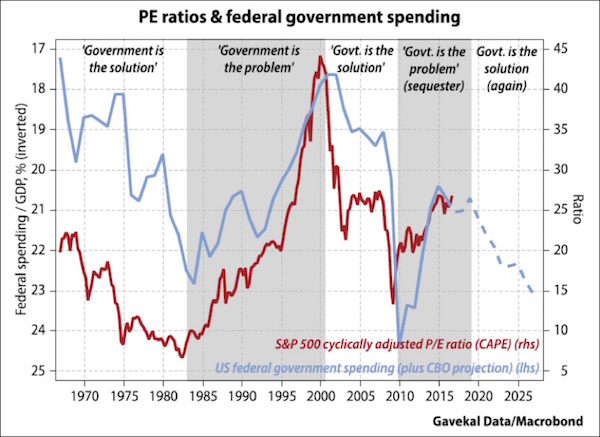
Some people will dispute this. You can argue that the higher spending is a response to the lower growth that caused the low P/E ratio. But if you believe that government is by nature less efficient than the private sector, then higher government spending will mean more capital misallocation, which is not good for stock valuations.
A second justification for the current rally is that new policies and perhaps delayed Federal Reserve tightening will mean higher inflation. People say this will be positive for stocks. With this chart Louis again says, “Not so fast”:
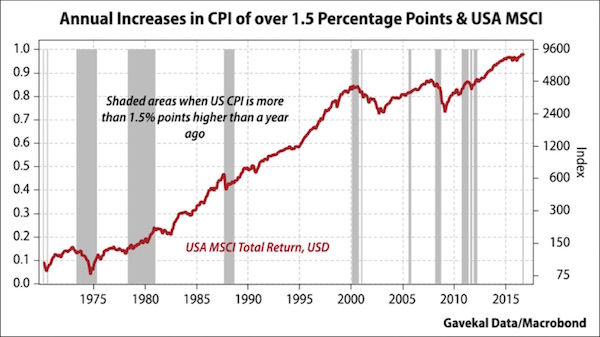
The vertical shaded areas are periods of rising inflation. Other than 1979–81, we see stocks falling in those periods, not rising. Louis says this is because inflation misallocates resources. Companies have to hold more inventory, spend more on payroll and benefits, and otherwise take their eyes off more important goals.
Of course, the Trump administration will do more than just raise spending. Trump intends to reduce taxes, roll back excessive regulation, and otherwise make the US more business-friendly. He will go about it differently than other Republicans would. His intervention in the Carrier outsourcing indicates that this is not going to be a conventional GOP White House. We’ll see how well his approach works, and whether other changes can outweigh the drag caused by higher spending and inflation.
Investing in a Rising-Interest-Rate World
My friends at Welton Investment put out very thoughtful and useful papers, and I always make a point to read them. They are chock-full of useful charts and historical insights. In the latest one they offer some cautions to the recent euphoria of the Trump Rally (see more later). It turns out that equity returns are not all that durable in rising-interest-rate environments. Of course, one could argue that a 25-basis-point increase from already low rates every six months or so does not really correspond to any historical interest-rate increase cycle, but that’s a topic for another letter. Here is a chart that shows average returns during the last six rising-interest-rate environments:
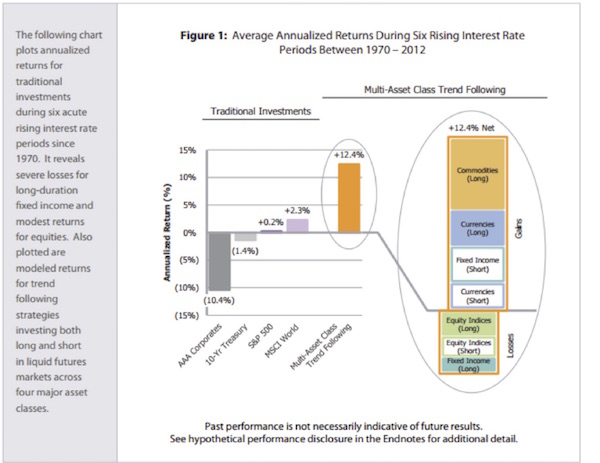
Interestingly, global equities somewhat outperformed US equities during such periods. But what the chart tells us is that we really have to begin to look outside the traditional asset-diversification strategies to find potential for returns.
We see little evidence to suggest that a new bull market is at hand, but that does not mean we are at the top. Markets can stay in overvalued territory longer and move higher than anyone expects. Having now lived through several cycles, I don’t presently see the kind of euphoria that accompanied previous tops. I meet lots of people who are wary of this market, just as I am. The top is more likely to happen when we skeptics throw in the towel and start buying.
My own view is that we are in a trader’s market. It “wants” to go up, so the underlying trend is bullish, but we also see volatility rising. We also see other asset classes, like Treasury bonds, getting whacked while stocks move higher. It seems clear a lot of investors are confused.
When you’re lost and confused, the best idea is often to take your hands off the wheel and let someone else drive. Yet millions are simply taking their hands off the wheel and hoping the car goes the right way. That’s what a passive indexing strategy does for you. You buy a collection of stocks or bonds on the belief they will go up. Maybe they will. And maybe you will end up in the ditch. Personally, I think we are moving into an era where active investing is going to be necessary to keep us on the road to success.
In a world where there is a quite real potential for the correlation among all diversified asset classes to become extremely close, high volatility is certain to be the rule rather than the exception. I think now is the time to diversify among trading strategies rather than settle for passive asset allocation.
Whatever you do, now is no time to put all your eggs in one basket. If you use active managers, have several who don’t just do the same thing at the same time. If you’re indexing, put at least a small slice in some strategy that isn’t always long.
Between the high level of stock market valuation, economic uncertainty, and all the various flash points we’ve discussed this year, I think we may be in for a rough ride in 2017. Buckle up.
Some Thoughts on the Trump Rally
At first glance, strictly from the point of view of the short-term impact they will have on the markets, what’s not to like about the proposed Trump/Ryan/Republican tax proposals? Woody Brock and I had a significant exchange during dinner Thursday night and agreed that the proposed corporate tax reduction will really have a far greater impact than any of the proposed personal income tax cuts. Trump is proposing a top corporate tax rate of 15%, and the Ryan plan essentially calls for 20%. Sounds like there’s room for the Art of the Deal to find a way forward.
The problem is that the devil is in the details. Our hosts Thursday night were very worried about some of the ancillary proposals that come with the plans of Trump or Ryan or Texas Congressman Kevin Brady, who is chairman of the congressional Ways and Means Committee, which is actually in charge of tax legislation. (Newt Gingrich has told me that current Ohio Governor John Kasich, who was chair of Ways and Means when Newt was Speaker, was personally responsible for shepherding his tax proposals through and was the most important part of the entire process.)
Brady’s proposal includes a VAT-like tax along with a significantly reduced or eliminated corporate tax. It is possible that under his proposal an import duty would be levied on raw materials entering the country. That’s not clear. You can read more about the issue in this weekend’s Wall Street Journal here. The main point is that they are still working on the details.
A 15% tax cut combined with a VAT of some sort could – but not necessarily would – be extraordinarily beneficial to the profits of US corporations. Some of Ryan’s proposals, which include a significant reduction in dividend and capital gains taxes, would also be bullish. Some of the major proposals (even from Ryan) include a maximum tax of 25% on pass-through corporation income, which is the bulk of small-business income. That would be massively bullish for corporate profits.
Yes, the devil is in the details, and when you begin to get into the weeds of some of these proposals you can lose your bullish euphoria quickly. Has the market gotten ahead of itself? I don’t know. Because I don’t know what is going to come out of the hodgepodge of tax and spending proposals we are seeing.
Understand something. The people in the congressional Republican leadership are tough individuals with strong beliefs about how taxes and revenue should be generated. This is a different group than we saw during the Bush II administration. The post-Gingrich era was not one of the Republican Party’s finer moments. (Some of us think it was a major embarrassment.)
A 20% tax/tariff on raw-material inputs would be massively inflationary. The United States simply doesn’t have the raw materials that it needs in order to produce the enormous variety of products that it does. The resources are simply not here. For instance, we don’t have the right types of crude oil for all of our needs; and even if Trump opens up federal lands and makes it easier to drill for oil, it will take years – as in multiple years, longer than his first term – to get to the place where we are producing anywhere close to the amounts and types of crude that we actually need, if we ever can. Further, many of our refineries are designed to take the rather heavier crudes that come from foreign imports rather than our own light crudes. We are talking multiple tens of billions, if not hundreds of billions, of dollars that will be needed for retooling our own refineries to process lighter crudes. That cost will have to be passed on, or companies will go out of business and tens of thousands of jobs will be lost.
Where would we get enough lumber for building if we start taxing Canadian timber at the border? Off the top of my head I can come up with a dozen critical raw inputs that would be significantly more costly if we put a 20% tariff on them. Put that in your inflationary pipe and smoke it. And then try to trade around that! I am not even going to offer you a chart of what happens to equities during periods of rising inflation, other than to say that it’s really ugly.
That being said, there are parts of the Brady corporate/VAT tax plan that are very appealing at first blush – assuming of course that somebody figures out that raw material inputs have to be dealt with in a different manner. And the whole situation becomes more complex because of currency adjustments. And then you throw in a stronger dollar, and it gets more complex yet.
However, the Brady plan would offer strong incentives to foreign corporations to establish plants in the United States to produce whatever they normally sell here, which would create US jobs. That’s assuming that other countries don’t modify their own tax proposals in a kind of tax bidding war. It may be time to dust off our game theory papers!
At the end of the day, call me a skeptical optimist. I know that a few oxen are going to get gored in the tax-reform process –you can’t make everyone happy. But the opportunity is here to radically reshape the entire tax process. I think that most everyone can agree that our current tax system is thoroughly dysfunctional and is far overdue for an overhaul.
Maybe, just maybe, the market is getting it right. A radical restructuring of business taxes could be an enormous boost to corporate profits, which would change the entire price-to-earnings equation in a positive manner. Which is why you need to be long today, but you need to be long with a strategy that says that when the facts change, you change, and that you have a clear eye on a direct path to the exit if and when you need it. The market is a voting machine, and every twist and turn will change its sentiment. So it’s wise to stay on your toes. Restructuring the tax system the wrong way would be devastating.
Trump and his talented team, along with Ryan, McConnell, Brady, and all the rest of the players, need to be very circumspect in how they talk about the details of their plans in public before they get them hashed out among themselves. Markets hate uncertainty, and we could see the entire bull market blow up before we know half the details if stuff starts getting leaked that could be interpreted as damaging (though that might not really be the case). These people are big boys and girls and understand that danger. Let’s hope their staffs, which are the usual source of leaks, understand it as well. (Let me take a moment here to be hypocritical and say that if any staff members want to leak discuss things with me, please feel free to call. I really am trying to keep up with what the heck is going on and might have an idea or two to offer. And I actually get the concept of “off the record.”)
More on what your investment strategy should look like will be coming your way in future letters and white papers early next year. Stay tuned.
Subscribing to the publications included in VIP membership would cost $6,662 for a full year, but we’ve knocked 63% off that (with an even bigger discount for two-year membership).
You can learn more and sign up for Mauldin Economics VIP right here. It’s available through December 13 – but then the doors will be closed for at least another six months.
As I write, I am literally on a train from Washington DC to New York for a series of meetings and a special Friends of Fermentation celebration with Art Cashin and the gang, and then I’ll head on down to Atlanta for a Galectin Therapeutics board meeting. After the Galectin gathering I’ll be home for the holidays, and then I’ll be at the Inside ETFs Conference in Hollywood, Florida, January 22–25. If you are in the industry and coming to that conference, make a point to meet with me. I will be making some big announcements at the conference. Then I’ll be at the Orlando Money Show February 8–11 at the Omni in Orlando. Registration is free.
I had dinner last night with my really good friends Neil Howe (of Fourth Turning fame) and Steve Moore. You know we talked politics and the future, but I also tried to frame the question of economic policy in terms of how do we help middle-class America? I am more and more becoming convinced that not just the Trump election but also the outcome of the Brexit and Italian referenda represent a pushback from the middle class. People feel they have lost control of their economic lives and are looking for ways to find work with meaning. They’re not looking for handouts or for welfare; they want jobs and value and a way to feel good about themselves, that they are contributing to society.
We can certainly bring a some jobs back to the US with the growing phenomenon of the “re-shoring” of American companies, and certainly the policies outlined above would accelerate that trend; but re-shoring is not going to produce the multiple millions of jobs that have gone away due to increased technological productivity, and that is going to continue to be a problem. We are going to have to figure out how to address the distribution of not just wealth but meaningful, purposeful work more evenly throughout society.
The more I think about the future of work – and it’s the most difficult chapter of the book I am working on – the more questions I have. And the answers remain vague. This is forcing me to contemplate philosophically uncomfortable concepts. The real angst that so many people are experiencing is easy to see. There were headlines this week about the odd dip in longevity among middle-class white males, for the first time in 250 years. The falloff is attributed to suicide, alcohol, and drugs. No mystery there, but the astonishing thing is the sheer size of the problem. People are looking for hope, and unfortunately, far too many of us see no hope and end up in a sad downward spiral. This problem has to be addressed, and solutions are not just a matter of tax policy.
Trump has made a down payment on at least trying to do something about our disastrous inner cities by talking Dr. Ben Carson into taking a run at the problem. If you don’t know his story, he came up on the wrong side of Detroit to become one of the most celebrated doctors in the world. The movie Gifted Hands was about him. Honestly, I don’t know what he can do. But at least he viscerally understands the problems.
Neil made the point that Bernie Sanders lost massively in the black communities in Southern states. He came to the South and talked about black people as being victims. That is not what the large majority of blacks are looking to hear. They want to know how things are going to change for them. They are looking for exactly the same hope and promise that white middle America is looking for. At the end of the day, we are far more alike than we are different.
And with that I will hit the send button and spend a few hours on the train trying to work through a few hundred emails. And maybe even dip into a few books. I flew in very early Friday morning to meet with Andy Marshall, who is now 95 and still at the very top of his game. He is often called the Department of Defense’s Yoda. He was appointed by Nixon and reappointed by every president up to and including Obama as the head of the Net Assessment Division of the Defense Department, which looks at future problems and threats. He is the greatest futurist alive today – he can see geopolitical and defense patterns and issues develop long before they are apparent to anybody else. We talked about a lot of things, but I also asked him questions pertinent to my upcoming book on what the world will look like in 20 years.
By the end of our session I had bought about half a dozen books on my iPad. In several, I simply bookmarked the chapter he thought was relevant. He literally had hundreds of books in a stack on a table, and those were the ones he had read recently. I can’t tell you what an honor it is to be allowed to simply to visit with him. When you look at his schedule, which he keeps on an old-fashioned calendar on his coffee table, you realize what a parade of people, many whose names you would recognize, are coming to him for advice and counsel. There was a book written about him, called The Last Warrior, and it’s well worth reading
I may do a few TV hits in NY, but it’s all so last-minute as the new cycles keep shifting, so you never know who the producers really want to have on. I will send out a tweet when I know. You should be following me on Twitter. Have a great week. I’m looking forward to having dinner with my friends Rory Riggs and Steve Blumenthal tonight, and Shane is joining me in New York for the next few days. Then Ed D’Agostino and Olivier Garret are coming in to talk about our publishing business and to share a holiday dinner. It should be fun.
Your just enjoying the season and getting together with friends analyst,
John Mauldin
 WPT Industrial REIT is a US-based owner of high quality industrial properties located in 12 US states, with a fair value of ~US$800m based on International Financial Reporting Standards (IFRS). The REIT’s state-of-the art industrial portfolio boasts an average clear ceiling height of 31 feet (best-in-class 30–36+ feet clear height allows for higher stacking, which is key for warehouse/distribution real estate) and an average age of just 14 years. WPT caters to e-commerce, warehouse and logistics users; its ten largest tenants account for 42% of revenue, and include high-profile tenants such as General Mills, Unilever, Zulily, CEVA, Amazon, eBay and Honeywell.
Owing to its young portfolio and low renewal/re-leasing costs, WPT boasts a highly… CLICK HERE for the complete analysis

-
I know Mike is a very solid investor and respect his opinions very much. So if he says pay attention to this or that - I will.
~ Dale G.
-
I've started managing my own investments so view Michael's site as a one-stop shop from which to get information and perspectives.
~ Dave E.
-
Michael offers easy reading, honest, common sense information that anyone can use in a practical manner.
~ der_al.
-
A sane voice in a scrambled investment world.
~ Ed R.
Inside Edge Pro Contributors

Greg Weldon

Josef Schachter

Tyler Bollhorn

Ryan Irvine

Paul Beattie

Martin Straith

Patrick Ceresna

Mark Leibovit

James Thorne

Victor Adair