Stocks & Equities

Dome Forces US Stock Market Lower

Technical analyst Clive Maund takes a look at the current state of the U.S. stock market, and reflects on how the outcome of the impending election might steepen a decline. 

Maundcover 11-6-16

A number of subscribers have written in asking about the technical state of the broad U.S. stock market, which we haven’t looked at for a while. With the failure of an important support level a few days back and the election drawing near, it’s certainly a timely question.

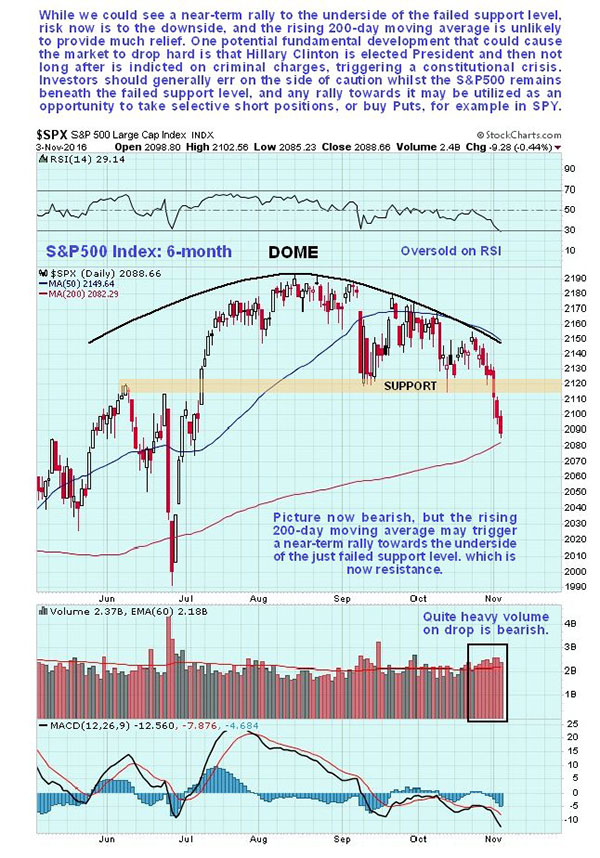
We’ll start by looking at a 6-month chart for the S&P500 index, on which we see that early this week, forced lower by the “distribution dome” shown, it broke down below important support. Ideally, we should have shorted it on its last approach to the dome boundary after the middle of October, but we missed the chance. Now it has already arrived at its rising 200-day moving average, which may generate a near-term bounce back up to the failed support; this is now resistance, where the market may again be shorted, perhaps by means of puts in something like SPDR S&P 500 (SPY). 

Here we should note that despite the 200-day moving average still rising, this is now a weak picture, for reasons that become clearer on the 1-year chart. In any case, if the market continues to drop, the 200-day moving average will quickly roll over and turn down.
maund6-month

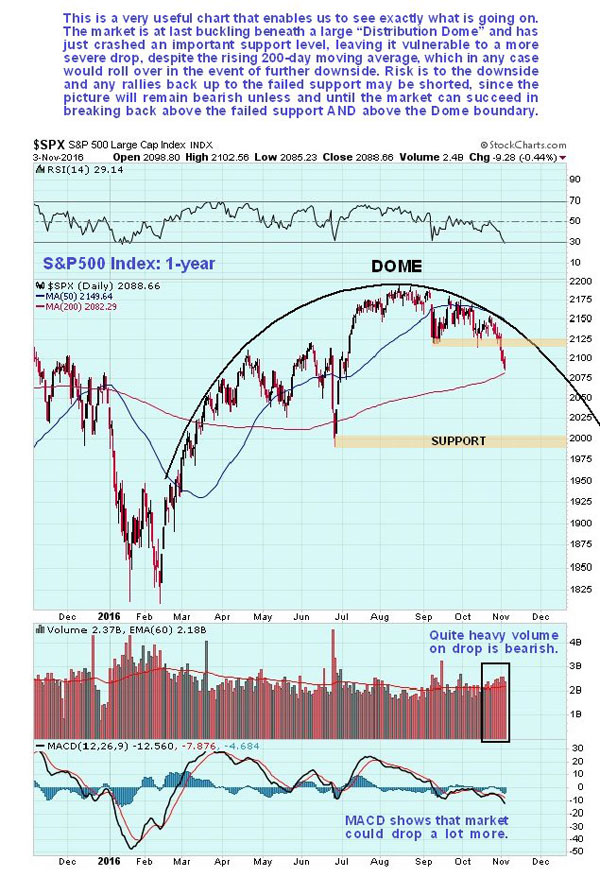
On the 1-year chart all becomes clear, and we see why the market is now dropping away. It is being forced into retreat by the fine, large dome pattern shown now pressing down on it from above—this is what triggered the support failure early this week. Volume has been persistently heavy on this drop, which is bearish, and the moving average convergence/divergence (MACD) indicator shows that there is plenty of room for it to drop further. An immediate downside target is the support shown in the 2000 area.
maund1-year.

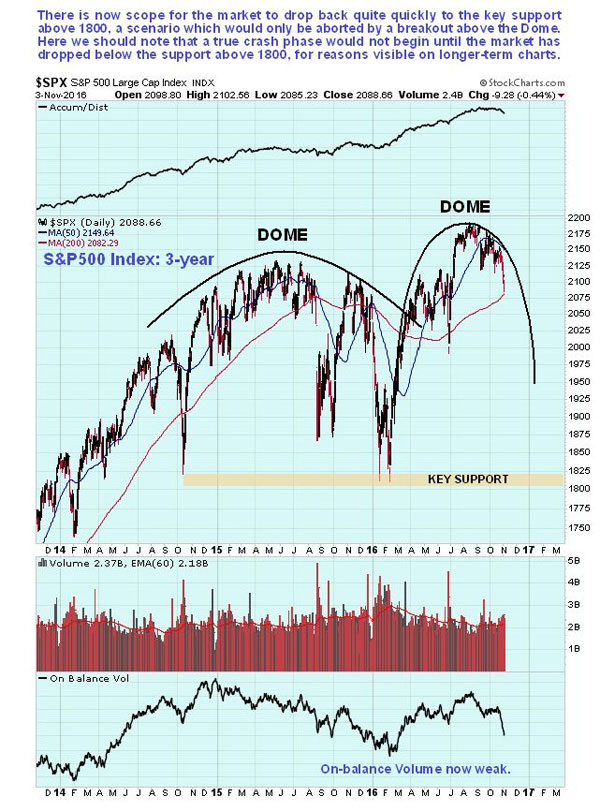
The 3-year chart shows that the current dome is the successor to an earlier one that took much longer to form. The earlier dome forced the index to plunge back toward 1800 early in the year, after the Fed’s foolish and tiny interest rate rise last December, but aborted soon after. This illustrates that these domes can and quite often do abort. The crucial point is that until they do, the trend can be assumed to be down, and knowledge of the position of a dome boundary enables the judicious placing of overhead stops to protect any open short positions.
maund3-year

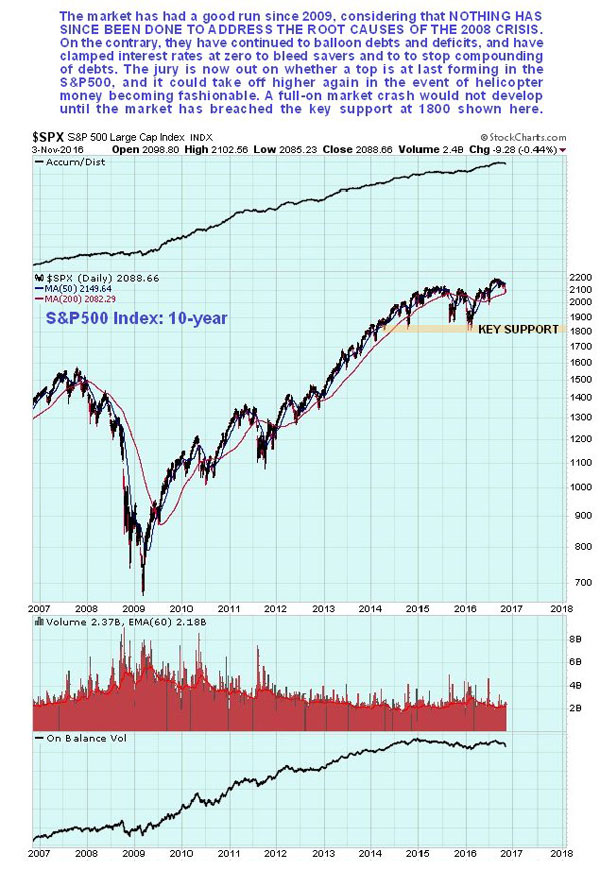
The 10-year chart is useful as it puts the action of recent years into perspective. On this chart we can see that a potential top area is forming, but that it won’t be confirmed as such unless and until the index breaks below the key support at and above 1800, which we already looked at on the 3-year chart. 

If this support does fail, it would usher in a true crash phase, and the risk of a near vertical plunge. One fundamental scenario that could trigger this would be a constitutional crisis arising from Hillary Clinton first being voted into the presidency, and then being indicted as a criminal. Although it may seem farfetched, this is not beyond the bounds of possibility. Outside of the U.S., Clinton is widely perceived to be a liar, a crook and a warmonger, who has only escaped prosecution thus far because of cronyism and nepotism—she is above the law. Many average voters are simply too ignorant and insouciant to comprehend what she is really like—many do though, to a greater or lesser degree, and will only vote for her because they like Trump even less.

However, even inside the U.S., the intelligence community and various others that she has crossed and insulted are deeply fed up with her, and they have recently been supplied with all the ammo they need to bring her down, if they so choose. And that could happen fast.

Returning to the 10-year chart, the key support shown may not fail. In the event that so-called helicopter money becomes fashionable, it could take off again and advance to new highs, regardless of the state of the economy.
maund10-year

Conclusion
The trend of the market is down, and it may be traded to the downside as long as the S&P500 index remains below the dome shown on its 1-year chart. A near-term bounce toward this will throw up a shorting opportunity. There exists the possibility of a more severe decline setting in soon.

Clive Maund has been president of www.clivemaund.com, a successful resource sector website, since its inception in 2003. He has 30 years’ experience in technical analysis and has worked for banks, commodity brokers and stockbrokers in the City of London. He holds a Diploma in Technical Analysis from the UK Society of Technical Analysts.

Disclosure:
1) Statements and opinions expressed are the opinions of Clive Maund and not of Streetwise Reports or its officers. Clive Maund is wholly responsible for the validity of the statements. Streetwise Reports was not involved in the content preparation. Clive Maund was not paid by Streetwise Reports LLC for this article. Streetwise Reports was not paid by the author to publish or syndicate this article. 
2) This article does not constitute investment advice. Each reader is encouraged to consult with his or her individual financial professional and any action a reader takes as a result of information presented here is his or her own responsibility. By opening this page, each reader accepts and agrees to Streetwise Reports’ terms of use and full legal disclaimer. This article is not a solicitation for investment. Streetwise Reports does not render general or specific investment advice and the information on Streetwise Reports should not be considered a recommendation to buy or sell any security. Streetwise Reports does not endorse or recommend the business, products, services or securities of any company mentioned on Streetwise Reports.

Charts provided by Clive Maund

The Market Reality for the Election Next Week

2016-Unknown“grab your socks. We are off for a bit of volatility. Keep in mind Trump would be great for a domestic market rally. Cutting corporate taxes to 15% will bring home $3 trillion to say the least. The Reagan Tax Cuts resulted in the Dow rising 600%. Tax increases, have ALWAYS resulted in declines. That is the blunt reality that Washington fights.”

…continue reading HERE


…related:

Live From The Trading Desk: Raking in the Cash

Stock Trading Alert: SP500 At 2,100 Support Level – Make Or Break?

Briefly: In our opinion, speculative short positions are favored (with stop-loss at 2,150, and profit target at 2,020, S&P 500 index).

Our intraday outlook is bearish, and our short-term outlook is bearish. Our medium-term outlook is neutral, following S&P 500 index breakout above last year’s all-time high:

Intraday outlook (next 24 hours): bearish
Short-term outlook (next 1-2 weeks): bearish
Medium-term outlook (next 1-3 months): neutral
Long-term outlook (next year): neutral

The U.S. stock market indexes lost between 0.4% and 0.8% on Wednesday, extending their short-term downtrend, as investors reacted to the FOMC Rate Decision, quarterly corporate earnings, economic data releases. The S&P 500 index broke below its September – October local lows on Tuesday. It is the lowest since early July. The nearest important support level is at around 2,075-2,090, marked by some previous consolidation. The next important level of support is at 2,035-2,045, marked by the late June daily gap up. On the other hand, resistance level is at 2,110-2,120, and the next resistance level is at 2,150 marked by last month’s local highs, as we can see on the daily chart:

42933 a
Larger Image

Expectations before the opening of today’s trading session are mixed, with index futures currently between -0.4% and +0.1%. The main European stock market indexes have been mixed so far. Investors will now wait for some economic data announcements: Initial Claims, Productivity at 8:30 a.m., Factory Orders, ISM Services number at 10:00 a.m. The S&P 500 futures contract trades within an intraday consolidation, as it bounces off support level at around 2,085-2,090. The nearest important level of resistance is at 2,100 mark. There have been no confirmed short-term positive signals so far:

S&P500 15-Minute Chart
Larger Image

The technology Nasdaq 100 futures contract is relatively weaker than the broad stock market, following yesterday’s Facebook’s quarterly earnings release. It currently trades along the level of 4,700. The nearest important level of support is at around 4,690, and resistance level remains at 4,720-4,740, among others, as the 15-minute chart shows:

NASDAQ100 Futures 15-Minute Chart
Larger Image

Concluding, the broad stock market continued its short-term downtrend yesterday, as the S&P 500 index traded the lowest since early July. We continue to maintain our speculative short position (opened on July 18th at 2,162, S&P 500 index). However, yet again we decided to move our stop-loss level: from 2,180 down to 2,150 (S&P 500 index). Our potential profit target level remains at 2,020 (S&P 500 index). You can trade S&P 500 index using futures contracts (S&P 500 futures contract – SP, E-mini S&P 500 futures contract – ES) or an ETF like the SPDR S&P 500 ETF – SPY. It is always important to set some exit price level in case some events cause the price to move in the unlikely direction. Having safety measures in place helps limit potential losses while letting the gains grow.

Thank you.

…related:

Don’t Sweat The Election. The Next Crisis Is Already Baked Into The Cake


Stock Market Rally on FED Speak Today?

The chart below shows that we have the likely hood of staging a huge rally today in the stock market. In fact, the NASDAQ 100 could make a new high by Friday. The trines of October 30 and November 1 turned out to be exhaustion points in a down trend. The 5/10/20 and 40 week lows still loom ahead and are due sometime in mid to late month. Thanksgiving week could be pivotal.

42922 large
Larger Image


Brad Gudgeon, editor and author of the BluStar Market Timer, is a market veteran of over 30 years www.blustarmarkettimer.info

related:

Look At This Remarkable Chart As The Public Dumps Stocks! 5th Largest Outflow In The Past 10 Years!

Don’t Sweat The Election. The Next Crisis Is Already Baked Into The Cake

riday was one of those days where you walk away from the screen for a minute and come back to find a completely different market. All it took was the FBI finding a trove of new Clinton emails, thus breathing new life into the Trump campaign and throwing what was a foregone conclusion back into doubt. Stocks tanked and gold popped, illustrating Wall Street’s preference in the upcoming election.

It will be this way until the vote, especially if polls continue to tighten and the outcome remains uncertain. So there’s no point in obsessing over fundamentals for now. Nothing real will matter until we find out who gets to mess things up going forward. Sort of like the original Ghost Busters where the demon/god says “Choose the form of the destructor.”

In other words it’s a mess either way. Only the details of the mess are in question.

From here on out politics are only relevant at the extremes — major war, corruption scandal, martial law etc. Short of that, the fiat currency/fractional reserve banking world has such institutional momentum that it really won’t matter whether Trump is picking on bankers and building his wall or Clinton is protecting Wall Street and raising taxes. Debt will keep soaring as it has under every president since Reagan and jobs will disappear as machines replace people, thus bringing the end of the current system inexorably closer.

So it’s both dangerous to try to time this kind of uncertainty and, in the end, unnecessary. Crisis is coming and governments (whether left or right, populist or establishment) will respond as they always do, with easier money and more borrowing.

Here are three trends that matter vastly more than the name of the next US president:

China’s Debt Has Grown $4.5 Trillion In Past 12 Months, More Than The US, Japan And Europe Combined

While concerns about China’s debt load, capital flows, and depreciating currency have been pushed to the back-burner in recent months, perhaps facilitated by a welcome rebound in global inflation – perceived by markets and global central bankers that monetary policy is finally working – it is worth a quick reminder of how we got here.

First, a quick trip through memory lane to remind us how much has changed in just the past year.

In a note by Morgan Stanley’s Chetan Ahya released on Sunday, the strategist reminds us that a little more than a year ago, the global economy was facing intense disinflationary pressures. Global commodity prices were declining significantly and the slowdown in China and other major commodity-producing EMs had led to some concerns that it could pull developed markets into recession and drag inflation down along with it. At the same time, in China, producer prices fell by almost 6%Y and the regime change in its currency management approach meant that China was no longer absorbing disinflationary pressures from abroad.

And while this seems like a distant memory today, thanks to China which has played a pivotal role in driving the global inflation cycle – this time on the upside – as the cyclical recovery has both lifted China’s own inflation and transmitted it globally, here is how this happened: the recovery in China has been driven by yet another round of debt indulgence. Debt in China has grown by US$4.5 trillion over the past 12 months, by far the highest amount of debt creation globally as compared to US$2.2 trillion in the US, US$870 billion in Japan and US$550 billion in the euro area. Indeed, China on its own has added more debt than the US, Japan and the euro area combined.

While we have shown the IIF’s forecast of Chinese debt countless times in recent months, here it is once again to put China’s unprecedented debt expansion in context:

42909 a


World to face stress test as dollar Libor spikes and bond rout deepens

(Telegraph UK) – Surging rates on dollar Libor contracts are rapidly tightening conditions across large parts of the global economy, incubating stress in the credit markets and ultimately threatening overvalued bourses. 

Three-month Libor rates – the benchmark cost of short-term borrowing for the international system – have tripled this year to 0.88pc as inflation worries mount.

Fear that the US Federal Reserve may have to raise rates uncomfortably fast is leading to an increasingly acute dollar shortage, draining global liquidity.

“The Libor rate is one of the few instruments left that still moves freely and is priced by market forces. It is effectively telling us that that the Fed is already two hikes behind the curve,” said Steen Jakobsen from Saxo Bank.

“This is highly significant and is our number one concern. Our allocation model is now 100pc in cash. This is a warning signal for the market and it happens extremely rarely,” he said.

Goldman Sachs estimates that up to 30pc of all business loans in the US are priced off libor contracts, as well as 20pc of mortgages and most student loans. It is the anchor for a host of exotic markets, used as a floor for 90pc of the $900bn pool of the leveraged loan market. It underpins the derivatives nexus.

42909 b

The chain-reaction from the Libor spike is global. The Bank for International Settlements warns that the rising cost of borrowing in dollar markets is transmitted almost instantly through the global credit system. “Changes in the short-term policy rate are promptly reflected in the cost of $5 trillion in US dollar bank loans,” it said.

Roughly 60pc of the global economy is linked to the dollar through fixed currency pegs or ‘dirty floats’ but studies by the BIS suggest that borrowing costs in domestic currencies across Asia, Latin America, the Middle East, and Africa, move in sympathy with dollar costs, regardless of whether the exchange rate is fixed.

Short-term ‘Shibor’ rates in China have been ratcheting up. The cost of one-year swaps jumped to 2.71pc last week, and the spread over one-year sovereign debt is back to levels seen during the Shanghai stock market crash last year.

These strains are not a pure import from the US. The Chinese authorities themselves are taking action to rein in a credit bubble. It is happening in parallel with Fed tightening, each reinforcing the other, and that makes it more potent.

Three-month interbank rates in Saudi Arabia have soared to 2.4pc. This is the highest since the global financial crisis in early 2009 and implies a credit crunch in the Saudi banking system. The M1 money supply has fallen 9pc over the last year.


The One Trillion Dollar Consumer Auto Loan Bubble Is Beginning To Burst

(Economic Collapse Blog) – Do you remember the subprime mortgage meltdown from the last financial crisis? Well, this time around we are facing a subprime auto loan meltdown. In recent years, auto lenders have become more and more aggressive, and they have been increasingly willing to lend money to people that should not be borrowing money to buy a new vehicle under any circumstances. Just like with subprime mortgages, this strategy seemed to pay off at first, but now economic reality is beginning to be felt in a major way. 

The total balance of all outstanding auto loans reached $1.027 trillion between April 1 and June 30, the second consecutive quarter that it surpassed the $1-trillion mark, reports Experian Automotive.

The average size of an auto loan is also at a record high. At $29,880, it is now just a shade under $30,000.

In order to try to help people afford the payments, auto lenders are now stretching loans out for six or even seven years. At this point it is almost like getting a mortgage.

But even with those stretched out loans, the average monthly auto loan payment is now up to a record 499 dollars.

Already, auto loan delinquencies are rising to very frightening levels. In July, 60 day subprime loan delinquencies were up 13 percent on a month-over-month basis and were up 17 percent compared to the same month last year.

Prime delinquencies were up 12 percent on a month-over-month basis and were up 21 percent compared to the same month last year.

In a quarterly filing with the Securities and Exchange Commission, Ford reported in the first half of this year it allowed $449 millionfor credit losses, a 34% increase from the first half of 2015.

General Motors reported in a similar filing that it set aside $864 million for credit losses in that same period of 2016, up 14% from a year earlier. 

These three things – soaring Chinese debt, disruptions in the money market, and the end of the auto loan bubble – matter vastly more than which party runs what part of the government.

When one or all (or some other problem like Deutsche Bank) blow up in 2017, deficit spending will soar, interest rates will be forced down (to the extent that that’s possible) and new rules will be imposed on whatever freely-functioning markets remain.

And so it will go until the old tricks stop working. Then the details will start to matter again.

…also:

Victor Adair and Michael Campbell on: Zeroing in on the State of the Markets Now