Stocks & Equities

Simple Rules of Chart Analysis

perspectives header weekly

perspectives commentary

In This Week’s Issue:

  • Weekly Commentary
  • Strategy of the Week
  • Stocks That Meet The Featured Strategy

Stockscores Market Minutes Video – Profit Clumps
Profits from the market don’t come in a predictable, steady flow, they come in clumps. That plus this week’s stock market analysis. Click Here to Watch
To get instant updates when I upload a new video, subscribe to the Stockscores YouTube Channel

Trader Training – Simple Rules of Chart Analysis
Stock charts tell me everything that I need to know to do my analysis. They tell me how people feel about a stock, whether there are good things happening within the company’s business, how the economy is affecting the company and, most importantly, what the potential for price change is.

Here are some simple rules of chart reading that I think anyone analyzing charts should keep in mind.


Prices That Fall in to Support Will Bounce at Support
Support and resistance are important concepts of chart analysis. Support is a floor price that has been formed by the market over time, it is a low price point where the price trend stopped going down and started to go up. Chart readers look for breaks through support as a signal that a down trend is beginning.

However, that is not always the case. If a stock’s price is falling day after day, it is likely to bounce around support but it may go through support temporarily. Therefore, don’t short breaks through support if the break comes after a number of days of downward price movement. Prices in free fall will usually bounce around support.

Prices that Consolidate Before Breaking Support Will Trend Lower
Here is how to apply the sell on a break of support rule. If prices are trending sideways with relatively low volatility at or near an area of price support and then make a downward move through support, the stock is likely going in to a downward trend. The difference here is that the downtrend is just starting with an initial break through support.

You can reverse these rules for resistance and upside breakouts as well.

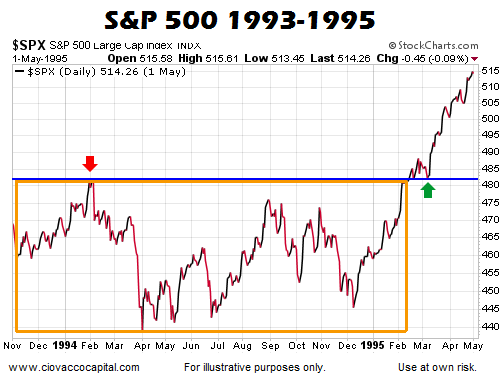
Breakouts From Low Price Volatility are Reliable
What does it mean when stocks trend sideways with very little price volatility? It is more than just a boring chart, it means that buyers and sellers agree about what the stock is worth. It is a display of confidence in the value given to the stock.

Therefore, if the stock price breaks from this period of confidence, it implies that there is new information that justifies the price move. This usually comes in the early stages of a trend; as more investors learn about the new information, more people will jump in to the stock and carry it farther along its trend.

This means that identifying breaks from low price volatility is an important way to catch market beating trends early.

Prices That Run Away From the Trend Line Come Back to the Trendline
In the long term, prices tend to trend in a linear fashion. That means you can draw a straight line across the bottoms of an up trend or a straight line across the tops of a down trend.

However, along the way, prices will often move away from this straight line. This happens because investors get emotional and either chase the stock higher with greed or force the stock quickly lower with fear. 

The emotion eventually comes out of the market, bringing the stock back to that linear, straight trend line.

This means that we should be aware of a short term price reversal the farther prices get from the linear trend line. A stock that runs away to the upside will eventually come down on a pull back. Prices that fall too quickly will eventually come up.

This rule works best with up trends, which tend to be more orderly and longer lasting than down trends.

All Available Information Is Shown In the Chart
Traditional investors who have heard me talk about the markets often shake their heads when they hear that I do not do any research in to what the company does before I buy a stock. They find it hard to believe that I can make money trading nothing more than the chart.

The chart of price change shows us every bit of fundamental information that is known by the market. Since most investors are acting on information to make their decisions, reading a chart is essentially reading their perceptions of the information that they have. A company that is doing well within their business will have a good looking chart because investors are pricing in the positive new information.

Falling Tops Are a Sign That Investors Are Pessimistic
If investors believe that there is something wrong with a company’s ability to make money in the future, they will drive prices lower over time. This pessimism is best seen visually in a chart by looking for falling tops. The falling tops on the chart show that every time the buyers are able to push prices up, they are unable to push prices as high as they had the previous time. That is a sign that the sellers are in control of the market.

Rising Bottoms Are a Sign That Investors Are Optimistic
Conversely, if the bottoms are rising on the chart, investors are optimistic and the buyers are in control. Each time the sellers are able to push prices down, they are unable to push them down as much as they had the previous time.

It is best to only buy stocks that are in the buyers’ control.

Up Trends Start Slowly
A stock that has been an under or non-performer will have investor’s doubt any time it shows some strength. Investors tend to judge a stock by what has happened in the past rather than what they expect for the future. The result is that stocks that are starting upward trends tend to do so slowly because investors doubt that the company deserves to go higher.

This means you have to be patient with up trends that are in their early stages as they will often have false starts. Doubting investors who own the stock will sell in to strength, not realizing that the company’s future is brighter than it has been.

Action Candles are those that make statistically significant price movements on abnormal volume. You can find these stocks using the Stockscores Market Scan by activating the Abnormal Price and Abnormal Volume filters. Stocks that show Action Candles from predictive chart patterns are good candidates to outperform the market. Here are two stocks that I found today with nice charts:
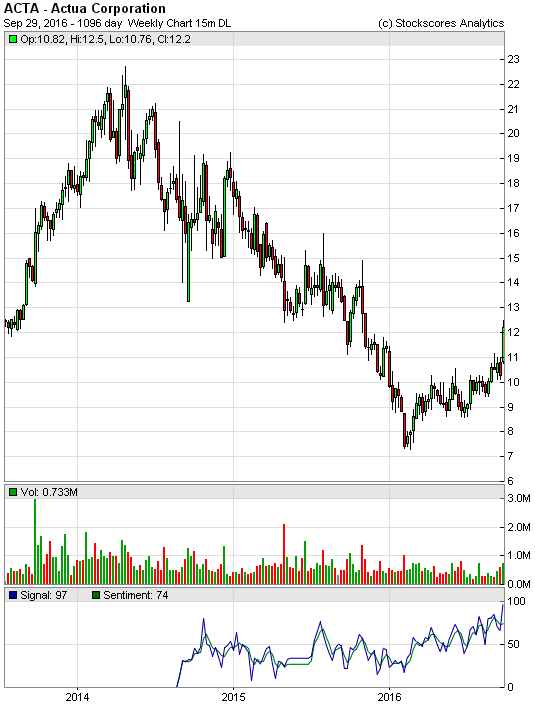
perspectives stocksthatmeet

1. ACTA
ACTA has made a strong gain today which sets up a nice long term trend reversal pattern on the weekly chart.
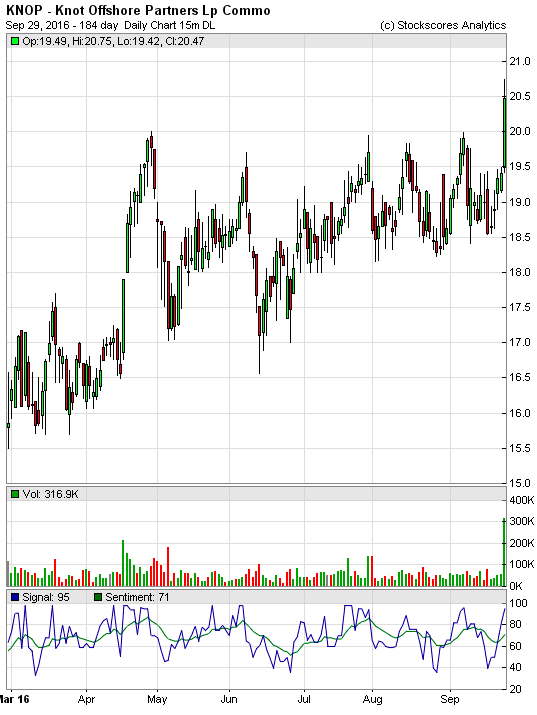
Screen Shot 2016-09-29 at 3.34.15 AM

2. KNOP
KNOP is breaking from an ascending triangle pattern on the daily, giving it a break from a rising bottom on the weekly.

Screen Shot 2016-09-29 at 3.34.37 AM

Alert: Don’t miss Michael’s great interview with the highly regarded Greg Weldon: On The Brink of Soaring Move In Gold & Silver

References

  • Get the Stockscore on any of over 20,000 North American stocks.
  • Background on the theories used by Stockscores.
  • Strategies that can help you find new opportunities.
  • Scan the market using extensive filter criteria.
  • Build a portfolio of stocks and view a slide show of their charts.
  • See which sectors are leading the market, and their components.

    Disclaimer
    This is not an investment advisory, and should not be used to make investment decisions. Information in Stockscores Perspectives is often opinionated and should be considered for information purposes only. No stock exchange anywhere has approved or disapproved of the information contained herein. There is no express or implied solicitation to buy or sell securities. The writers and editors of Perspectives may have positions in the stocks discussed above and may trade in the stocks mentioned. Don’t consider buying or selling any stock without conducting your own due diligence.


Lemmings Only Function in The Stock Market is to Serve as Cannon Fodder

“A genius can’t be forced; nor can you make an ape an alderman.” ~ Thomas Somerville

From the Tulip bubble to the financial meltdown of 2008, the theme has been the same. The masses never learn, they always cry foul on the way down but gurgle with joy on the way up. In other words, when they are making money, they are okay with the risk, but when they start to lose, they scream bloody murder.

Nature created the masses to serve as cannon fodder, and no matter what is done, nothing will change this. History is replete with examples of individuals who tried to help the masses; their only reward, in general, was the gallows or the bullet, depending on the era. It comes down to perception; you cannot force someone to latch on to yours and vice versa. This is why the Fed spends such an inordinate amount of time to alter the masses perception, and it was done gradually over a period of many decades. Try talking to a regular person about the dangers of Fiat and how the Fed is ruling the world; most will roll their eyes at you and treat you like are a madman. Sadly, the Gold Bugs do not understand this concept; there is no such thing as absolute truth because any truth or lie is based on the angle of observance and depending on the angle, the truth could appear to be a lie to another. The top players have done a fantastic Job of conning the masses, and it will take an impressive amount of pain and misery to change their outlook. Thus without a doubt, we can state that today’s mountain of debt which appears insane might one day seem to be sane in comparison ten years from today.

42584

It took over 100 years for the debt to get to $1 trillion; in fact, the debt was below $1 trillion until 1981. Now we add a trillion dollars to the deficit almost every year. Isn’t that insane; if the masses were going to rebel, should this not this be their moment to take a stand. Think about this for a second; we are creating the equivalent of 100 year worth of debt in just one year and not a peep from the masses; who’s to say the debt cannot be pushed to 100 trillion or 500 trillion. After all, they are just digits on a machine, and this money can be created in seconds.

We know it is hard to change the way you think especially since everything is painted in a black and white by the mainstream; you are usually given two false narratives to choose from.   This is why it is dangerous to follow mass media as their main goal is to make a mountain out of a molehill. On one side you have those that embrace Fiat and on the other hand, you have those who despise it. What if both were wrong, what if the top players purposely created the scenario so that these two groups would flourish and in doing so hide the real picture. FIAT is not bad, it is bad only because private bankers control the money supply, and these bankers are the biggest crooks in the world. It is like putting a fox in charge of the hen house, nothing good will come of it. If they were not in charge of it, the outlook would not be so bad. If we have a gold standard and crooks are allowed to control the reserve, which is the case currently, what’s to prevent them from lying to the masses? Latching on to any perspective prevents you from seeing the other half of the equation, and that is the elite player’s master game plan; to make you take a side and stick to it. Remember there always at least three perspectives to any situation neutral, negative or positive), but the masses will only see two and latch onto one of them. If the premise is wrong, no matter how hard you try, you will never find the right answer. This is why the solution is to identify the real problem and not grab one of the solutions being pushed on you by these false prophets.

Game Plan

The Fed is hell bent on flooding the system with money; there is no option but to devalue the currency or die. This is what every central bank worldwide is doing. Despite making a big noise, the BOJ and the Fed did exactly the opposite of what they were proclaiming all along. How can the Fed even hope to embark on a more aggressive path of raising rates, if the complete economic recovery is a joke?

Any central bank that embarks on a rate hiking course runs the risk of destroying their economy. The real solution is to let the economy go through a cleansing phase, but today’s society is not ready to deal with such pain. Central bankers are more than happy to accommodate this stance, for it means they can pretend to help the masses while fleecing them of their last penny. The stock market will continue to roar until the masses embrace this market. As the masses hate this market, it has a long way to go before it blows up. In addition to playing the trend in equities, it makes sense to own some bullion (Gold and Silver) as we the experiment central bankers are conducting has never been done before.

“Ability hits the mark where presumption overshoots and diffidence falls short.” ~ John Henry Newman

….interesting related article:

Marc Faber: Dow Could Reach 100,000


Utilities Or Refineries? Sell One, Buy The Other

I want to talk about a corner of the market that has been overlooked for far too long despite offering sustainable high yields of 4% or more—with dividends primed to soar even more.

This sector is a distant cousin to a more familiar group of stocks: utilities. Utility stocks were once Wall Street’s best kept secret: high dividends, cheap valuations, sustainable business models, and steady revenues were all reasons why many big investors quietly bought these small regional companies. Sadly, the cat’s out of the bag. Utility stocks are up nearly 14% year-to-date as investors pile into the sector:

Utilities Gone Haywire

XLU-CRAKPrice-Chart-YTD


Just look at the performance of the SPDR Utility ETF (XLU), which is up massively even after a recent correction from its shocking 22% year-to-date return earlier this summer. But notice the other line in that chart—that’s the VanEck Vectors Oil Refiners ETF (CRAK), a new and tiny ETF that tracks the oil refineries sector. This ETF is new and tiny for one simple reason: the market has ignored refineries even as it has a love affair with utilities..…continue reading HERE

…also Michael Campbell on – The Formula For Social Unrest & Political Upheaval

Stock Trading Alert: Stocks Extend Their Fluctuations As Investors Await Series Of Economic Data Releases

Briefly: In our opinion, speculative short positions are favored (with stop-loss at 2,210, and profit target at 2,050, S&P 500 index).

Our intraday outlook is bearish, and our short-term outlook is bearish. Our medium-term outlook is now neutral, following S&P 500 index breakout above last year’s all-time high:

Intraday outlook (next 24 hours): bearish
Short-term outlook (next 1-2 weeks): bearish
Medium-term outlook (next 1-3 months): neutral
Long-term outlook (next year): neutral

The main U.S. stock market indexes were mixed between -0.2% and +0.5% on Wednesday, as investors continued to hesitate after recent move down. The S&P 500 index continues to trade below its two-month-long consolidation following June – July rally. Is this a new downtrend or just quick downward correction? The nearest important level of resistance is at around 2,170, marked by Friday’s daily gap down of 2,169.08-2,177.49. On the other hand, support level is at 2,120-2,130, marked by recent local lows, as we can see on the daily chart:

42535 a
Larger Image

Expectations before the opening of today’s trading session are positive, with index futures currently up 0.4%. The European stock market indexes have been mixed so far. Investors will now wait for series of economic data announcements: Initial Claims, Retail Sales, Producer Price Index, Philadelphia Fed, Empire Manufacturing at 8:30 a.m., Industrial Production, Capacity Utilization at 9:15 a.m., Business Inventories at 10:00 a.m. The S&P 500 futures contract trades within an intraday uptrend, as it retraces some of its yesterday’s decline. The nearest important level of resistance is at around 2,130-2,135, marked by short-term local highs. On the other hand, support level remains at 2,100-2,110, as the 15-minute chart shows:

 42535 b

Larger Image

The technology Nasdaq 100 futures contract follows a similar path, as it retraces some of its yesterday’s move down. The nearest important level of resistance is at around 4,750-4,770, marked by short-term local highs. The nearest important support level is at 4,700-4,720. For now, it looks like a consolidation following Monday’s rally:

42535 c
Larger Image

Concluding, the broad stock market continues to fluctuate following its recent move down. For now, it looks like consolidation within a downtrend. Therefore, we continue to maintain our speculative short position (opened on July 18th at 2,162, S&P 500 index). Stop-loss level is at 2,210 and potential profit target is at 2,050 (S&P 500 index). You can trade S&P 500 index using futures contracts (S&P 500 futures contract – SP, E-mini S&P 500 futures contract – ES) or an ETF like the SPDR S&P 500 ETF – SPY. It is always important to set some exit price level in case some events cause the price to move in the unlikely direction. Having safety measures in place helps limit potential losses while letting the gains grow.

Thank you.

Michael Campbell on – The Formula For Social Unrest & Political Upheaval

S&P 500 Testing Recent Breakout

Summary

History tells us retests often occur after markets push to important new highs.

Historical example of retest after a breakout from a long-term consolidation box.

What can we learn from the S&P 500’s monthly chart?

Retests Can Occur After Breakouts

Typically, when markets (NYSEARCA:SPY) break out from long-term consolidation boxes, it tells us something has fundamentally changed. However, the fundamental drivers that kept the market contained in the consolidation box may still need one more shakeout or retest before the market can push higher.

For example, after the S&P 500 (NYSEARCA:VOO) went basically nowhere between November 1993 and February 1995, the bulls finally mustered enough conviction to push price above the orange box below. After the bullish breakout from the long-term range, sellers needed one more shakeout before the market pushed higher. The retest occurred above the green arrow.

saupload SPX1995RetestA

….continue reading HERE

….related:

Marc Faber: Dow Could Reach 100,000