
Stocks & Equities
 Dr. Doom explains why central bank intervention is leading to inequality and how to invest in this risky environment
Dr. Faber: They could essentially monetize everything, and then you have state ownership. And through the central banking system, you introduce socialism and communism which is state ownership of production and consumption. You would have that, yes, that they can do.
The BoJ owns more than 50 percent of Japanese ETFs [exchange traded funds], which own large parts of the underlying companies. So indirectly they may own 20 percent of the Japanese companies, and they can go up to a higher level.
I don’t think the central bankers are intelligent and smart enough to understand the consequences of their monetary policies at present. They focus on inflation but in my view they shouldn’t do anything. They don’t focus enough on what it does to the average standard of living of the people, to the average household income.
….related from Martin Armstrong:
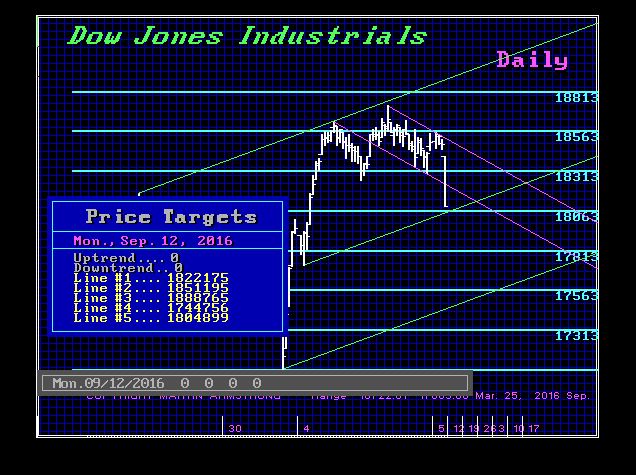
“Our three targets have been given countless times – 18500, 23000, and the 30000–40000. Well we reached the first level. We will breakout to the next. Then we will see about the third.

With markets moving sideways in the last while and investors concerned over how the economic backdrop will impact earnings, we wanted to see which companies can and have taken shareholder value into their own hands by giving back to the shareholders through both share repurchases and dividend increases. The argument as to whether share repurchases or dividends are better for investors is ongoing and a topic for another time, but needless to say, a bit of both is not going to hurt shareholders (as long as the company can afford it). We have kept this filter simple with the following requirements:
-
Trades in Canada
-
Outstanding shares have decreased by 5% or more over the last 12 months
-
Dividend growth of greater than or equal to 5% over five years
The decline in share count means that existing shareholders will have a greater share of the earnings than they did a year ago while also receiving a greater amount of cash in their bank account over the long term from the dividend. Interestingly, decreasing the share count with excess cash makes it easier to raise dividends through sustainable cash flows as less shares means less total dividends being paid (i.e. $1 per share on ten shares one day, then $1 per share on five shares tomorrow while sustainable cash flows remain steady), allowing for higher dividends inthe future. The torque that can occur here can be impressive!

The list is a short one with ten names making the cut. Interestingly, four of the names are companies we either cover or hold in our model portfolios (or both). Of the names that grab our attention, we think TFI is interesting due to the momentum the company is seeing in the share price while holding an arguably cheap valuation (albeit cyclical). Add in some fairly aggressive share buyback levels and it is a name worth noting. The clear winner on this list, in our view, would be Sylogist (Ticker: SYZ). SYZ is a name we have held in our model portfolio for some time now, has announced they feel their shares have been undervalued for a few quarters and has backed up their statements by repurchasing a good deal of shares while materially increasing dividends. Regardless, all names on this list have been rewarding shareholders over the long-term and we tend to find that the companies that have done it in the past continue to do it in the future when appropriate and everyone seems to win over the long-term.
Canadian MoneySaver is an acclaimed investment advisory with a recognized reputation for providing a trustworthy and down-to-earth service since 1981.
….also Michael Campbell interviews The Legend Jim Dines

We should see a new low this week in the share markets as concern over a rate hike hits the markets globally coming from the Fed and Hillary they have finally said on Sunday has pneumonia.
We will provide the timing arrays for this week on the Private Blog for client eyes only.
….related:
How Hillary Clinton’s health scare threatens the financial markets
Briefly: In our opinion, speculative short positions are favored (with stop-loss at 2,210, and profit target at 2,050, S&P 500 index).
Our intraday outlook is bearish, and our short-term outlook is bearish. Our medium-term outlook is now neutral, following S&P 500 index breakout above last year’s all-time high:
Intraday outlook (next 24 hours): bearish
Short-term outlook (next 1-2 weeks): bearish
Medium-term outlook (next 1-3 months): neutral
Long-term outlook (next year): neutral
The U.S. stock market indexes lost 2.1-2.6% on Friday, breaking below their two-month-long consolidation, as investors’ sentiment worsened following Fed rate hike fears, among others. The S&P 500 index broke below support level of 2,150-2,160, marked by previous local lows. It got back slightly below its last year’s high at around 2,135. The nearest important level of resistance is at 2,150, marked by recent support level. On the other hand, potential level of support is at 2.100-2,120, marked by some previous local highs. Is this a new medium-term downtrend, or just quick downward correction within an over half-year long uptrend?

Expectations before the opening of today’s trading session are negative, with index futures currently down 0.6-0.8%. The European stock market indexes have lost 1.4-2.0% so far. The S&P 500 futures contract trades within an intraday downtrend, as it continues its Friday’s decline. The nearest important level of resistance is at around 2,125, marked by Friday’s daily low. On the other hand, support level is at 2,100 mark. There have been no confirmed positive signals so far. However, we can see some short-term overbought conditions:

The technology Nasdaq 100 futures contract follows a similar path, as it extends its last week’s sell-off. The nearest important resistance level is at around 4,670-4,680. On the other hand, support level is at 4,600-4,620, among others. There have been no confirmed short-term positive signal so far:

Concluding, the broad stock market broke below its two-month-long consolidation on Friday, as the S&P 500 index got back below its last year’s high of 2,135. We continue to maintain our already profitable speculative short position (opened on July 18th at 2,162, S&P 500 index). Stop-loss level is at 2,210 and potential profit target is at 2,050 (S&P 500 index). You can trade S&P 500 index using futures contracts (S&P 500 futures contract – SP, E-mini S&P 500 futures contract – ES) or an ETF like the SPDR S&P 500 ETF – SPY. It is always important to set some exit price level in case some events cause the price to move in the unlikely direction. Having safety measures in place helps limit potential losses while letting the gains grow.
Thank you.
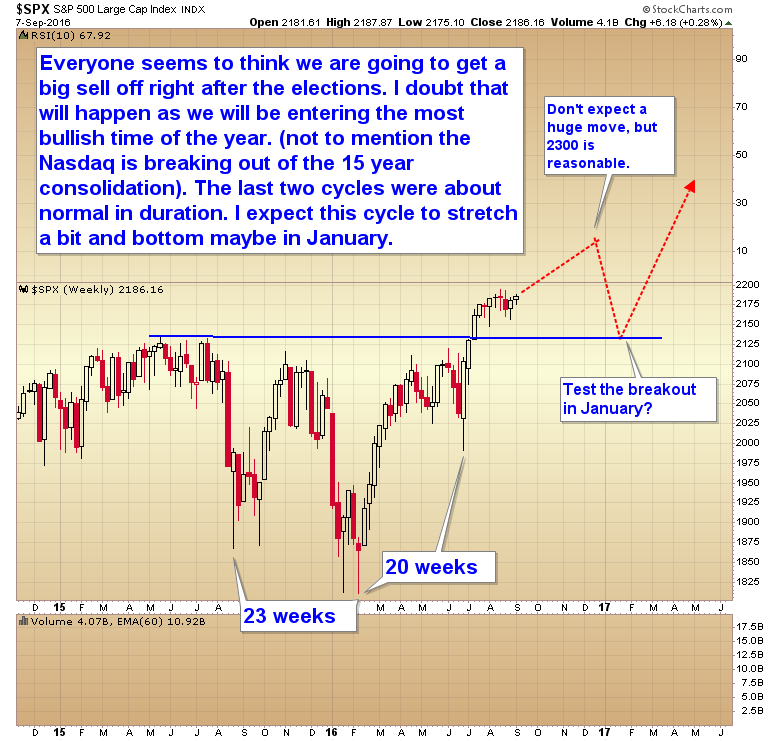
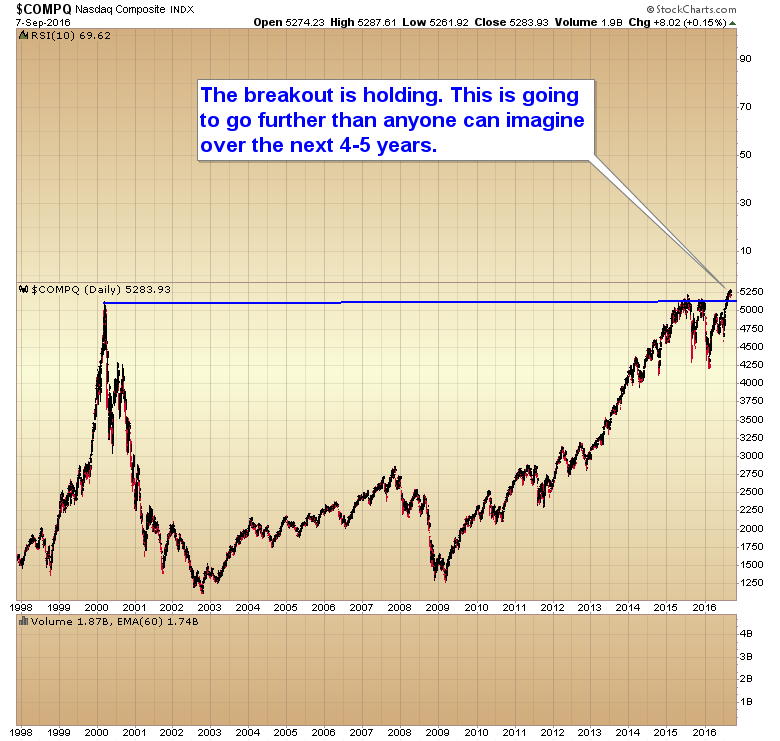
Everyone seems to think we are going to get a big sell off right after the elections. I doubt that will happen as we will be entering the most bullish time of the year (not to mention the Nasdaq is breaking out of its 15 year consolidation). The last two intermediate cycles were about normal in duration. I expect this cycle to stretch a bit and possibly not bottom until January.
http://blog.smartmoneytrackerpremium.com/
….related: Be Really Careful Here

-
I know Mike is a very solid investor and respect his opinions very much. So if he says pay attention to this or that - I will.
~ Dale G.
-
I've started managing my own investments so view Michael's site as a one-stop shop from which to get information and perspectives.
~ Dave E.
-
Michael offers easy reading, honest, common sense information that anyone can use in a practical manner.
~ der_al.
-
A sane voice in a scrambled investment world.
~ Ed R.
Inside Edge Pro Contributors

Greg Weldon

Josef Schachter

Tyler Bollhorn

Ryan Irvine

Paul Beattie

Martin Straith

Patrick Ceresna

Mark Leibovit

James Thorne

Victor Adair