
Stocks & Equities
 It’s no secret that Felix Zulauf, a member of Barron’s Roundtable, has made timely calls in the past. Just last December on FS Insider, Zulauf called the bottom in gold, which has since risen about 30 percent.
This time on Financial Sense, Zulauf discusses his current outlook and how problems developing in China and Europe may affect both the US and world economy.
….also:

Summary
Looking back at 20 years.
Forward returns are historically muted as cumulative days increase.
Approaching record levels.
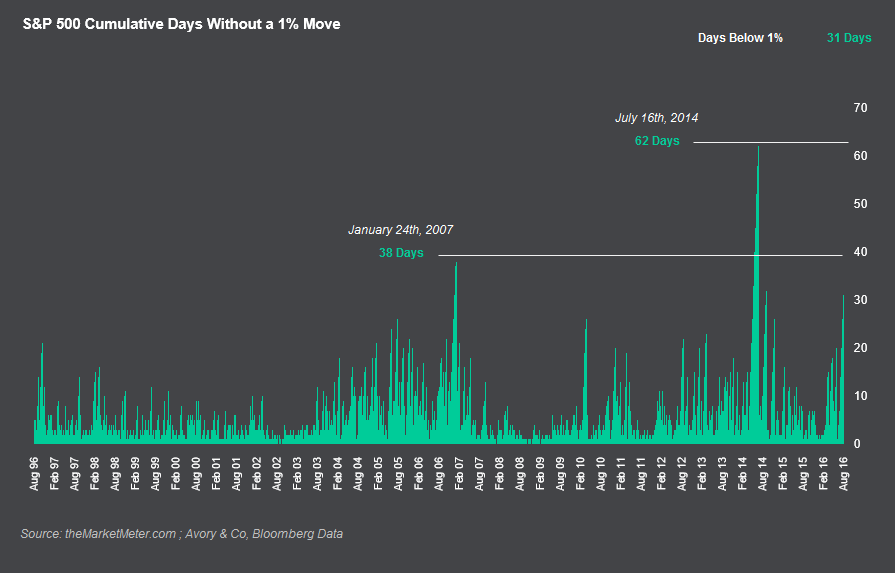
As shown by our chart above, we haven’t had a 1% move in 31 days now for the S&P 500 (NYSEARCA:SPY). This is starting to approach record levels since 1996.
….related:
 Have patience. All things are difficult before they become easy.
Saadi
For the past few months, we continued to Google the Term, Dow 19K, Dow 20K and Dow 21K. We got the most hits on the search term Dow 20,000, but the noise was not enough for us to take these developments too seriously. However, when we noticed that CNBC published two similar titled articles within a time span of 30 days, it was time to take note.
It is a known fact that when sites such as CNBC take a stance, your best bet is to take an opposing position or move to the sidelines. Too many sites are calling for Dow 20,000, and the Dow has not even traded past 19,000 which means that the markets are more likely to head lower than higher.
All top sites like Barons, moneypress.com, Cnn.com, etc. have an uncanny knack of being in the wrong camp and precisely the right time. The chatter calling for Dow 20, 0000 has hit a level that is too much for us to ignore.
Dow 20,000 is coming this year, and here’s why: Strategist CNBC July 16, 2016
Dow 20,000? Don’t laugh. Bulls are alive and well Money.CNN Jul 15, 2016
Dow To Hit 20,000? ETFs To Play Yahoo Finance July 18, 2016
Dow hitting 20,000 soon? Wall Street says it will happen CNBC Aug 6, 2016
Wall Street’s New Target: Dow 20000 Wall Street Journal Aug 10, 2016
The Dow at 20,000 in a year is now the consensus forecast Market watch Aug11, 2016
Dow 20,000 in 2017? Maybe Kiplinger Aug 16, 2016
The Dow Could Reach 19,000 or Even 20,000 The Street Aug 18, 2016
In a very recent article, titled crude oil bottom likely to propel Dow higher we made the following comment
The consolidation in oil appears to be over and given their relationship, the Dow together with Crude oil could be gearing up to trade to new highs. Ideally, (but it is not necessary) the Dow would test the 17,800-18,000 ranges before making a break for 19,000.
This surge in bullish sentiment might provide the necessary impetus for the markets to let out some steam before attempting to trade to and past 19,000.
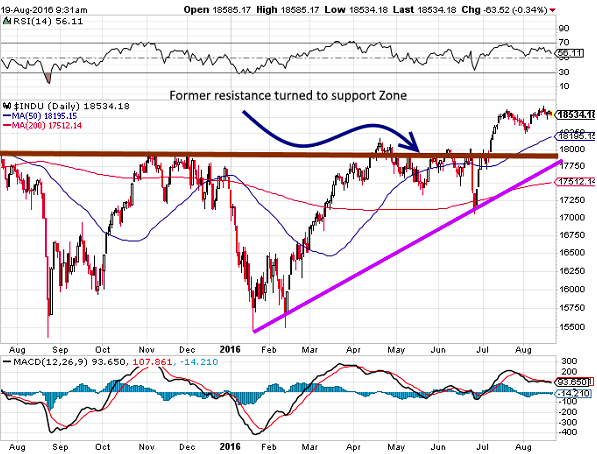
When mainstream media starts to jump on the bandwagon, we start to get nervous and so it is more likely that the Dow will test 17,800-18,000 ranges before surging to 20,000. This zone represents former resistance that has turned into support as indicated in the chart above.
Conclusion
Popular media outlets are just too bullish, and they are turning bullish after the market has surged to new highs; from a contrarian perspective, this is a negative development. The trend in all the indices is up, so the longer term outlook is still bullish. Forget Dow 20,000 for now; the Dow is more likely to trade lower than surging to new highs.
Consider the hour-glass; there is nothing to be accomplished by rattling or shaking; you have to wait patiently until the sand, grain by grain, has run from one funnel into the other.
John Christian Morgenstern
 The Bank of Japan decided at its July 28–29 meeting to boost its purchases of exchange-traded funds (ETFs) to an annual rate of 6 trillion yen, almost double the previous rate of 3.3 trillion yen. The BOJ began its ETF purchasing in October 2010 at a much more modest annual pace of roughly 450 billion yen. The rate was doubled to 1 trillion yen a year in April 2013 and increased further to around 3 trillion a year in October 2014. As a result of the latest doubling of the BOJ program, BOJ purchases are averaging 2.9% of daily trading values, doubling the previous average.
The ETF purchase program has the apparent objectives of improving market confidence and stimulating consumer and business spending. Its success so far in furthering those objectives has been modest at best. However, equity prices are surely higher…
…also don’t miss Michael’s Mid-Week Update – List of Rapid Technological Changes Here Now!
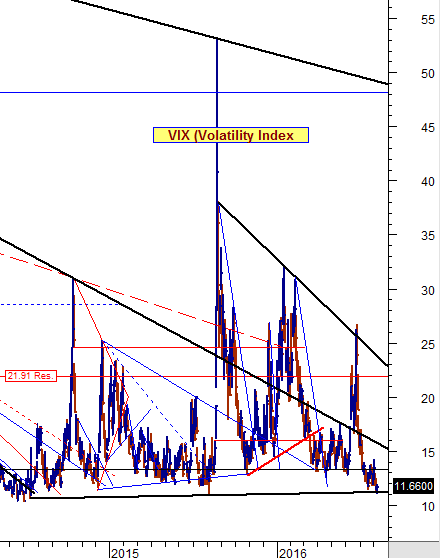
The chart below is from yesterday’s close and it show’s the VIX (Volatility Index) back to early 2014.
If you look at the chart, the VIX has a long term support line that it is finally testing.
Remember … that a higher VIX equals a lower market since they are inverse to each other. Therein comes the risk for you, so please keep an eye on the VIX.
….check the fear and greed index chart in: Wake Up and Smell the Bull Trap! (scroll down)

-
I know Mike is a very solid investor and respect his opinions very much. So if he says pay attention to this or that - I will.
~ Dale G.
-
I've started managing my own investments so view Michael's site as a one-stop shop from which to get information and perspectives.
~ Dave E.
-
Michael offers easy reading, honest, common sense information that anyone can use in a practical manner.
~ der_al.
-
A sane voice in a scrambled investment world.
~ Ed R.
Inside Edge Pro Contributors

Greg Weldon

Josef Schachter

Tyler Bollhorn

Ryan Irvine

Paul Beattie

Martin Straith

Patrick Ceresna

Mark Leibovit

James Thorne

Victor Adair