
Stocks & Equities
We are currently experiencing a “Kondratiev Winter” stage in this stock market which is at its’ “tipping” point. This is where nominal to incremental highs on the SPX can be exceeded by 2%, but, by no more than 4%. I am observing a “MARKET FAILURE” right here and now. This is a BULL TRAP!
Last Fridays’, August 5th, 2016 rally in the SPX big price move, on low volume, resulted in no trend change to the larger BEARISH patterns. It does not change the Bearish pattern, but it probably does mean that the current rally will last for at least a few more days. There are multiple times in which rallies are reversed during the early part of the following week after a strong jobs report.
Both investors and traders continue to throw money at stocks every time that there is any hint of “manufactured” good news. The majority of stocks, on the NYSE, are still in ‘downtrends’. Last Friday, August 5th, 2016, the Bureau of Labor Statistics released their “bogus” jobs report claiming that 255,000 new jobs were created.
This strong number caused gold to drop sharply, which momentum traders could have profited handsomely if they knew about the rouge price spikes taking place in gold just hours before the move.
The labor participation rate rose a mere 0.2 percent to 62.8 percent which is at a 40 year low. This means that potentially over 90 million Americans are still not working.
After adding only 11,000 jobs, in May of 2016, the Bureau of Labor Statistics would have the public believe that the US has now added over 550,000 jobs, in the sixty-day period, since. I find these numbers still hard to believe. There is no actual evidence of this having occurred:
It is all just a statistical adjustment as well as the “seasonal adjustment” factor as mentioned by Zero Hedge.
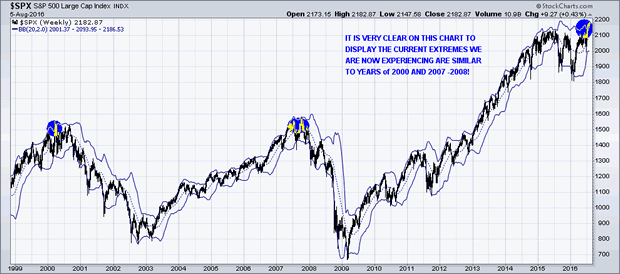
Over the past 120 years, within in a 7-year bull market, it is during the Fall season of the 7th year when the next major decline commences. The SPX is putting in its’ final TOP. It will become a well-defined top that usually cannot exceed a 2% to 4% throw over.
We are currently witnessing an extremely aged and overvalued bull market. The SPX Index, despite the exuberance of “record highs,” is just 2% above its’ May 2015 peak. The SPX has pushed it to its’ most extreme overvalued, overbought and over bullish syndrome in an environment where momentum is slowly rolling over. Whether one is bullish or bearish, one needs to recognize that any current extremes are “unparalleled”.
Statistically speaking, the single most probable outcome is actually a small gain which we have experienced and which is then followed by abrupt and severe losses that can have the potential of wiping out weeks or even months of upside progress with an unexpected and rapid decline.
I will have to wait for the market sentiment to shift toward “risk-aversion”, before participating in any long-term bearish ETF trades. Within an increased global systematic world, both investors and traders are making “risky and unparalleled” bets, these days.
I can visualize the financial meltdown. Many financial entities will have lower profits since low interest rates persist. Historically, low yields squeeze the net interest income of banks and make liabilities harder to meet for insurance companies. I would cut their EPS forecasts by 5%-7%. The fall in Treasury yields explains most of the cut. Their strong headwind is headed our way.
Sell into These Rallies:
If you are still in the stock market, I continue to recommend to sell stock positions into the rallies.
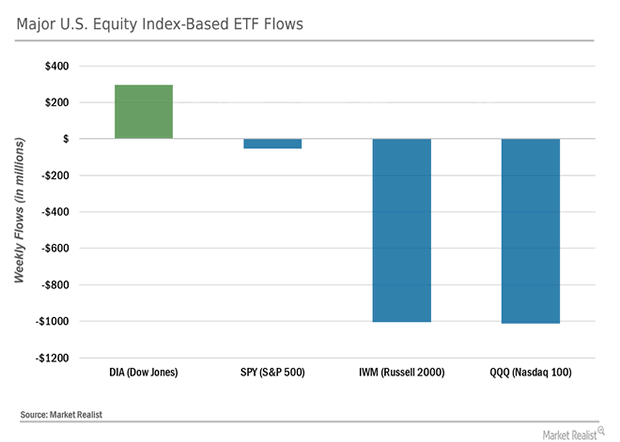
Chart End of July 31st, 2016
Take a look at the stock index outflows in July. This shows money continues to leave the leading indicator stocks (Russel 2k, and the Nasdaq).
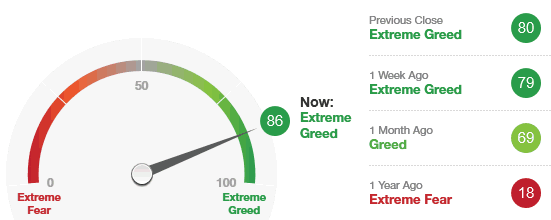
CNN Chart of Fear and Greed August 6th, 2016
Now, take a look at the fear index. While I personally use a slightly different mix of indicators to measure market sentiment, this is very close to my calculation and shows it in a simple visual format.
Conclusion:
With all of the “Extreme” complacently and the “Extreme” greed in the stock market, it is the perfect storm for DISASTER!
With that said, nothing happens exactly when it should in the stock market. The market is constantly trying to get the mass of participants on the wrong side of the market. If it doesn’t shake you out, it will wait you out and I feel it’s doing the later method now.
….also from Chris: Stocks Will Have a ‘Waterfall Decline’ and Silver Will ‘Skyrocket’ in August!


![]()
In This Week’s Issue:
- Weekly Commentary
- Strategy of the Week
- Stocks That Meet The Featured Strategy
Stockscores Market Minutes Video – Beware of Stock Tips –
Many people rely on stock tips for their trading ideas but there are many problems with this approach. This week I discuss why you should be very cautious with stock tips and then provide my weekly market analysis. Click Here to Watch To get instant updates when I upload a new video, subscribe to the Stockscores YouTube Channel
Trader Training – Why It Does Not Pay to Be Informed
In theory, information should make the stock market’s world go round. Information about companies and their ability to make money in the future is what should determine share price. As the market learns of new information, price is adjusted up and down to reflect the value of that information.
This implies that investors should focus their analysis on information so they can predict where share prices should go in the future.
While this makes good sense, I have found it to be extremely rare that investors who use information are able to consistently beat the stock market. With smaller retail investors (you and I) in particular, the use of information for making investing decisions is more destructive than it is beneficial. Here are ten reasons why:
1. Information is Usually Already Priced In – most investors use publicly available information. That means it is widely known and available to anyone considering the stock. If information is available to a large number of investors then we should expect that the market will have priced that information in to the stock. Therefore, the information has not value to us.
2. Information Usually Comes with a Bias – as a general rule, people do what they are financially motivated to do. If someone is encouraging you to purchase a stock, there is a good chance that they have some financial motivation to do so. Before you trust the information you receive, understand the financial motivation. If you find the reason, you will often usually find that there is a strong bias in the information being provided to you.
3. Trading on Truly Insider Information is Illegal – there are few risk free trades in the stock market, but trading on significant, inside information is one. You stand to make a lot of money buying stock in a company that will be acquired by another at a premium tomorrow. If you have that information and act on it, you are trading on inside information and that can land you in jail.
4. Gathering Good Private Information is Expensive and Time Consuming – there are investors who are able to uncover information that is not priced in to a stock but is not considered inside information. This private information is valuable because it can lead to market beating returns. However, gathering private information typically requires significant resources, knowledge and time. For small investors, it is not feasible to do this kind of work across a broad range of stocks.
5. Information Causes You to Ignore the Market’s Message – when you have an understanding of a company’s story, there is a tendency to fall in love with that story and ignore new information that goes against your outlook for the stock. This leads the committed shareholder to hang on to a losing position, allowing the loser to bog down the performance of the overall portfolio.
6. You May Not Have All of the Information You Need – the market tends to focus on two or three key information points that affect the price investors are willing to pay for it. An investor who does a thorough fundamental analysis of the stock may still have an incomplete understanding of the company’s business. If missing one of the key points, this investor can make a gross error in valuing the stock.
7. The Market May Not Be Trading On Fundamentals – in theory, stock price is based on the present value of future earnings expectations. In practice, there are often very non fundamental influences on share price. A large investor that has a liquidity crisis may be forced to unload a large position with little regard for price. Often, the laws of supply and demand affect share price even though theory tells us that they should not have an influence.
8. Your Interpretation May Not Be the Same as The Market’s – Our mood affects how we judge information and the same can be said for the market in general. Your fundamental analysis may be correct in an optimistic environment, but if the market is in a pessimistic mood, the investment can lead to losses. Even the market is wrong, it is right.
9. There Is No Standard for What Information is Worth – There are many formulas for determining what a company’s share price should. Many fundamental analysts look for stocks to trade at a certain multiple of their earnings with that multiple to be based on growth. However, there are great variations in accounting methods that can have a profound effect on how earnings are reported. More importantly, there is no rule that a company should trade at a certain multiple of earnings, that target multiple is just an opinion.
10. We Tend to Focus On Information That is Easy to Get – we often look for the easiest way to achieve a goal. With information, there is a tendency to focus on the information that is front of us. Rather than work to find something to disprove our thesis on a stock, we instead look for information to strengthen our thesis. In doing so, we present our own biased outlook for our investment decisions that can often be very incomplete and wrong.
Ultimately, I look at the market’s interpretation of all available information when I look at a chart of price and volume. It shows not only every bit of information detail but also what the market thinks of it.

This morning, I ran the Morning Movers CDN Market Scan in search of stocks with good daily and weekly charts for longer term position trades. Energy dominated the list of candidates, here are two that have good three year charts.
1. T.ERF
T.ERF has been strong for a few months but stalled its upward trend over the past month. Looks to be resuming the trend with a cup and handle pattern break on the weekly chart. Support at $7.50.

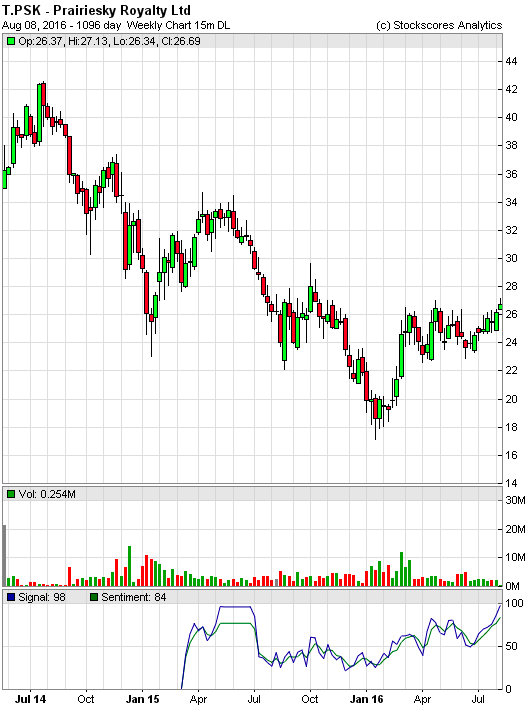
2. T.PSK
T.PSK is breaking through resistance from an optimistic rising bottom pattern after breaking the downward trend line. Support at $24.80.
Alert: Don’t miss Michael’s great interview with the highly regarded Greg Weldon: On The Brink of Soaring Move In Gold & Silver
References
- Get the Stockscore on any of over 20,000 North American stocks.
- Background on the theories used by Stockscores.
- Strategies that can help you find new opportunities.
- Scan the market using extensive filter criteria.
- Build a portfolio of stocks and view a slide show of their charts.
- See which sectors are leading the market, and their components.
Disclaimer
This is not an investment advisory, and should not be used to make investment decisions. Information in Stockscores Perspectives is often opinionated and should be considered for information purposes only. No stock exchange anywhere has approved or disapproved of the information contained herein. There is no express or implied solicitation to buy or sell securities. The writers and editors of Perspectives may have positions in the stocks discussed above and may trade in the stocks mentioned. Don’t consider buying or selling any stock without conducting your own due diligence.
The First Rebuttal website has coined a term that gets to the heart of an increasingly dysfunctional system: The too-big-to-fail stock market. The general thesis is that most major countries are over-leveraged to that point of maybe being unable to survive a garden variety equities bear market – and are doing their best to avoid finding out. Here’s First Rebuttal on the effects of such a prop-up-asset-prices-at-any-cost policy:
The structural economic problems of stalled incomes, peaked debt and welfare make operational expansion i.e. sustainable growth extremely difficult, which has led to investment concentration in secondary equity markets. And that means the higher valuations simply represent higher risks.
The offshoot is that as such a large concentration of total asset value is dependent on the market, it becomes necessary to maintain the market at all costs. The market has become too systemically important to allow it to fail. And that means policymakers have changed the function of the market. The market left to its own devices is a consequence of the underlying economy. Today, however, the market is being used as a (false) portrayal of the underlying economy. It is intentionally using the logical fallacy of confusing cause and effect.
That is, the thermostat is no longer meant to reflect the temperature inside the house, its only use is to convince you the house is warm. That means policies are being targeted at manipulating the thermostat rather than keeping the furnace hot. The consequence is a spiraling of resource misallocation, furthering the structural breakdown of economic activity making it ever more important to keep the market looking strong. The market is no longer a market as we understand the term.
The upshot: Markets no longer serve their intended purpose of efficiently allocating capital. Since capitalist wealth creation depends on that function, today’s world can no longer be called “free” or “market-based” in any meaningful sense.
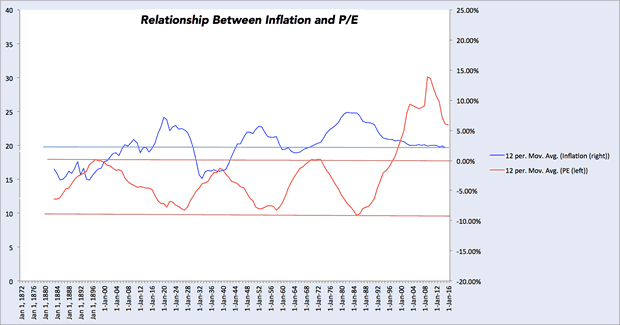
The article illustrates this phase change with a chart showing equity P/E ratios over the past century-and-a-half which reveals a dramatic spike beginning in the 1990s – that is, when Alan Greenspan and his successors at the Fed decided that the big banks had to be protected from the folly of their own mistakes.
So what does this mean? First, while headlines continue to convey a sense of normality, under the surface the system is rotting away. Good jobs are becoming scarce and capital is being directed towards things that will never generate enough cash flow to pay off the related debt. (Rising) financial asset prices are increasingly disconnected from the (falling) value of underlying assets.
The evidence of this is everywhere, from pension plans that lie about their funding levels, to corporations that report non-gap earnings and are rewarded with higher share prices, to governments that report plunging unemployment rates while citizens leave the workforce in droves.
It’s no longer possible, in short, for most people to tell what’s real and what’s not. And since markets’ main function is to reveal underlying truths, it’s not a surprise that governments have decided to hijack the message.
…also: A clear, concise and gripping interview between Michael Campbell and the highly praised Greg Weldon – On The Brink of Soaring Move Up In Gold & Silver
The risk levels for the future remain high …
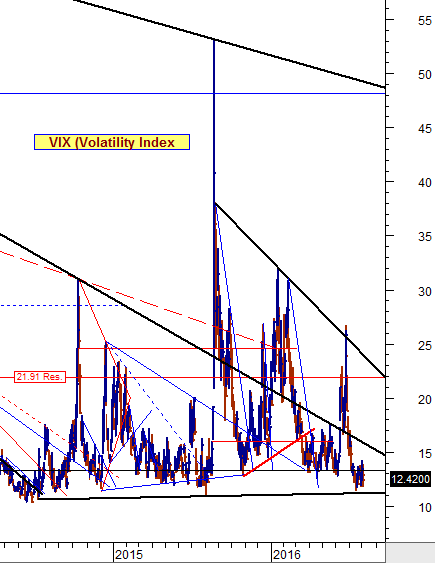
Take a look at the chart of the VIX that we posted today and note that the VIX has been moving down toward its support line, but has not reached it quite yet. As it moves down, the stock market moves up because the VIX moves opposite to the stock market.
Seeing that there was a recent breach on the most recent fan resistance line, there is a very strong possibility that it will be retested.
also from Larry Edelson:

Stock Trading Alert originally sent to subscribers on August 4, 2016, 6:38 AM.
Briefly: In our opinion, speculative short positions are favored (with stop-loss at 2,210, and profit target at 2,050, S&P 500 index).
Our intraday outlook is bearish, and our short-term outlook is bearish. Our medium-term outlook is now neutral, following S&P 500 index breakout above last year’s all-time high:
Intraday outlook (next 24 hours): bearish
Short-term outlook (next 1-2 weeks): bearish
Medium-term outlook (next 1-3 months): neutral
Long-term outlook (next year): neutral
The main U.S. stock market indexes gained 0.2-0.3% on Wednesday, retracing some of their recent move down, as investors reacted to economic data, quarterly earnings releases. The S&P 500 index continues to trade within a short-term consolidation following last month’s rally. The nearest important level of support is at around 2,150, marked by Tuesday’s daily low. The next important support level is at 2,130-2,135, marked by previous level of resistance. On the other hand, resistance level is at 2,170-2,175, marked by Monday’s all-time high of 2,178.29. The next potential resistance level is at 2,200. For now, it looks like a relatively flat correction within medium-term uptrend. Will the market continue higher? Or is this some kind of a topping pattern before downward reversal?


-
I know Mike is a very solid investor and respect his opinions very much. So if he says pay attention to this or that - I will.
~ Dale G.
-
I've started managing my own investments so view Michael's site as a one-stop shop from which to get information and perspectives.
~ Dave E.
-
Michael offers easy reading, honest, common sense information that anyone can use in a practical manner.
~ der_al.
-
A sane voice in a scrambled investment world.
~ Ed R.
Inside Edge Pro Contributors

Greg Weldon

Josef Schachter

Tyler Bollhorn

Ryan Irvine

Paul Beattie

Martin Straith

Patrick Ceresna

Mark Leibovit

James Thorne

Victor Adair