
Stocks & Equities
 It is not often that you get investment advice from a presidential candidate.
It is even rarer that you get good advice.
But yesterday, Republican presidential candidate Donald Trump gave investors both good advice and good analysis. Bloomberg has the report:
Donald Trump on Tuesday said interest rates set by the Federal Reserve are inflating the stock market and recommended 401(k)-holders to get out of equities, just like he did.
“I did invest and I got out, and it was actually very good timing,” the Republican presidential nominee said in a phone interview with Fox Business. “But I’ve never been a big investor in the stock market.”
“Interest rates are artificially low,” Trump said. “The only reason the stock market is where it is is because you get free money.”
Trump Is Right
Mr. Trump is right on the money.
The reason stocks are near their all-time highs is that there is a lot of free money around.
Money lent out at interest rates below the rate of inflation is free.
Of course, as we’ve been explaining to our 14-month-old grandson, it is not real money. It is fake money.
Like a claim ticket on someone else’s parked car. If you get there before the car’s real owner, you can drive away. Otherwise, you’ll have to walk.
“Money” has always been the subject of these Diaries. Except for occasional sorties into politics, crime, religion, and travel – from which we usually come back bruised from our Dear Reader mail – we stick to our beat, money.
For the last couple of months, we have been looking at fake money – the stuff we use to buy things and to store wealth.
It is like a GPS that gives you the wrong information. It tells you to turn right when you should turn left. It sends you to Ho-Ho-Kus when you were aiming for Hoboken.
You follow its directions and run into a brick wall.
Wrong Direction
The developed economies of the world seemed to run into a brick wall in 2008.
The free money just didn’t work the way it used to. And even though the feds rushed in with even more free money… there has been no real recovery.
Why? What’s the matter with free money?
It boosts the stock market. It makes some people – those who get to the parking garage first – rich.
Why doesn’t it bring about a real economic recovery, with higher real earnings for everyone?
That is the discussion we’ve been having with Dear Readers, grandson James, and anyone else who will listen.
In a nutshell, fake money buys real resources (aka capital). At artificially low interest rates, this fake money leads capital in the wrong direction.
It is invested in projects that don’t make sense… lent to governments that waste it… borrowed by corporations to buy back their own shares and cancel them (boosting the value of the remaining shares)… or used by speculators to make short-term bets.
It is as though a teenager got ahold of a fake claim ticket, took your car from the garage, drove it to across town and wrecked it.
Fiddles and Manipulations
In the absence of real money and honest interest rates… and with no way of knowing if they are adding wealth or destroying it… people use capital as though they had stolen it.
But don’t expect this system to change anytime soon. The authorities built it. They like it.
And they will do everything they can to keep it in business – even forcing drivers to put their cars in the garage!
Reporting on how new regulations favor investments in government debt over corporate debt in “prime funds” (money market funds that invest in short-term, low-risk debt), the Wall Street Journal reports:
Carmen Reinhart, a finance professor at Harvard University’s John F. Kennedy School of Government, says governments across the developed world are interfering more with private flows of cash as their financing needs soar.
Directing money to the state at the same time as the central bank keeps interest rates below inflation to boost growth amounts to a subsidy of the government by savers, a hidden tax.
“The way we have revamped regulation has clearly favored government debt,” she said. “The regulation creates the captive audience, and the monetary easing creates the ‘tax.’”
More fiddles. More manipulations. More accidents.
Our advice is the same as the Republican candidate: Try to stay off the road.
Regards,
Bill
related:
A “1 In 10,000 Year Event”: JPM Head Quant Explains Why The S&P Refuses To Sell Off
Portfolio Insight
Investors are having a love affair with “low-volatility” stocks, or stocks that jump around less than the market.
As a result, these stocks have become expensive. And investors are likely to earn poor returns.
I was in Italy last month for the Value Investing Seminar in Trani. And my friend Steven Wood of GreenWood Investors gave an excellent presentation on this topic.
Let’s start with this: People today (perhaps still smarting from the financial crisis) hate volatility. Many people – even people who should know better – are panic-selling assets when they fall 15% or 25%.
So in comes Wall Street with a solution to sell you: so-called “low volatility” funds.
One example is the iShares Edge MSCI Min Vol USA ETF (USMV). It’s full of stocks that don’t fluctuate that much compared to the market average.
Investors love USMV. From practically zero, it’s gone to having over $11 billion in assets. It’s part of a broader trend toward such stocks. And it’s creating a definite distortion in the market.
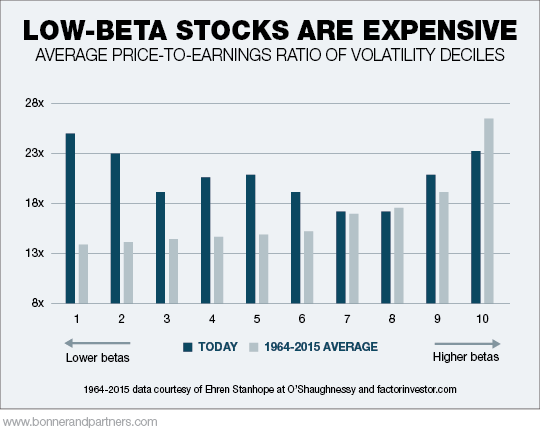
Steven had a few great charts showing this. Take a look at the one below. It shows you the market divided into 10 silos ranked by volatility. It also shows you the price-earnings (P/E) ratios today versus the 1964-2015 average for these different levels of volatility.
Low-volatility stocks are also known as “low beta” stocks. A low-beta stock moves less than the market. High-beta stocks move up and down more than the market does. If the beta is under 1.0, the stock is considered less volatile than the market, and vice versa.
The silo marked “1” in the chart below includes the lowest volatility stocks. These are what the market regards as “safe.” And you can see that the P/E for these stocks is over 23x – about double the longer-term average. Stocks on the lower-end of the volatility range are expensive versus their historical averages.
In the USMV fund, the average P/E ratio is over 30. Most of the stocks in the fund are big, mature companies that aren’t growing, or are even in decline. Among them are P&G (beta of 0.64, P/E of 23), Coke (0.83, 26), General Mills (0.67, 25), and McDonald’s (0.65, 23).
These blue chips carry lofty multiples not because they deserve them, but because they are low-beta and thus attract the big money flows seeking safety.
As Steven points out, this kind of thing can reach crazy extremes. In 1972, the so-called “Nifty Fifty” (stocks perceived as no-brainer stocks back then) had a P/E of 42x at the peak. Those stocks subsequently collapsed.
Beware the seemingly “safe” blue chip…

 Ever since Brexit, traders – and mostly bears – have been scratching their heads over not only by the S&P500’s tremendous rally but also but the market’s seeming ability to immediately digest through any incremental negative news, both economic and geopolitical and rebound immediately from a support level at around 2,150. And while there has been speculation of central bank intervention to prop up the S&P any time it approaches this key level (something which several years ago would be considered ridiculous but now is all too possible), it turns out there is another – perhaps even more unexpected – reason why the market remains “pinned” in its historic trading range of 2,150 to 2,180.
Here it the explanation from JPM’s head quant, Marko Kolanovic..…continue reading HERE
related:
 As a long-time market participant, I deal in reality and the greatest skill you can have is separating yourself from what Robert Prechter calls the “herding impulse.” In his landmark book on crowd psychology we learn it can actually cause stress, psychological pain and even psychosomatic illness to go against the crowd.
According to Prechter, “That is why, in financial markets, when the best time to buy or sell is at hand, even the person who thinks he should take action experiences a strong psychological pressure to refrain from doing so. He thinks, if only half consciously, ‘When my neighbor or advisor or friend thinks it’s a good idea, then I’ll do it, too. If I do it now, and I’m wrong, they will all call me a dope, and I’ll be the only dope.'” The discomfort of being alone in one’s convictions is so great that it involves physical reactions. One researcher says breaking the herding impulse by itself may induce pronounced autonomic activity such as sweating, twitching, flushing, muscle tightening and hair standing on end. A person’s reaction just “thinking” about taking an action apart from the herd can produce tenseness and even nausea.
related:
Michael Campbell interviews Don Vialoux: Is It The Season For Investing In Gold? or Oil? or Stocks?

This week, I focus on the Daytrader preset scan from the Stockscores Market Scan. This is a good way to build a watch list of stocks that are hot on the current day and have the potential to make an abnormal move in to the close. You can run this scan about 45 minutes after the open of trading and then monitor the stocks found with it using a real time charting program that most brokerages make available to their clients. I watch my Daytrader watch list for stocks satisfying my Superhero or Intraday Pullback Play strategies (these are taught in the Stockscores Active Trader course).
Today’s scan produced about 40 candidates, here are the moves and entry time for a few of those that qualified. (for the full newsletter “Gauging Trade Performance go HERE)
1. CLF
CLF gave an Intraday Pullback Play set up at 10:18 ET at $7.58. The closed the day at $8.02 for a 5.8% move in a few hours.

2. AKS
Superhero entry signal at 10:36 on AKS with an entry price of $5.69. Closed the day at $6.17 for a 4 to 1 reward for risk trade (for every $100 risked, a $400 profit).

(for the full newsletter “Gauging Trade Performance go HERE)
The stock market has hit a lot of records lately: all-time highs for the Dow Jones Industrial Average and for the S&P 500, with even the bond market making history (record-high prices and record-low yields).
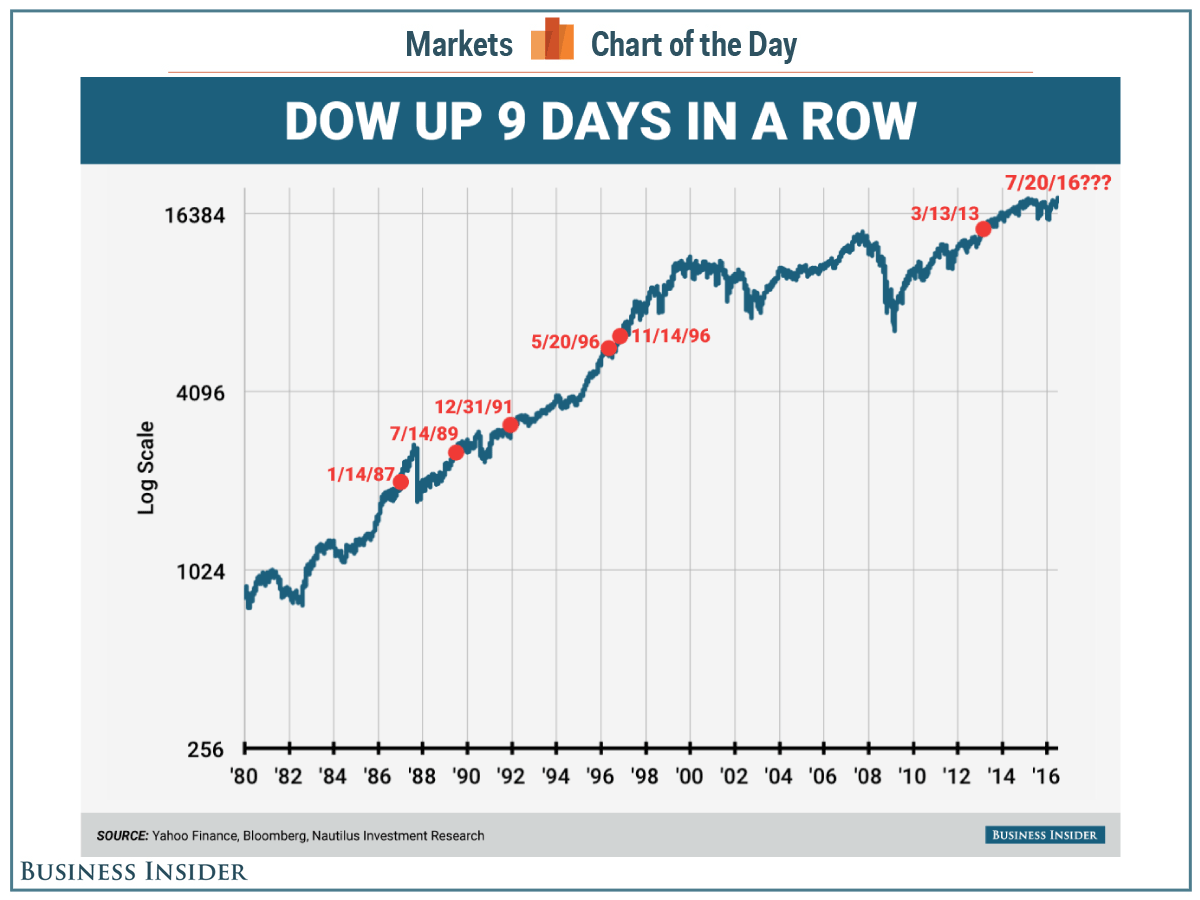
With the Dow closing higher on Wednesday, stocks just did something else historic, according to Nautilus Investment Research.
“We highlight two momentum signals we will be watching today,” Nautilus’ Tom Leveroni wrote in a note earlier on Wednesday. “An up close in the Dow Industrials today will give it 9 consecutive up closes, a rare feat of trend persistence.”
The Dow hit the ninth up day in a row — only the seventh time this has happened since 1980. In each of the other six instances, albeit on a small sample size, the index has been up the following six months with an average gain of 10.41%.
The largest of these upward moves was 22.05% after the market hit the streak on January 14, 1987, and the smallest was a 4.72% gain in the six months after it was hit on New Year’s Eve 1991.
Additionally, according to Leveroni, this is the 30th time this has happened since 1900, and the average gain in the following six months has been 5.96%.
So here’s to another record.
related:
Michael Campbell’s Mid-Week Update: The Capital Flood & All-Time Stock Market Highs

-
I know Mike is a very solid investor and respect his opinions very much. So if he says pay attention to this or that - I will.
~ Dale G.
-
I've started managing my own investments so view Michael's site as a one-stop shop from which to get information and perspectives.
~ Dave E.
-
Michael offers easy reading, honest, common sense information that anyone can use in a practical manner.
~ der_al.
-
A sane voice in a scrambled investment world.
~ Ed R.
Inside Edge Pro Contributors

Greg Weldon

Josef Schachter

Tyler Bollhorn

Ryan Irvine

Paul Beattie

Martin Straith

Patrick Ceresna

Mark Leibovit

James Thorne

Victor Adair