
Stocks & Equities
 The stock market has reached new all-time highs this week, just two weeks after plunging over the BREXIT result. The bulls are exuberant as they dance on the graves of short-sellers and the purveyors of doom. This is surely proof all is well in the country and the complaints of the lowly peasants are just background noise. Record highs for the stock market must mean the economy is strong, consumers are confident, and the future is bright.
All the troubles documented by myself and all the other so called “doomers” must have dissipated under the avalanche of central banker liquidity. Printing fiat and layering more unpayable debt on top of old unpayable debt really was the solution to all our problems. I’m so relieved. I think I’ll put my life savings into Amazon and Twitter stock now that the all clear signal has been given.
….continue Reading at TheBurningPlatform.com…
related:

Today I like to share my thoughts about the S&P 500 index, the volatility index, and what I believe will be the trigger/event which sends stock markets around the world to new multi-year lows.
While the charts shown here are very simple there is a lot of information behind the scenes that backup the analysis/predictions on the charts below.
For example, the sentiment of the average market participant remains extremely bullish on the market. The majority of investors think and feel stocks will continue to rise in the coming year. Typically, when the majority of investors think the same thing it tends to be a contrarian signal that the opposite will soon take place.
Cycle analysis is telling us that the seven-year cycle, which is one of the most powerful cycles that reoccurs in the stock market is now topping. What does this mean? It means we should expect a 1 to 3-year stock market correction.
The market breadth has been slowly deteriorating over the past year. Fewer stocks are making new highs, and many leading sectors are already in bear markets.
So it is just a matter of time before the US large-cap stocks roll over, breakdown, and start a new bear market.
As of Friday, July 9 we’ve seen the stock market momentum show signs of a short squeeze, and also that the majority of market participants are in a panic running to buy stocks. In fact, the NYSE volume ratio shows that there are 18 shares being purchased to every 1 being sold on Friday. I consider a ratio over three to be an extreme level, meaning 18 is signaling a potential significant turning point in stocks in the coming week.
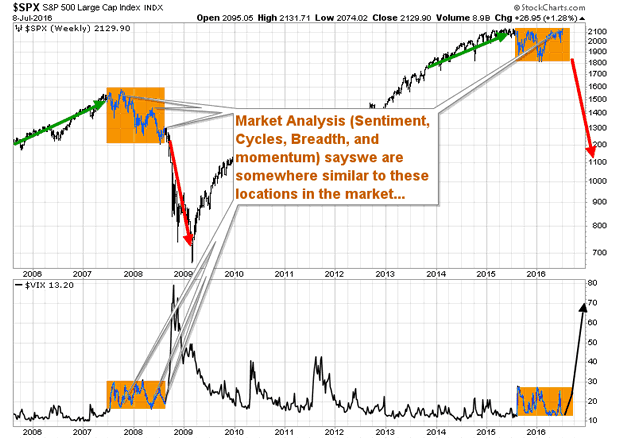
SP500 & VIX Weekly Comparison Chart
If you take a look at the chart below you can see where I feel the stock market is currently trading in terms of its 2007 to 2008 market top. The volatility index is also showing similar patterns to what we saw before the 2008 bear market.
Based on the current price action of the S&P 500 index and the volatility index it appears that a sharp decline in shares is likely to unfold in the coming weeks.
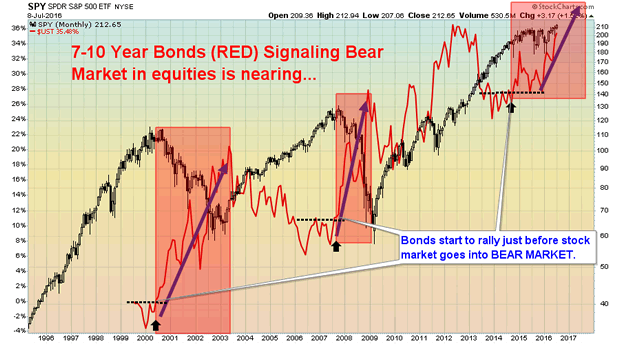
SP500 & Bond Price Comparison – Bonds rally before/lead Bear Markets
Take a look at the chart below. The red line is the price of US bonds. The black candlestick chart is the S&P 500 index which is the US large-cap stocks. As you can see the price of bonds start to rally way before the US stock market rolls over and sells off.
Why does this happen? I believe that the smart money is rotating their money slowly out of equities and into bonds in anticipation of the bear market collapse. Bonds act as a safe haven during times of weakness in both the economy and stock market.
US equities still have a long way to fall before they are technically in a confirmed bear market. The recent rally in bonds is just the beginning for what is to happen.
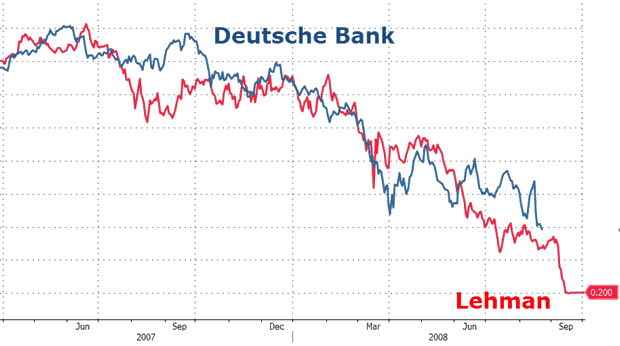
The Trigger/Event/Tipping Point for A Global Equities Crash
In a recent article called “Deutsche Bank to initiate the next financial crisis“, I wrote about how Deutsche Bank is going down the exact same road as Lehman Brothers. In short, both stocks are declining in a similar fashion in terms of share price.
But here is the kicker… If you thought Lehman Brothers was bad you haven’t seen anything yet. The big differences this time around with the banking crisis is that this is 40 times larger than Lehman Brothers and will directly affect almost all key countries and banks around the world. And this time, countries are in far worse shape financially than they were in 2008 during the Lehman Brothers bankruptcy.
My Concluding Thoughts:
In short, the US stock market is trying to hold up and convince investors everything is fine. While stocks are testing all-time highs I know as a technical analyst that the market is much weaker than it appears.
A lot of things are coming together to form a major market top but like all previous stock market tops, they require a lot of time to mature before they breakdown and new nominal highs are normal to see.
Chris at www.TheGoldAndOilGuy.com
related:
Summary
– Looking purely at demographics there appears to be important effects to stock performance.
– We quantify the peaks and troughs in the birth cycle.
– We’d expect a stock market low around the end of 2017.

…..view larger images & read more analysis HERE
related:

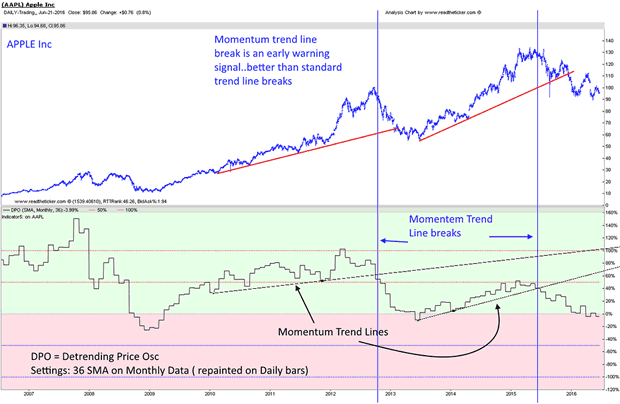
A change in long term momentum can forecast that the trend is near the end!
Energy is required to move a stock, and YES it does run out! Energy (demand or supply) can be measured by standard momentum tools (Detrending Price Osc), and keeping an eye on the longer term momentum trend is vital to keeping your profits.
Wyckoff traders must monitor long term momentum to check accumulation and distribution patterns on there charts. Major price weakness will be forecast by major momentum weakness.
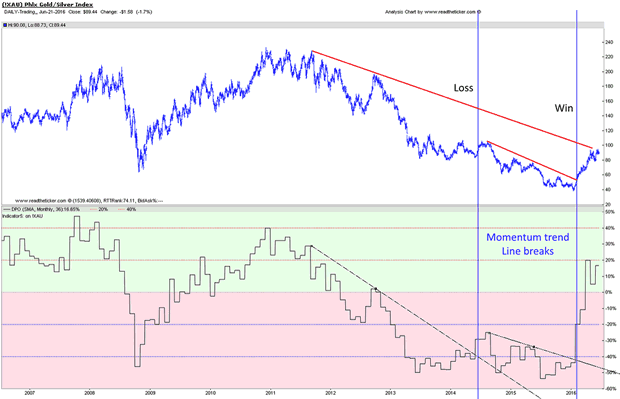
Below are two major trend changes.
Apple Inc
Metal stocks
Investing Quote…
“Success in trading means excess of profits over losses. If anyone tells you they can almost be invariably successful, put him down as trying to impose on your credulity.” ~ Richard D Wyckoff
“The stock market is filled with individuals who know the price of everything, but the value of nothing.” ~ Philip Fisher
“In the short run, the market is a voting machine, but in the long run it is a weighing machine.” ~ Benjamin Graham
“Successful speculation requires staying on top of changes in industries and companies that either create new industries or improve on existing industries. The majority of your profits will come from these two … The shrewdest traders throughout history all adapted the skill of reactionary change, as the market constantly presents new and different opportunities.” ~ Bernard Baruch
“Markets are constantly in a state of uncertainty and flux and money is made by discounting the obvious and betting on the unexpected.” ~ George Soros
related:
 The percentage of S&P 100 stocks above their 200 DMA is a technical indicator used to find the “sweet spot” time period in the market when you have the best chance of making money. According to this system, the market is now tradable and a signal to to enter and continue long trading.
…for full article and larger chart go HERE
also:

-
I know Mike is a very solid investor and respect his opinions very much. So if he says pay attention to this or that - I will.
~ Dale G.
-
I've started managing my own investments so view Michael's site as a one-stop shop from which to get information and perspectives.
~ Dave E.
-
Michael offers easy reading, honest, common sense information that anyone can use in a practical manner.
~ der_al.
-
A sane voice in a scrambled investment world.
~ Ed R.
Inside Edge Pro Contributors

Greg Weldon

Josef Schachter

Tyler Bollhorn

Ryan Irvine

Paul Beattie

Martin Straith

Patrick Ceresna

Mark Leibovit

James Thorne

Victor Adair