
Stocks & Equities
 Don’t gamble; take all your savings and buy some good stock and hold
it till it goes up, then sell it. If it don’t go up, don’t buy it.” – Will Rogers
Last week, we got a terrible, lousy, awful jobs report, and that was a good thing. Not for workers, of course, but it’s a good thing for investors because it most likely put the kibosh on the Federal Reserve’s wrong-headed plan to hike interest rates next week.
Janet Yellen and her friends on the Fed had been dropping strong hints to anyone and everyone that the Fed wants to raise rates, and they want to do it soon. As I explained last week, raising rates now is a bad idea, which, unfortunately, isn’t a reason for the Fed not to do it. But then the May jobs reports came along and said that only 38,000 net new jobs were created last month. That was less than one-fourth of expectations! Yet, the bad news may have saved us. Hopefully, some folks inside the Fed are reconsidering their plans.
In this week’s CWS Market Review, I’ll explain what the market’s shakeout means for us. Every investor needs to understand that the stock market has shifted toward long-neglected economically cyclical stocks. Later on, I’ll highlight some good news from our Buy List. As expected, CR Bard raised its dividend for the 45th year in a row. There aren’t many stocks that can say that. CR Bard is now a 20% winner for us this year. Before we get to that, though, let’s take a closer look at the latest hijinks on a certain street in lower Manhattan.
The Big Chill Comes to Wall Street
The stock market has been unusually happy lately, despite many reasons to be fearful. On May 19, the S&P 500 closed at 2,040.04, which made the index just slightly red for the year. That must have been the signal the bulls had been waiting for, because the S&P 500 has gradually marched higher ever since.
On Wednesday, the S&P 500 closed at 2,119.12 for its highest close since last July. In fact, we’re inching ever closer to 2,130, which is the all-time closing high reached a little over one year ago. But don’t forget dividends! Looking at the S&P 500 Total Return Index, which includes dividends, we’re already at a new all-time high.
What’s interesting about this recent rally is how gradual it’s been. There really haven’t been major upsurges. In fact, the S&P 500 has gone a full nine weeks without a single day of losing more than 1%. That ain’t how this year started. Take a guess how many days had 1% drops during the first nine weeks of this year? I’ll give you a hint—the answer is 14.
It’s not just the subdued nature of the really; I’ve also been struck by its content. I touched on this subject last week, but it’s worth exploring in a little more detail. Since February, the stock market has been led by economically cyclical stocks. These are the types of businesses whose fortunes are closely tied to the economic cycle. Think construction, transportation, manufacturing, chemicals, etc. It’s been a long time since cyclical stocks were popular.
Investors need to understand that a cyclical stock isn’t in any fundamental sense better or worse than a defensive stock. To every thing, there is a season, and cyclical stocks tend to move in, well…cycles. Since February, the market has rewarded cyclicals.
Defensive sectors are areas like consumer staples and healthcare. When I say cyclical stock, I generally mean three sectors—energy, materials and industrials. The first two are largely impacted by commodity prices, and the rebound in oil has been quite remarkable. This week, oil broke $50 per share. Black gold has nearly doubled off its February low. I’m not optimistic on the long-term outlook for oil. (Don’t take my word for it: check out the dumpster fire that used to call itself OPEC.) But I wouldn’t be too confident to call for a top in oil.
Not surprisingly, energy stocks have been some of the top performers this year. ExxonMobil, for example, is up nearly 20% this year, while 3M, your classic industrial, is up nearly 15%. These stocks had been laggards for so long.
Our Buy List, as a whole, is slightly weighted against the cyclical sectors. That’s not a macro call on my part. It’s just how things worked out. It’s nearly impossible to be completely neutral in all sectors. Just about any portfolio is going to lean toward to some sectors, but our minor defensive bias is impacting our performance this year. The effect isn’t dramatic, but it’s clearly at work.
Before their sudden burst of popularity, the energy and materials sectors had been lagging the overall market for five years. In fact, that preceded the meltdown in commodity prices. It also could have reflected a growing realization that the current recovery is unusually subdued. Whatever the reason, these cycles constantly flow within the markets, and it’s important to understand why.
The popularity of cyclical stocks may also suggest that the economy is doing better than people realize. The latest forecast from the Atlanta Fed sees Q2 GDP coming in at 2.5%. We’ll get our first look at Q2 GDP in late July. In one more month, second-quarter earnings season starts, and we’ll get a look at how well Corporate America did during the spring. This very likely will break our six-quarter streak of falling operating earnings.
According to S&P, Wall Street expects the S&P 500 to report earnings of $28.43 (that’s the index-adjusted number). That would be an increase of 8.8% over last year’s Q2. However, the forecast for Q2 has been pared back by 8.3% since the start of the year. Analysts usually start out with high forecasts and then cut them as earnings day gets closer. It will be very nice to put this “earnings recession” behind us.
Now let’s circle back to the jobs report. On Friday, the Labor Department said that only 38,000 net new jobs were created last month. Wall Street had been expecting 162,000. This wasn’t just a miss—it was an historic facepalm! This was the worst jobs report in more than five years.
Going into the jobs report, the futures market put the odds of a June rate hike from the Fed at 30%. Now that’s down to 3.8%, which is probably 3.79999% too high. Still, the Fed is talking tough. It’s hard for me to see the need for a rate hike, since GDP growth is pretty sluggish, and there’s not much in the way of inflation.
After the jobs report came out, there was a pronounced shift within interest rate-sensitive stocks. Areas with high-dividend yields, like utilities, gapped up, while banks and other financials took a hit. Gold had one of its best days in weeks, and the U.S. dollar suffered its worst drop all year.
I’m still concerned about inflation, but so far, the evidence just isn’t there. If that changes, then I think the Fed would be justified in raising interest rates. But it wouldn’t take much from the Fed to flatten out the yield curves since long-term rates are so low. In fact, the bond market rallied and has continued to rally. The 10-year yield just closed at 1.68%, which is a four-month low, and it’s very close to being the lowest level in more than three years.
Meanwhile, Mario Draghi at the ECB has started buying corporate bonds. The European economy is still a mess, and the authorities there are pulling out all the stops. Bond yields in the Old World are falling to microscopic levels. In Germany, the 10-year yield is getting very close to 0%. Switzerland said it plans to issue a 13-year bond with a coupon of 0%. In the U.K., their 10-year bond fell below 1.25%, which is a record low. Now there are reports of foreign investors buying up U.S. junk debt. There’s simply no other place to go.
If you had decided to sit out stocks this year and plant your money in long-term Treasuries, you’d be enjoying a nice lead over the S&P 500. But going forward, I think the stock market is much safer. The S&P 500, as a whole, now yields about 50 basis points more than the 10-year Treasury. And don’t forget an important fact about fixed income: the income is fixed. That’s not the case with equities, which can raise their dividends. Speaking of which, let’s turn to this week’s news from CR Bard.
CR Bard Raises Its Dividend for the 45th Year in a Row
On Wednesday, CR Bard (BCR) announced that it’s raising its quarterly dividend from 24 to 26 cents per share. (In last week’s issue, I predicted 27 cents.) This is the 45th consecutive year in which Bard has raised its dividend. There are only a handful of publicly traded stocks that can boast track records like that.
The company said that the dividend is payable on July 29 to shareholders of record at the close of business on July 18. Bard only pays out a modest portion of its profits as dividends. For the average stock in the S&P 500, the average payout usually runs around 33%. For Bard, it’s less than 10%. Going by Thursday’s closing price, Bard now yields 0.31%. That’s puny, but Bard can easily afford to keep raising its dividend for many years to come.
The company also announced a new $500 million share-repurchase authorization. This is on top of the current program, which has $205 million left in it. Shares of BCR are up 20% for us this year. This week, I’m lifting my Buy Below on CR Bard to $231 per share.
Biogen Drops 12.8% after MS Study
One of my favorite biotech stocks, Biogen (BIIB), got dinged hard this week after the company said that Opicinumab, one of its experimental drugs related to multiple sclerosis, had performed poorly during mid-stage tests. There’s been a worry on Wall Street that Biogen has a thin pipeline, and this news didn’t help. The stock dropped 12.8% on Tuesday. This is especially unfortunate because the stock had been trending higher.
Opicinumab isn’t dead yet, but the drug needs more time for trials. Biogen wasn’t in any sense staking its future on Opicinumab, but it’s not a pleasant setback. If you recall, Biogen said it’s going to focus on its neurology business, and they plan to spin off their hemophilia drugs.
While this week’s news is unfortunate for Biogen, but they still have a lot going for them. Let’s remember that the last few earnings reports have easily beaten expectations. The lower share price also means the stock is going for less than 13 times next year’s earnings estimate. Plus, we have the possible spinoff coming later this year, or in early 2017. Don’t be scared out of Biogen. The company has a bright future.
That’s all for now. Next week is the big Fed meeting. The FOMC gets together on Tuesday and Wednesday. The policy statement will come out at 2 p.m. on Wednesday, which will be followed by a press conference from Fed Chairwoman Janet Yellen. The Fed members will also update their economic projections (the “blue dots”). I’m not expecting any change in rates, but market watchers will pore over every letter in the statement, looking for clues. Be sure to keep checking the blog for daily updates. I’ll have more market analysis for you in the next issue of CWS Market Review!
– Eddy
Named by CNN/Money as the best buy-and-hold blogger, Eddy Elfenbein is the editor of Crossing Wall Street. His free Buy List has beaten the S&P 500 eight times in the last nine years. This email was sent by Eddy Elfenbein through Crossing Wall Street.

June 9, 2016, 6:52 AM:
Briefly: In our opinion, speculative short positions are favored (with stop-loss at 2,140, and profit target at 2,000, S&P 500 index).
Our intraday outlook is bearish, and our short-term outlook is bearish. Our medium-term outlook remains bearish, as the S&P 500 index extends its lower highs, lower lows sequence:
Intraday outlook (next 24 hours): bearish
Short-term outlook (next 1-2 weeks): bearish
Medium-term outlook (next 1-3 months): bearish
Long-term outlook (next year): neutral
The main U.S. stock market indexes gained 0.2-0.4% on Wednesday, slightly extending their short-term uptrend, as investors’ sentiment remained bullish. The S&P 500 index continues to trade along the level of 2,100. The nearest important resistance level is at 2,110-2,120, marked by April’s local high. The next resistance level is at around 2,130, marked by last year’s all-time high of 2,134.72. On the other hand, support level is at 2,100, marked by previous level of resistance. The next important support level is at around 2,070-2,085. Last year’s highs along the level of 2,100 continue to act as medium-term resistance level. Will the market break above these medium-term highs and continue its seven-year long bull market?

Expectations before the opening of today’s trading session are negative, with index futures currently down 0.2-0.4%. The European stock market indexes have lost 0.9-1.3% so far. Investors will now wait for some economic data announcements: Initial Claims at 8:30 a.m., Wholesale Inventories number at 10:00 a.m. The S&P 500 futures contract trades within an intraday downtrend, as it retraces its yesterday’s move up. The nearest important level of resistance remains at around 2,115-2,120. On the other hand, support level is at 2,100-2,105, among others. There have been no confirmed negative signals so far. However, we can see some short-term overbought conditions:

The technology Nasdaq 100 futures contract follows a similar path, as it retraces its yesterday’s advance. The nearest important support level is at around 4,500, and resistance level remains at 4,530-4,550, marked by recent local highs. The market extends its short-term consolidation following May rally, as we can see on the 15-minute chart:

Concluding, the broad stock market slightly extended its short-term uptrend on Wednesday, as the S&P 500 index got closer to its last year’s all-time high of 2,134.72. There have been no confirmed negative signals so far. However, we can see technical overbought conditions that may lead to uptrend’s reversal or downward correction. Therefore, we continue to maintain our speculative short position (opened at 2,093.94 – last Wednesday’s opening price of the S&P 500 index). Stop-loss level is at 2,140 and potential profit target is at 2,000 (S&P 500 index). You can trade S&P 500 index using futures contracts (S&P 500 futures contract – SP, E-mini S&P 500 futures contract – ES) or an ETF like the SPDR S&P 500 ETF – SPY. It is always important to set some exit price level in case some events cause the price to move in the unlikely direction. Having safety measures in place helps limit potential losses while letting the gains grow.
Thank you.
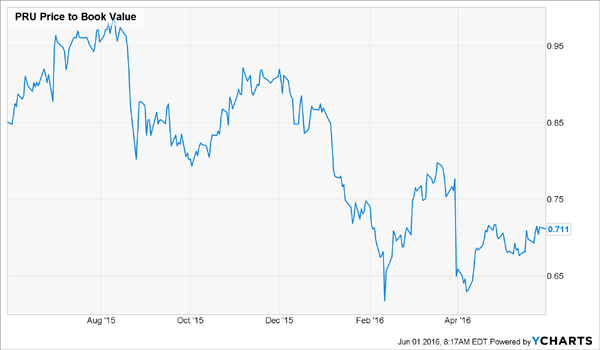
To say Prudential Financial (PRU) is cheap would be a huge understatement. The stock trades at just 71% of book value and 8.3-times forward earnings, ridiculously low levels for a company that generated $14.7 billion in free cash flow (FCF) in the last 12 months. That’s 42% of PRU’s $35-billion market cap!
…continue reading for 2 more Dividend payers HERE
also:
Negative Interest Rates Set to Propel the Dow Jones to the Stratosphere?
 While I am definitely bearish on long-term returns, from the elevated valuations levels that the U.S. stock and bond markets are starting from today, this does not preclude the markets from becoming more overvalued, before they ultimately succumb to the gravitational pull of valuation. This is a reversion-to-the-mean concept that I like to call “valuation gravity”… CLICK HERE for the complete article

As you know a picture is worth 1000 words so consider this short yet detailed post a juicy 2000+ word report on the current state of the stock market and economic cycle.
The charts below I think will help you see where the US stock market and economic cycles appear to be.
The first image shows two cycles, the blue one is the stock market cycle and which sectors typically outperform during specific times within the cycle. Here you will see that during the late stages of a bull market the safe haven plays become the preferred choice for investors – Energy and Precious Metals.
Typically, the stock market tops before the economic (business) cycle does. Why? Because investors can see sales starting to slow and that earnings will start to weaken and share prices will fall, so the market participants start selling shares before the masses see and hear about a weakening economy. The stock market usually moves 3-9 months before the economic cycle change I known by the masses.

Stock Market Topping According to Sector Analysis

Elliott Wave Count – My Educated Guess
Elliott wave theory is a tough strategy to follow. Meaning, if you gave the same chart to 5 different people you would likely have 3 or 5 very different wave counts.
Recently I have seen a flurry of EW charts on the SP500 wave count which I do not think are correct. When I do Elliott Wave counts I like to use more than just price. I look into things deeper and use the market internals, volume flows, and overall market sentiment during those times. They must all be screaming extreme FEAR in the market in order for me to count it as a wave low.
Fear is much easier to read and time than greed. So based on waves of fear and I can plot the rest of the waves. By doing this, I feel it gives a truer reading of significant highs and lows we should use in our analysis.
See my analysis below for a visual…

Stock Market & Economic Cycle Conclusion:
In short, the current market analysis, in my opinion, is still very bearish and this could actually be the ultimate last opportunity to get short the market near the highs before we dive into a full blown bear market in the next 3-5 months.
I will admit, the market is trying VERY hard to convince us it wants to go higher as it flirts with the recent highs for its second time in the past 8 months. I know it is doing its job because so many traders and investors are changing their tune from bearish to SUPER BULLISH.
I don’t see it that way JUST yet, but it could happen as the market can do and will do whatever it wants. But all my analysis (much more than what you see here) points to substantially lower prices over the next year.
Chris Vermulenoin – join him at www.TheGoldAndOilGuy.com

-
I know Mike is a very solid investor and respect his opinions very much. So if he says pay attention to this or that - I will.
~ Dale G.
-
I've started managing my own investments so view Michael's site as a one-stop shop from which to get information and perspectives.
~ Dave E.
-
Michael offers easy reading, honest, common sense information that anyone can use in a practical manner.
~ der_al.
-
A sane voice in a scrambled investment world.
~ Ed R.
Inside Edge Pro Contributors

Greg Weldon

Josef Schachter

Tyler Bollhorn

Ryan Irvine

Paul Beattie

Martin Straith

Patrick Ceresna

Mark Leibovit

James Thorne

Victor Adair