
Stocks & Equities

Ever since August 2014 the S&P 500 has been trading in a relatively tight range of roughly 18%. That’s one of only five times it has traded in a range of less than 20% over a period of 22 months. Looking at the chart, 2005 and 2006 were the last times to see a range this tight. Of course, that was nearing the end of that bull market, but the two times before were the mid-1990s and late 1984. Both of those occurrences were simply a break in multiyear bull markets.”
…read entire article with charts HERE
related: Negative Interest Rates Set to Propel the Dow Jones to the Stratosphere?

“Every man must patiently bide his time. He must wait — not in listless idleness but in constant, steady, cheerful endeavors, always willing and fulfilling and accomplishing his task, that when the occasion comes he may be equal to the occasion.” ~ Henry Wadsworth Longfellow
Central bankers wanted to put the fear of God into the masses and to a large degree they have succeeded in doing so; the masses are so afraid that they continue to hoard their money and refuse to put into the market, and that is why this Bull-Market is the most hated in history. Nine years and counting and you would think by now they would have surrendered these false beliefs as the Bears have been decapitated, and the naysayers are hiding in the woodwork. However, ignorance, like stupidity knows no limits and continues to trend upwards; if there were a way to invest in stupidity it would be an easy way to score a home run. The main driving force behind this market is hot money, and hot money will continue to drive this market higher and higher. Yes, it will end one day but by that time if you are a bear you would be bankrupt several times over or be ready to shoot yourself a dozen times for sitting on the sidelines. The Fed has ensured that hot money continues to flow into this market by keeping rates artificially low for an extended period. Their next move is to be to jump on the negative rate bandwagon; they will be forced to do so sooner or later. Resistance is futile in this instance. The Fed has once again changed its stance; last year it was somewhat hawkish, but this year Fed head Yellen had turned dovish.
Central bankers knew that people would save more and more out of fear initially due to economic uncertainty even though rates were and still are low. They know that many will continue to remain wary when negative rates hit the US and even when banks start charging them a fee to hold onto their money. People are saving more and more because they don’t know what the future holds. Experts will state that central bankers miscalculated, but the truth is that they did not miscalculate, they were planning for this. Eventually, when the pain becomes too intense, the masses will realize that they have no option but to speculate and suddenly they will all act in unison. They will jump out of the box and start to look desperately for investments that offer better rates of return; there is no better casino in town than the stock market. It offers the allure of infinite wealth but rarely delivers such gains to the masses. The idea here is to back the crowd into a corner like you would a rat in a small cage, finally, when it has nowhere to turn, it will lash out and strike, realizing that its life is at stake. Whether it wins or not is irrelevant, the objective was to goad it into lashing out like a tiger. If the central bankers are successful, they will have created one of the biggest stimulus programs in history, and the masses will be the ones funding it.
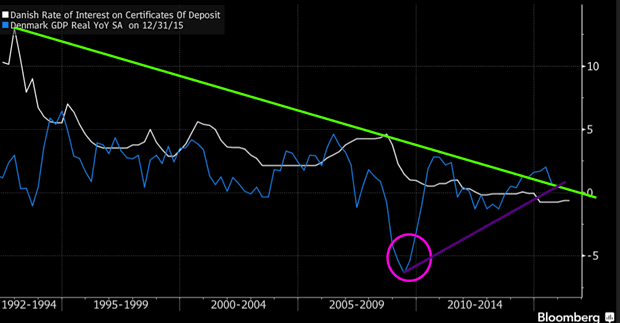
Denmark’s GDP started to rise as indicated in the above chart after rates turned negative, and that is and was the whole purpose of the program. Note that shortly after the crisis of 2008-2009; rates were pushed lower faster than at any period before in the last 20 years; the lower they dropped, the higher the GDP; in fact, one can conclude that it’s in an uptrend.
Yes, we are aware that this recovery is fake and illusory; hot money supports the whole economy, but this is taking place on a worldwide basis, and it’s not going to stop. Some countries have just embraced it while others are on their way to embracing it; this is a race to the bottom, and it won’t stop or end until everyone is on board. In Denmark, they have been embracing negative rates for over four years while in the U.S the Fed is preparing the masses for a day when negative rates will become reality. We suspect that the America will embrace negative rates for a much longer period.
“Negative rates are counter-productive,” said Kasper Ullegaard, head of fixed-income overseeing more than $15 billion at Sampension in Copenhagen. The policy “makes people save more to protect future purchasing power and even opt for less risky assets because there’s so little transparency on future returns and risks.”
Yes, they are counterproductive over the long run, but in the short to medium time frames, they can produce a helluva of bang and that’s the main objective of the big players. They will cash out well before the next financial crisis hits.
“I’m very concerned about what these low, negative rates mean,” Stendevad said. “I’m concerned about what they mean for asset pricing. Clearly, they are driving asset prices. That’s the intention, but it’s always a cause for concern when asset pricing is driven more by central bank policy than cash flow generation.”
Clearly they are and will continue to do so; the idea is to create the mother or grandfather of all bubbles. When the masses decide to speculate there will be so much money flowing into the markets that all assets including Gold will fly; some will soar to the moon, some to the sun and some possibly to the next galaxy.
We have continuously stated that this Bull Market is destined to run a lot higher than most envision and will only end when the masses join the party. We have pounded this theme repeatedly over the past few years and much to the dismay of the naysayers the markets have soared in the stated direction. The following extract was sent out to our paying subscribers:
And as expected the bull continued to trend higher. In fact, the SPX put in a new six months high and is dangerously close to testing its old highs; so what do the naysayers have to say now; nada. But, don’t you worry, they will start yelling again in the near future, stating that all hell is ready to break loose, the moment the markets start to correct. ~ Market Update April 19, 2016
The markets have continued to trend higher since the last update, and overall we expected this as the trend is still up and none of our sentiment indicators had moved to the extreme zones.
Battle Plan
Fundamentals clearly are not supportive of this market; if relied fundamentals one would be shorting this market a long time ago and by now you would either be bankrupt or on your way to the loony bin. Hot money drives this market, and the situation will turn explosive when the Fed embraces negative rates. The Fed has no option but to embrace negative rates; we are in the midst of a massive currency war, and the only option left on the table is to “devalue or die”.
The plan, therefore, is simple; every strong pullback has to be viewed as buying opportunity. This bull market will only end when the masses join the party, and they are a long way from embracing one of the most hated bull markets in history.
“The paranoiac is the exact image of the ruler. The only difference is their position in the world. One might even think the paranoiac the more impressive of the two because he is sufficient unto himself and cannot be shaken by failure.” ~ Elias Canetti

“It seems wise to consider the possibility of a substantial S&P 500 Index drop in coming months”
There are patterns in markets. Yes, the Fed and High Frequency Traders influence markets, but we can learn from past patterns in the S&P 500 Index.
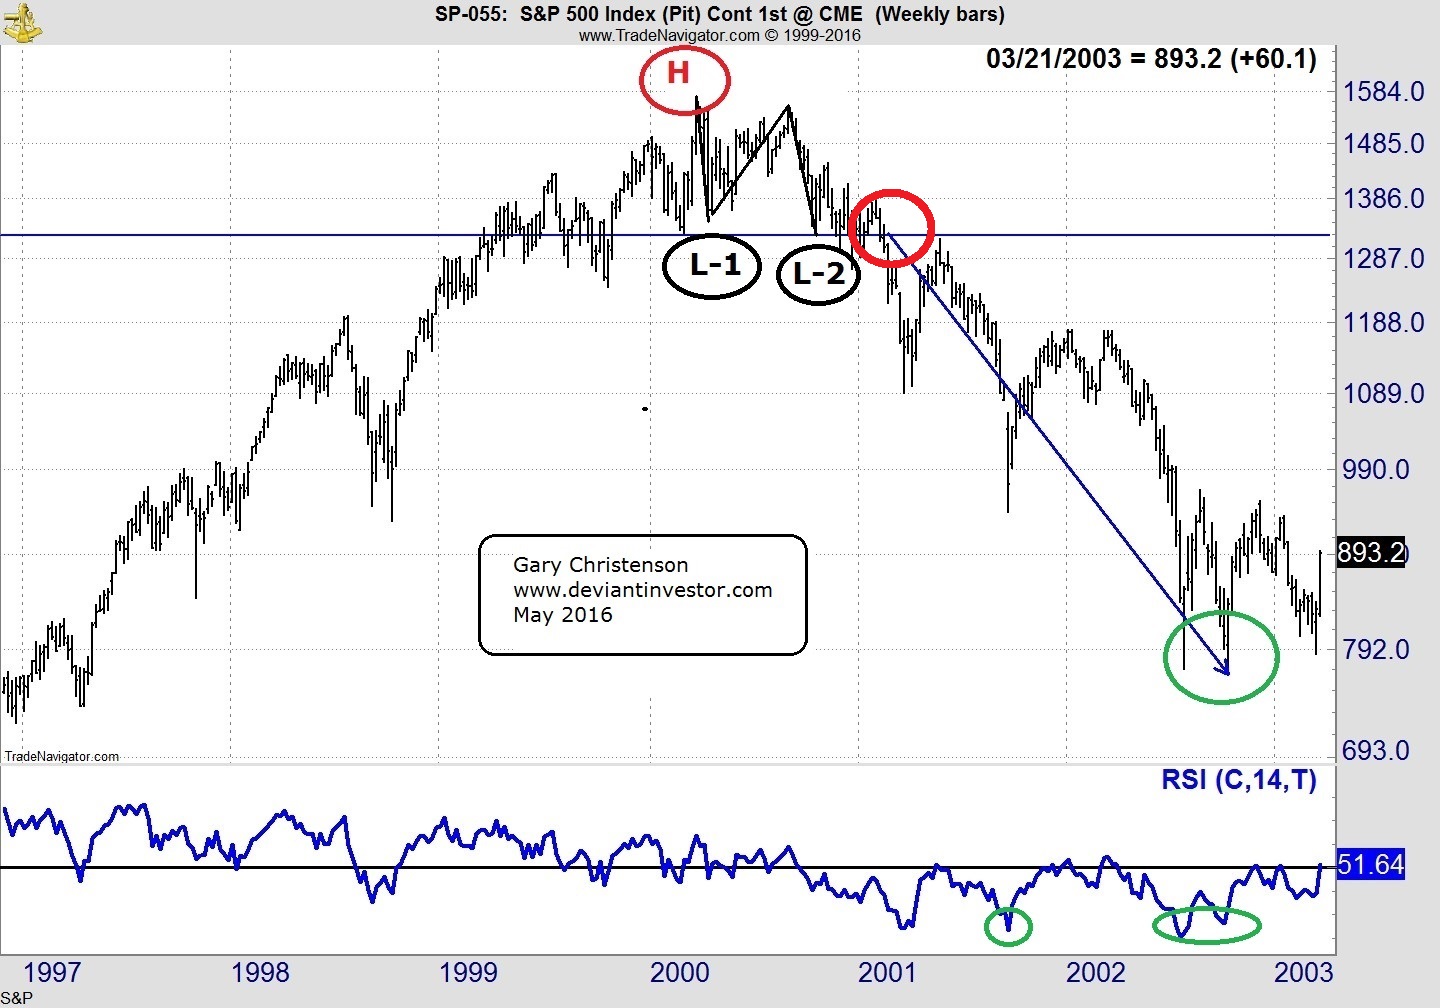
Using weekly data, the S&P made a high in March 2000, fell to an initial low in April, rose, and fell to a second low in October 2000. It rallied and fell below the second low in February 2001 – never to look back. From high to final low took 931 calendar days and price fell about 51%.
Examine the following chart and note the H, L-1, L-2 and a final low.
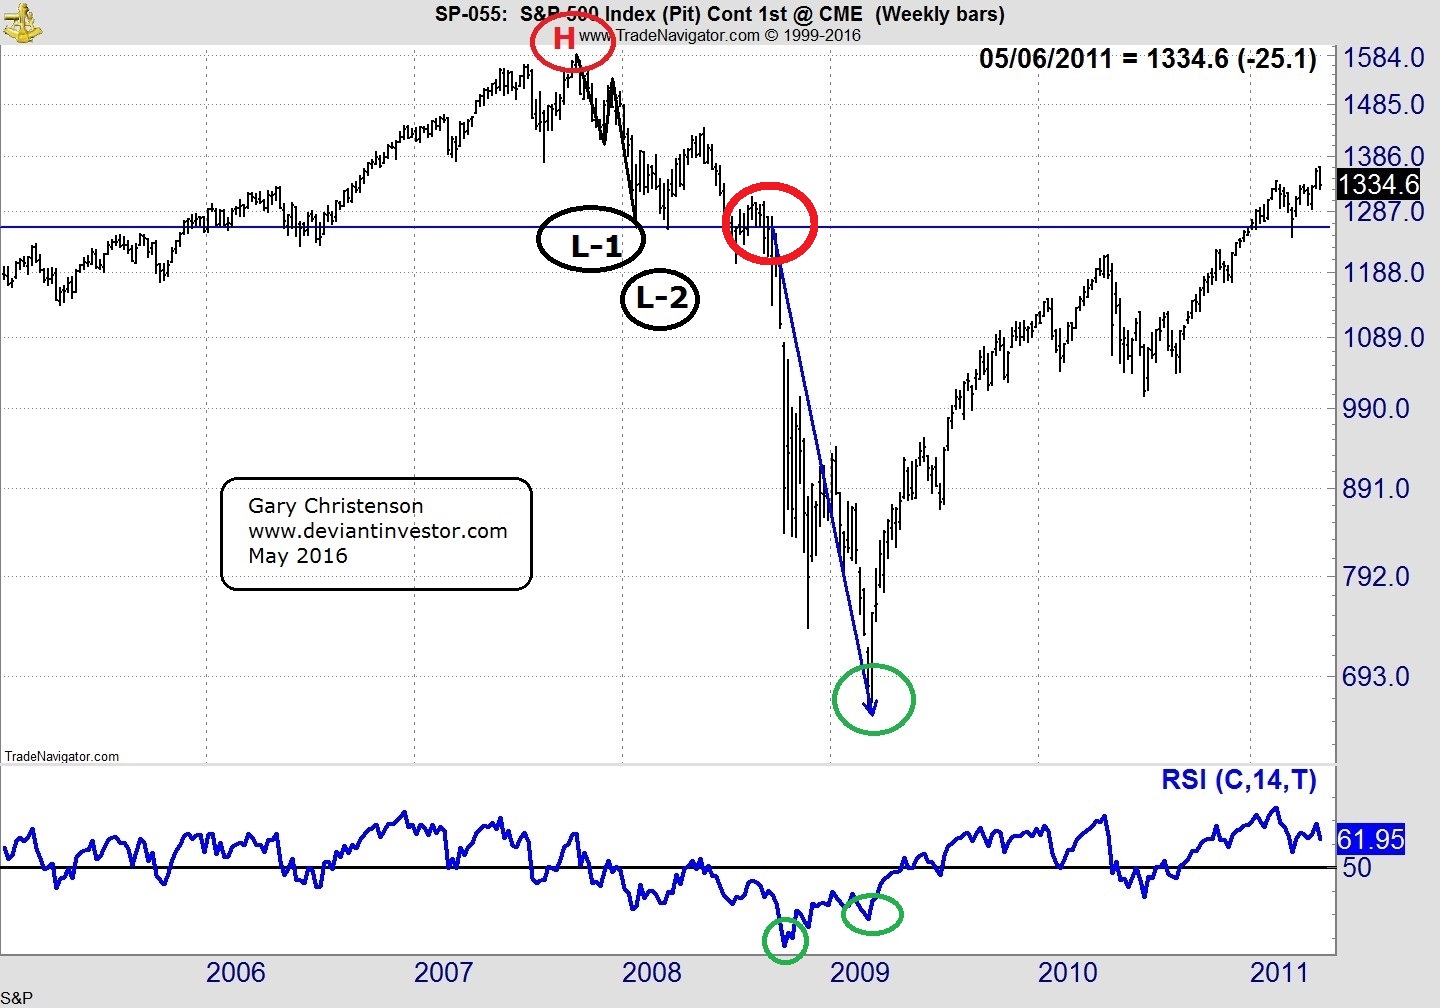
A similar pattern is visible after the 2007 top. Using weekly data, the S&P made a high in October 2007, fell to an initial low in November, rose, and fell to a second low in January 2008. It rallied and fell steeply below the second low in September 2008 – never to look back. From high to final low took 511 calendar days and price fell about 58%.
Examine the chart for the 2015 version of the S&P high to low progression.
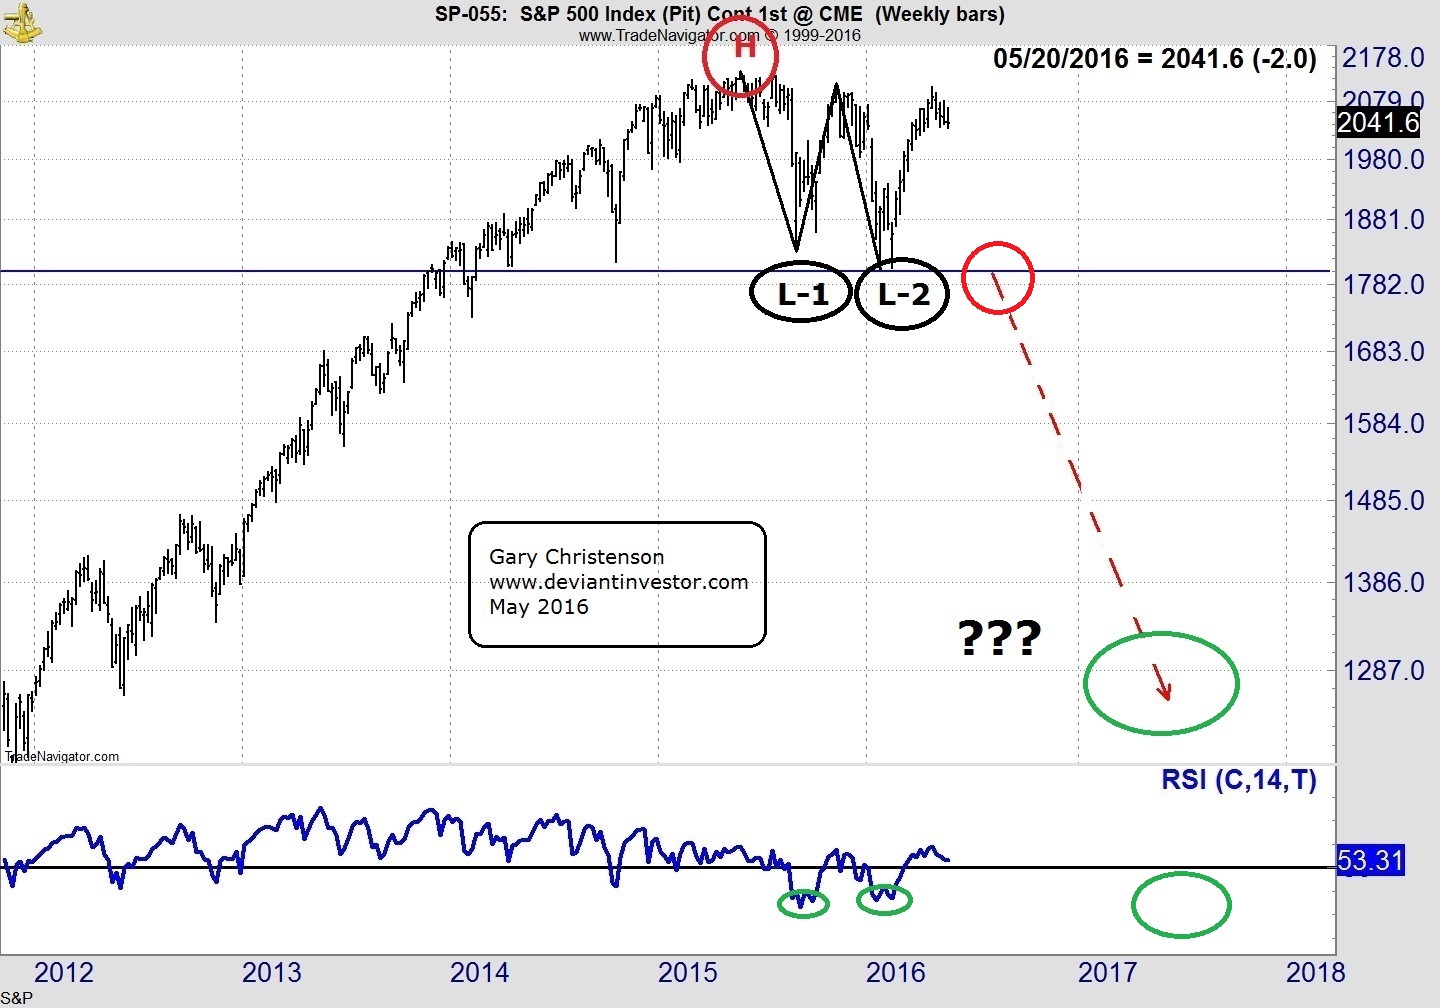
A high is clearly visible, along with a first low and a second low. The S&P has not yet fallen below L-2 at about 1804, but when it does, look out below. Of course this time could be different, our central banks might “save” the S&P, market corrections might have been banished into the dustbin of history, the incredibly excessive global debt may not matter, and the Easter Bunny might be real, but none of those seem like good bets.
SPECULATION based on the last two cycles: These are not predictions – just possibilities based on history. As I said, this time might be different, the incredibly high S&P might be levitated until past the election so that a “status quo” friendly candidate can be elected President in November 2016, and the Easter Bunny …
Time from high to low in the 2000 cycle was 931 days – about 2.5 years. The 2007 cycle was deeper and quicker – 511 days or about 1.4 years. Assume the range for the 2015 cycle is longer than the last cycle, since it appears to have an extended and rounded top – so guess that high to low takes about 2 – 2.5 years – which suggests a low about 2017Q2 – 2017Q4.
Prices from high to low in the 2000 cycle declined 51%. The 2007 decline was slightly larger at 58%. Assume a 50 – 60% decline in this cycle. That puts the S&P in the vicinity of 850 to 1050. Of course this time might be different…
IN ADDITION:
Using the Relative Strength Index as shown at the bottom of the charts, we can see that the 2000 cycle bottomed with RSI readings (scale 0 – 100) in the 20s on the weekly charts and about 27 on the monthly chart.
Those RSI readings were as low as 16.45 weekly in October 2008, and 18.1 on the monthly in March 2009.
Those RSI readings in the 2015 cycle have only dropped to the 30s on the weekly and to about 49 on the monthly. Either this time is very different, or the RSI reading must drop far lower to indicate a lasting bottom. Expect to see monthly RSI readings around 20 in 2017 – 2018 at a much lower low in the S&P 500 Index.
Of course this time might be different, but it seems wise to consider the possibility of a substantial S&P 500 Index drop in coming months. Today – May 20 – is the one year anniversary of the S&P 500 market top last year.
Gary Christenson
The Deviant Investor
related – Martin Armstrong has a unique view: The Dow & The Confusion
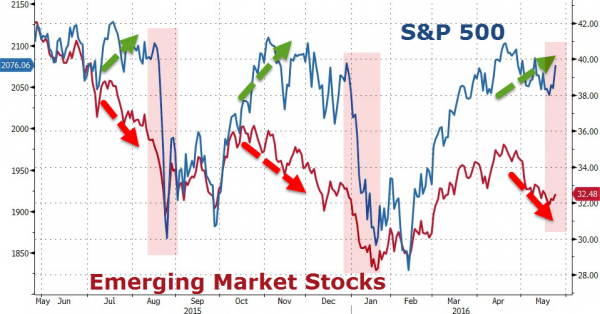 “we are seeing the same decoupling between US and EM stocks that that turned out a leading indicator for the decline in US risk assets in August last year and again in December/January this year…“
related by Martin Armstrong: The Dow & Confusion
“There is ABSOLUTELY NO INDICATION yet that we are in a bearish trend poised to break last year’s low in the Dow. Another retest of support – YES.” – Martin Armstrong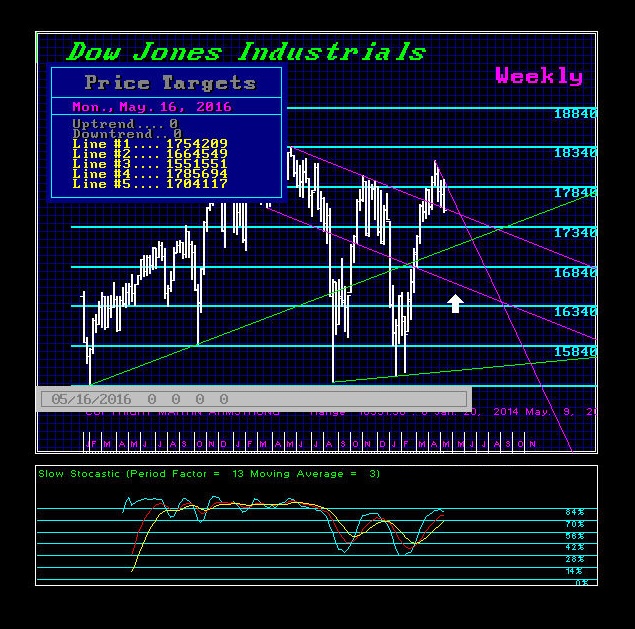
The Dow does not need to break last year’s low, as that was accomplished in the NASDAQ and S&P 500. Nothing has changed there. The entire interest rate issue has far too many people brainwashed. No doubt, they would initially sell. However, the market will rise with higher interest rates as it has always done. Therefore, as shorts build, we can easily create a bear trap and that will be the fuel to rally again. This is the churning we are in until it appears at least after September.
This time, we have a far more serious problem with where to put money – big money. Stocks are the modern-day version of what gold used to be decades ago when you could jump on a plane with a suitcase full of gold and sell it wherever you landed. Today, metal detectors prevent that from taking place. Stocks are being used to move money, but they must be the high-end shares that are traded globally (see article posted on Egypt).
There is ABSOLUTELY NO INDICATION yet that we are in a bearish trend poised to break last year’s low in the Dow. Another retest of support – YES. This is the churning pattern. Breaking last year’s low would ONLY be indicated with a monthly closing beneath 16000 prior to August. Then we are merely extending this entire mess and not altering the long-term outcome.
That said, we have a more important number for month-end at 17579 followed by 17210. A May closing below 17210 would signal a possible test of the 16000 level in the months ahead.
Nevertheless, the first Minor Weekly Bearish Reversal in the Dow lies at 17434, which we flirted with on Thursday. We need a closing below this today to suggest a correction is unfolding. However, make no mistake about it, the next critical area is 17120, which happens to be a Daily and Weekly Bearish Reversal. That is the level to watch for a serious short-term break.
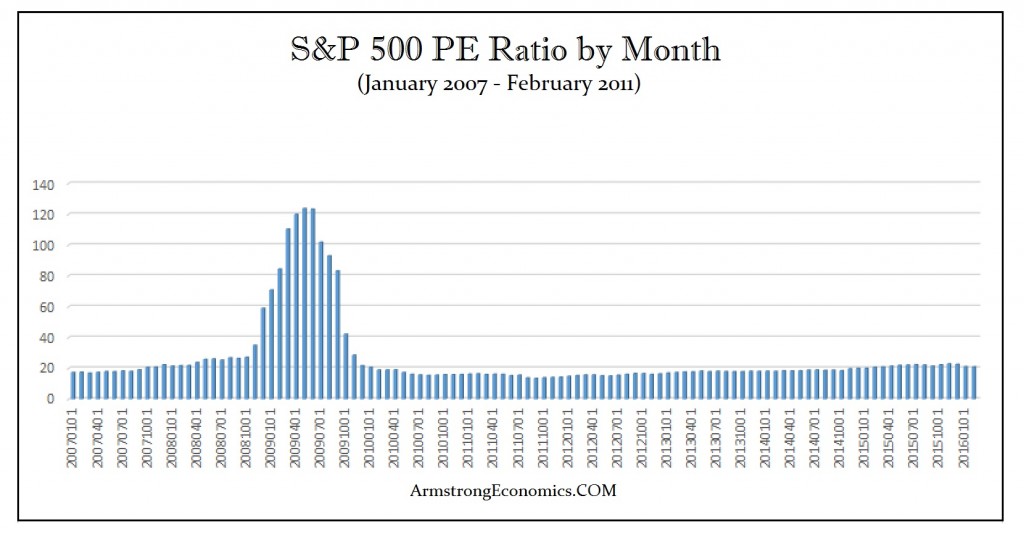
Keep in mind that people continue to think this market is “rich” in price and they are concerned about earnings. Those ideas are so out of touch with reality. The PE Ratioreached 50:1 in 2000 during the DOT.COM bubble, but it exceeded 120:1 during the 2007-2009 meltdown because blue chips are the place to secure money. The market is by no means “rich” from a historical perspective. We are not in some standard investment scenario. A 3% dividend is huge with negative interest rates in cash. Bonds are a disaster and have nowhere to go but down. So how is the market “rich” when there is no other alternative? This is why money has flowed into real estates, ancient coins, metals, and equities. We must look at the alternatives here and the idea of selling stocks must be followed with deciding where to put your cash. Banks or government bonds? Come on. Where’s the rational thinking here?
…more from Martin: Trading Volumes Decline as Hoarding Rises Due to Uncertainty

-
I know Mike is a very solid investor and respect his opinions very much. So if he says pay attention to this or that - I will.
~ Dale G.
-
I've started managing my own investments so view Michael's site as a one-stop shop from which to get information and perspectives.
~ Dave E.
-
Michael offers easy reading, honest, common sense information that anyone can use in a practical manner.
~ der_al.
-
A sane voice in a scrambled investment world.
~ Ed R.
Inside Edge Pro Contributors

Greg Weldon

Josef Schachter

Tyler Bollhorn

Ryan Irvine

Paul Beattie

Martin Straith

Patrick Ceresna

Mark Leibovit

James Thorne

Victor Adair