
Stocks & Equities
Stock Trading Alert originally sent to subscribers on April 18, 2016, 6:50 AM.
Briefly: In our opinion, speculative short positions are favored (with stop-loss at 2,100, and profit target at 1,950, S&P 500 index).
Our intraday outlook is bearish, and our short-term outlook is bearish. Our medium-term outlook remains bearish, as the S&P 500 index extends its lower highs, lower lows sequence:
Intraday outlook (next 24 hours): bearish
Short-term outlook (next 1-2 weeks): bearish
Medium-term outlook (next 1-3 months): bearish
Long-term outlook (next year): neutral
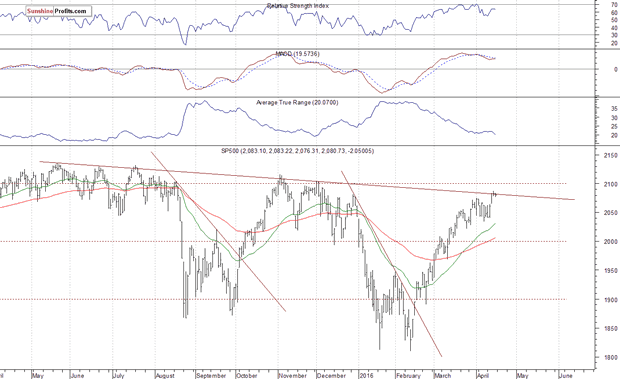
The U.S. stock market indexes lost 0.1-0.3% on Friday, extending their short-term uncertainty as investors awaited quarterly corporate earnings, economic data releases. The S&P 500 index continues to trade close to its last year’s local highs. The nearest important level of resistance is at around 2,100-2,120. On the other hand, support level is at 2,030-2,040, marked by recent consolidation, and the next level of support is at 2,000-2,020, marked by previous level of resistance. The index continues to trade within a descending medium-term trading channel. There have been no confirmed short-term negative signals so far. However, we still can see overbought conditions:
….read more with much larger charts HERE


Stock Markets
The late Richard Russell used to observe, “Stocks are going to great valuations.”
Have always enjoyed the line, especially when nicely timed. The Transports had been declining in the first part of 2015 when we used the old Dow Theory for the first time. The non-confirming signal occurred in May and we concluded that the bull market was ending. Our research on the curve and spreads indicated trouble after July. In July we concluded that the bear market had begun.
The hit into January accomplished all of the right technical readings and we thought the rebound could run to around March. That the likely leaders would be base metal miners helped with the March seasonality. And the materials sector became very overbought. We have been taking money off the hot tables.
As we have been noting, the NYA set the big Rounded Top last year. This year’s rebound has been looking somewhat like the second rebound in the 2008 bear market. Our March 17th Pivot concluded that the rally had a couple of weeks to go.
The NYA reached the 200-Day ma at 10281 on March 30. This has been the high for the move and the broad index has been following the moving average down.
Adding to the measures of exuberance, the NYA has registered a Weekly Inverse Springboard – similar to that on the big rebound into May 2008. The Inverse Springboard is a sell in a generally declining market. The Springboard is a buy on a dip in a rising market. The last one on the bull market registered in October 2014.
We like the symmetry and yesterday’s ChartWorks noted the Inverse Springboard Sell in a number of important indexes.
Of considerable importance, this rally has been similar to the key rebounds that failed and formally confirmed a bear market. Outstanding examples completed in October 1973, August 1937 and April 1929.
As the ChartWorks noted, the first week with a lower low marks the completion of this rally.
This week, the Sensational Season is shining upon the Biotechs as the IBB jumped out of the dull trading range. Yesterday’s 6 percent pop has moved the Daily RSI up 9 points to 67, which is accomplishing an outstanding swing in momentum. The limit could be found at the 70 level.
Credit spreads have resumed widening, which could curb further advances in the banks and financials.
Used Car Prices

Source: Zero Hedge
- The price index did not make new highs on the rally to December 2007.
- And then took out the previous low.
- The latest rally barely made a new high for the move.
- It has taken out the recent low.
- Quite likely, the index does not include Ferraris.
Auto Inventories

- Car dealers seem unusually optimistic.
- For how long?
related: Larry Edelson on How Markets Outwit You
Link to April 8, 2016 Bob Hoye interview on TalkDigitalNetwork.com:http://talkdigitalnetwork.com/2016/04/us-fed-heads-still-think-theyre-great/
Listen to the Bob Hoye Podcast every Friday afternoon at TalkDigitalNetwork.com

APRIL 14, 2016, 6:35 AM
Briefly: In our opinion, speculative short positions are favored (with stop-loss at 2,100, and profit target at 1,950, S&P 500 index).
Our intraday outlook is bearish, and our short-term outlook is bearish. Our medium-term outlook remains bearish, as the S&P 500 index extends its lower highs, lower lows sequence:
Intraday outlook (next 24 hours): bearish
Short-term outlook (next 1-2 weeks): bearish
Medium-term outlook (next 1-3 months): bearish
Long-term outlook (next year): neutral
The U.S. stock market indexes gained between 1.1% and 1.3% on Wednesday, extending their short-term uptrend, as investors’ sentiment improved ahead of quarterly corporate earnings releases, among others. The S&P 500 index broke above its recent consolidation along the level of 2,050. The nearest important level of resistance is at around 2,080, marked by the late December high. The next resistance level is at 2,100-2,120. On the other hand, support level is at 2,030-2,040, marked by recent consolidation, and the next level of support is at 2,000-2,020, marked by previous level of resistance. The index continues to trade within a descending medium-term trading channel, as the daily chart shows:

…..read more analysis and get bigger charts HERE
also:
Jim Rogers on Currencies, Agriculture and Government Incentives

In This Week’s Issue:
– Stockscores’ Market Minutes Video – When to Avoid Buying Strength
– Stockscores Trader Training – The Danger of Using Information When Trading
– Stock Features of the Week – Penny Stock Revival
Stockscores Market Minutes Video – When to Avoid Buying Strength
It is best to buy stocks when they are going up for price appreciation is the important sign of optimism that traders need. However, there are times when you should not chase after strength, that answer plus my regular weekly market analysis.Click Here to Watch To get instant updates when I upload a new video, subscribe to the Stockscores YouTube Channel.
Trader Training – The Danger of Using Information When Trading
In theory, information should make the stock market’s world go round. Information about companies and their ability to make money in the future is what should determine share price. As the market learns of new information, price is adjusted up and down to reflect the value of that information.
This implies that investors should focus their analysis on information so they can predict where share prices should go in the future.
While this makes good sense, I have found it to be extremely rare that investors who use information are able to consistently beat the stock market. With smaller retail investors (you and I) in particular, the use of information for making investing decisions is more destructive than it is beneficial. Here are ten reasons why:
1. Information is Usually Already Priced In – most investors use publicly available information. That means it is widely known and available to anyone considering the stock. If information is available to a large number of investors then we should expect that the market will have priced that information in to the stock. Therefore, the information has not value to us.
2. Information Usually Comes with a Bias – as a general rule, people do what they are financially motivated to do. If someone is encouraging you to purchase a stock, there is a good chance that they have some financial motivation to do so. Before you trust the information you receive, understand the financial motivation. If you find the reason, you will often usually find that there is a strong bias in the information being provided to you.
3. Trading on Truly Insider Information is Illegal – there are few risk free trades in the stock market, but trading on significant, inside information is one. You stand to make a lot of money buying stock in a company that will be acquired by another at a premium tomorrow. If you have that information and act on it, you are trading on inside information and that can land you in jail.
4. Gathering Good Private Information is Expensive and Time Consuming – there are investors who are able to uncover information that is not priced in to a stock but is not considered inside information. This private information is valuable because it can lead to market beating returns. However, gathering private information typically requires significant resources, knowledge and time. For small investors, it is not feasible to do this kind of work across a broad range of stocks.
5. Information Causes You to Ignore the Market’s Message – when you have an understanding of a company’s story, there is a tendency to fall in love with that story and ignore new information that goes against your outlook for the stock. This leads the committed shareholder to hang on to a losing position, allowing the loser to bog down the performance of the overall portfolio.
6. You May Not Have All of the Information You Need – the market tends to focus on two or three key information points that affect the price investors are willing to pay for it. An investor who does a thorough fundamental analysis of the stock may still have an incomplete understanding of the company’s business. If missing one of the key points, this investor can make a gross error in valuing the stock.
7. The Market May Not Be Trading On Fundamentals – in theory, stock price is based on the present value of future earnings expectations. In practice, there are often very non fundamental influences on share price. A large investor that has a liquidity crisis may be forced to unload a large position with little regard for price. Often, the laws of supply and demand affect share price even though theory tells us that they should not have an influence.
8. Your Interpretation May Not Be the Same as The Market’s – Our mood affects how we judge information and the same can be said for the market in general. Your fundamental analysis may be correct in an optimistic environment, but if the market is in a pessimistic mood, the investment can lead to losses. Even the market is wrong, it is right.
9. There Is No Standard for What Information is Worth – There are many formulas for determining what a company’s share price should. Many fundamental analysts look for stocks to trade at a certain multiple of their earnings with that multiple to be based on growth. However, there are great variations in accounting methods that can have a profound effect on how earnings are reported. More importantly, there is no rule that a company should trade at a certain multiple of earnings, that target multiple is just an opinion.
10. We Tend to Focus On Information That is Easy to Get – we often look for the easiest way to achieve a goal. With information, there is a tendency to focus on the information that is front of us. Rather than work to find something to disprove our thesis on a stock, we instead look for information to strengthen our thesis. In doing so, we present our own biased outlook for our investment decisions that can often be very incomplete and wrong.
Ultimately, I look at the market’s interpretation of all available information when I look at a chart of price and volume. It shows not only every bit of information detail but also what the market thinks of it.

The TSX Venture market has a heavy concentration of speculative stocks from the commodity sectors, most notably mining and energy. In 2007, the TSX Venture index was over $3300, today it is at $616. That drop shows how tough it has been to be a Canadian penny stock trader but there does appear to be light at the end of the tunnel. The January low point for the index was just under $470 so the gains over the past few months have been considerable. There is a revival underway for Canadian penny stocks.
I have seen many good looking charts in the Gold and Silver mining areas, last week was a big week for many of them. We have early signs for a speculative stock revival in Canada.
With that in mind, I set out to find some charts of stocks listed on the Canadian market that were trading under $1. I used the Stockscores Market Scan tool to look for strong weekly charts using the Stockscores Simple Weekly scan but with a price limit of $1. Here are a few names I found to have decent looking charts:
1. T.AVL
T.AVL has broken its long term downward trend line with strong volume last week and has seen its Sentiment Stockscore move above the critical 60 line. Support at $0.13.

2. V.SCZ
V.SCZ broke up from a rising bottom last week and has abnormal price and volume activity building over the past few days. Support at $0.20.

Also check out Michael Campbell’s When All Else Fails Listen to Dilbert
References
- Get the Stockscore on any of over 20,000 North American stocks.
- Background on the theories used by Stockscores.
- Strategies that can help you find new opportunities.
- Scan the market using extensive filter criteria.
- Build a portfolio of stocks and view a slide show of their charts.
- See which sectors are leading the market, and their components.
Disclaimer
This is not an investment advisory, and should not be used to make investment decisions. Information in Stockscores Perspectives is often opinionated and should be considered for information purposes only. No stock exchange anywhere has approved or disapproved of the information contained herein. There is no express or implied solicitation to buy or sell securities. The writers and editors of Perspectives may have positions in the stocks discussed above and may trade in the stocks mentioned. Don’t consider buying or selling any stock without conducting your own due diligenc
If you like volatility, you had to love this past week. After sliding 22 points on Tuesday, the market rebounded sharply on Wednesday, gave up those plus more on Thursday, and as of Friday is struggling to stay positive.

The spike on Wednesday followed the release of the FOMC minutes which confirmed “bad news is still good news” for the markets as global weakness is keeping the Fed from hiking rates. The surge out of the gate on Friday was again “Fed Speak” as Fed President William Dudley continued “dovish” comments suggesting no rush to hiking rates anytime soon. To wit:
“Caution is needed because of our limited ability to reduce the policy rate to respond to adverse developments, recognizing that we could also use forward guidance and balance sheet policies to provide additional accommodation if that proved warranted.
Although the downside risks have diminished since earlier in the year, I still judge the balance of risks to my inflation and growth outlooks to be tilted slightly to the downside.”
And with those “silky smooth” words, traders rushed to buy stocks as the risk of tighter monetary policy continues to pushed further out into the future. Like the cartoon shows, courtesy of Hedgeye, the only thing that matters to the markets right now is the Fed.

-
I know Mike is a very solid investor and respect his opinions very much. So if he says pay attention to this or that - I will.
~ Dale G.
-
I've started managing my own investments so view Michael's site as a one-stop shop from which to get information and perspectives.
~ Dave E.
-
Michael offers easy reading, honest, common sense information that anyone can use in a practical manner.
~ der_al.
-
A sane voice in a scrambled investment world.
~ Ed R.
Inside Edge Pro Contributors

Greg Weldon

Josef Schachter

Tyler Bollhorn

Ryan Irvine

Paul Beattie

Martin Straith

Patrick Ceresna

Mark Leibovit

James Thorne

Victor Adair