
Stocks & Equities

Traders looking to survive the deadly tedium of this market ought not begin or end their day with a strong opinion. Although bears who smell a nasty top have ample reason to bet the ‘don’t pass’ line whenever the moment feels right, they should hold no illusions that a bull market now in its eighth year is going to roll over and die simply because some formerly reliable technical indicators say it’s time. Nor with a world endlessly awash in funny money can we count on lousy earnings to deliver the coup de grace.
It should be clear to everyone by now that the hacks, scoundrels, cheats and mountebanks who are paid princely sums to throw Other People’s Money at stocks are not swayed by the ominous, downward drift of corporate earnings. Yes, it is outrageous that despite this the broad averages sit within a three-day rally of all-time highs. We disregard this development at our peril, but that doesn’t mean Mr. Market cannot continue to thumb his nose at reality for as long as it suits his cruel designs.
Another reason to be cautious by Martin Armstrong: ECB Losing Control
Visit our 24/7 chat room and share trading ideas and real-time results by taking a free trial subscription.

Currently, we are experiencing the SPX topping formation. Again, it is dangerously overextended. The SPX staged a strong rally due to the repeated actions of Central Bankers, during the month of February 2016.
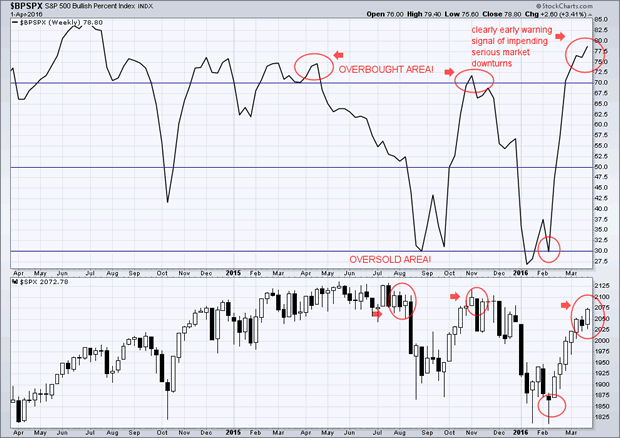
Presently. we are truly living, investing and trading in ‘unprecedented’ times. Another push higher is not out of the question, at this time, into ‘nominal’ new highs as we experienced this past Friday, April 1st, 2016 and then within a week or two it should start cycling back down.
There are strong ‘headwinds’ straight ahead for any attempted rallies that may take place. There is ‘bearish’ divergence within several momentum oscillators. This is signaling major warning signs! There are no bullish or favorable long set ups in the market place environment. I would look towards ‘unexpected’ choppy price movements across the board.

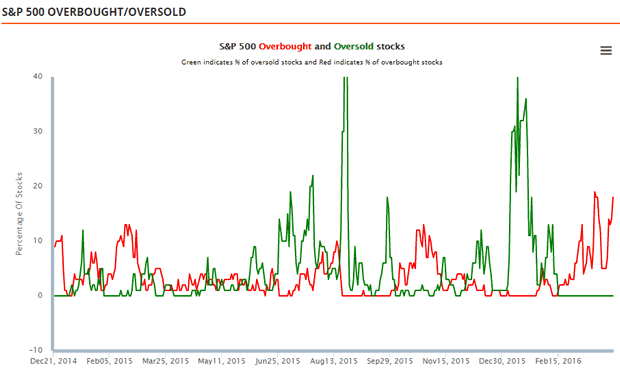
Investor sentiment has reading levels associated with ‘peaks’ in the equity market advances. Courtesy of ivewmakets.com
It is dangerous when the markets have nothing of substance sustaining them, other than their dependence on the FED’s announcements regarding its’ monetary support. It is extremely dangerous when the FED tailors its’ remarks so as to support financial asset levels. This is not the mandate of the FED, however, we are all waiting with anticipation, to hear their future announcement!
When Dr. Janet Yellen can make a couple of phone calls and implement an equities rally into new highs in 2016, of the equity markets, as of last Friday, April 1st, 2016, then we become the ‘fools’ who believe and buy into it!
Interventions by Central Banks, cannot change the long term trend from ‘bearish’ to ‘bullish’ I don’t think anymore. They are merely delaying the inevitable and just creating a ‘slow roasting bear market’ (as I have previously mentioned for several months is starting to unfold in the US large cap stocks). While these actions of the Central Bankers are now behind us, we are currently entering the earning season, which is most likely to disappoint Wall Street analysts.
The U.S. is currently experiencing the worst financial and economic recovery during the history of the countries’ worst financial crisis’ and ‘recession’, since the Great Depression. Most people don’t realize what is happening and thus don’t see or feel much of this recession, but it’s there building momentum in the background and it will be a rude awakening for most once the breaking point is reached.
Concluding Thoughts:
In short, the US stock market is at the topping point. Odd favor a major market downturn that will last before the next bounce, and then continue yet again even lower.
This will be a big surprise to most but my followers and I have been watching this unfold for months and are stocking the market to time the next BIG SHORT to make our killing.

 “Everything suggests to me that the world is, in fact, in a bear market and that what we’re having is the end of the first bear market rally…
According to my work, the final low of the bear market is not now–it’s not even this year. It’s next year and it will be quite a bit lower than we are now in virtually all markets…
The economies are cooling down, some more than others, and Janet Yellen doesn’t want to crash things”.
Thoughts are from our recent conversation with Robin Griffiths, Chief Technical Strategist at The ECU Group, which can be listened to on the Newshour podcast page here or on iTunes here.
Published on April 4, 2016, 6:39 AM:
Our intraday outlook is neutral, and our short-term outlook is neutral. Our medium-term outlook remains bearish, as the S&P 500 index extends its lower highs, lower lows sequence:
Briefly: In our opinion, no speculative positions are justified.
Intraday outlook (next 24 hours): neutral
Short-term outlook (next 1-2 weeks): neutral
Medium-term outlook (next 1-3 months): bearish
Long-term outlook (next year): neutral
The main U.S. stock market indexes gained 0.6-1.1% on Friday, extending their short-term uptrend, as investors reacted to monthly jobs report release. The S&P 500 index got close to its late December high of 2,081.56. The nearest important level of resistance is at around 2,080. The next resistance level is at 2,100-2,120, marked by previous medium-term highs. On the other hand, support level remains at 2,055-2,060, marked by last week’s Wednesday’s daily gap up of 2,055.91-2,058.27. The next support level remains at 2,000, marked by previous level of resistance. There have been no confirmed negative signals so far. However, we can see technical overbought conditions. The index continues to trade within a slightly descending medium-term trading channel, as the daily chart shows:

Expectations before the opening of today’s trading session are positive, with index futures currently up %. The European stock market indexes have gained % so far. Investors will now wait the Factory orders data release at 10:00 a.m. The S&P 500 futures contract trades within an intraday uptrend, as it reaches new short-term highs. The nearest important level of resistance is at around 2,075-2,080, marked by some previous medium-term local highs. The nearest important level of support is at 2,050, and the next support level is at 2,030, marked by recent local low, as the 15-minute chart shows:

The technology Nasdaq 100 futures contract follows a similar path, as it extends its short-term uptrend. The nearest important level of support is at around 4,500, marked by previous resistance level. On the other hand, potential resistance level is at 4,600. There have been no confirmed negative signals so far. However, we can see short-term overbought conditions:

Concluding, the broad stock market continued its short-term uptrend on Friday, as investors reacted to monthly jobs data announcement, among others. The S&P 500 index is getting closer to its last year’s medium-term highs. Will it break above the crucial long-term resistance level of 2,100-2,150 this time? Or is this just an upward move within a slightly descending medium-term trading channel? We can see some short-term technical overbought conditions. However, there have been no confirmed negative signals. We still prefer to be out of the market, avoiding low risk/reward ratio trades. We will let you know when we think it is safe to get back in the market.
Thank you.

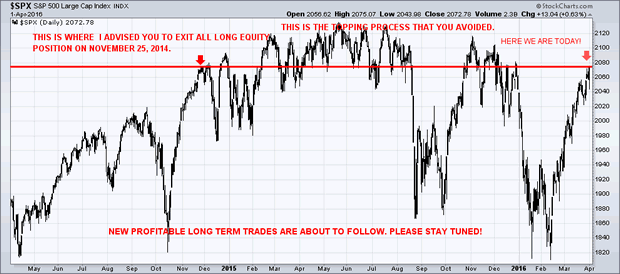
Looking at the chart above, there is now good reason to believe the rip-roaring 13% rally from mid-February has come too far too fast and may be in the process of topping out.
Periodically the S&P 500 will get extremely stretched, moving too far above or too far below its 50-day moving average indicated by the horizontal red and green lines. When this happens, we typically see an important top or bottom in the market take place.

-
I know Mike is a very solid investor and respect his opinions very much. So if he says pay attention to this or that - I will.
~ Dale G.
-
I've started managing my own investments so view Michael's site as a one-stop shop from which to get information and perspectives.
~ Dave E.
-
Michael offers easy reading, honest, common sense information that anyone can use in a practical manner.
~ der_al.
-
A sane voice in a scrambled investment world.
~ Ed R.
Inside Edge Pro Contributors

Greg Weldon

Josef Schachter

Tyler Bollhorn

Ryan Irvine

Paul Beattie

Martin Straith

Patrick Ceresna

Mark Leibovit

James Thorne

Victor Adair