
Stocks & Equities
Summary
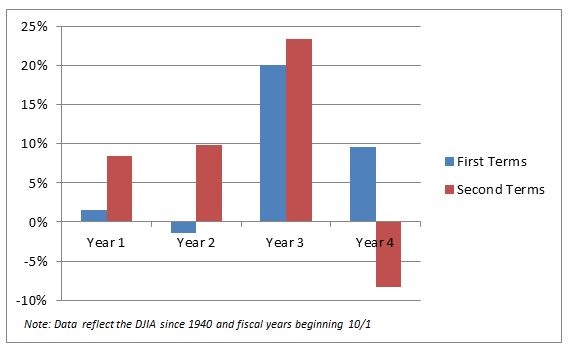
The negative January closes on U.S. equity indexes is an ominous sign for 2016.
In addition, equities traditionally struggle in election years.
We created seasonal indicators which give high-probability glide paths for trading 2016.

Financial expert Peter Schiff gives a
On CNBC and his guest appearances, Schiff says, “CNBC used to have me on all the time before the 2008 financial crisis. Even though they thought I was saying all kinds of things they thought were crazy, they had me on just to be balanced. No one knew who I was, and I was saying all these outrageous things, but ever
You would think they would care about their audience, but I think they care more about their advertisers and their other guests that want to shill Wall Street products.”
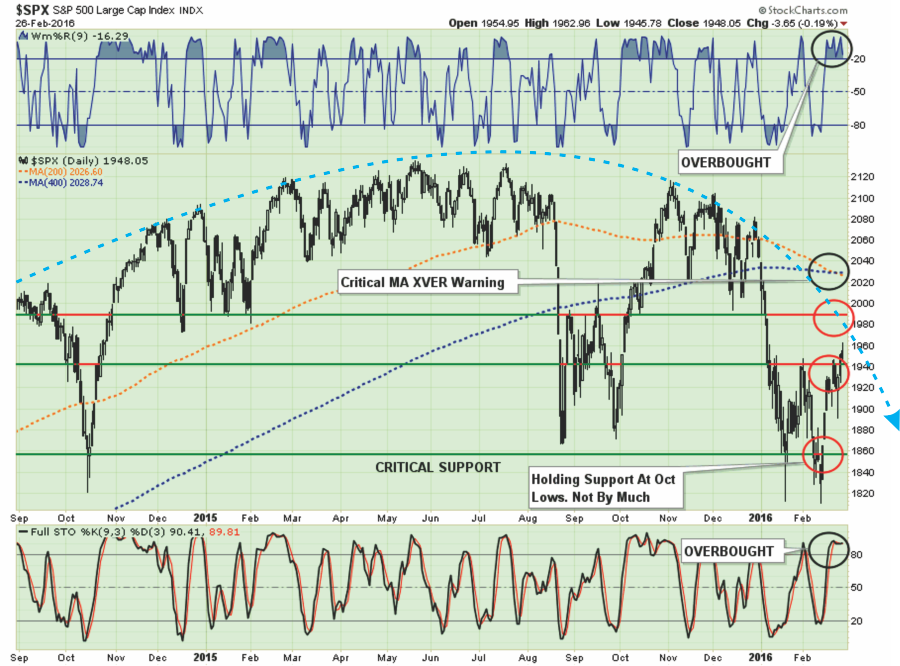
In last week’s missives, I discussed the potential for an oversold, short-covering bounce which was to be used to further rebalance portfolios and reduce equity risk. The target zone was 1940 to allow for the completion of the “risk reduction” process.
“That rally could take the markets back to the previous resistance of 1940 (about a 4% push) from current levels. Such a rally would be enough to suck many of the “bulls” back into the markets pushing markets back into overbought territory and setting up the next decline.”
The good news is that the market was able to break above 1940, and the 50-dma, which now clears the way for a push to the 1970-1990 where the next levels of resistance will be found.
The bad news is that the markets are once again extremely overbought and still confined inside of an overall downtrend.

… It is going to take longer to unfold then people think!
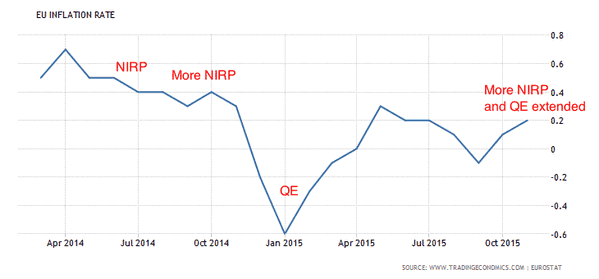
Japan’s NIRP announcement & the US$
Japan is at the forefront of the Keynesian central planning that has been in the markets for the past few decades. The federal reserve first went to ZIRP and launched quantitative easing in 2008. The European central bank went to ZIRP and they launched QE in 2015. The bank of Japan first went to ZIRP in 1999, in which they then launched quantitative easing in 2000. They’re much more experienced in seeing what these sorts of policies can accomplish.
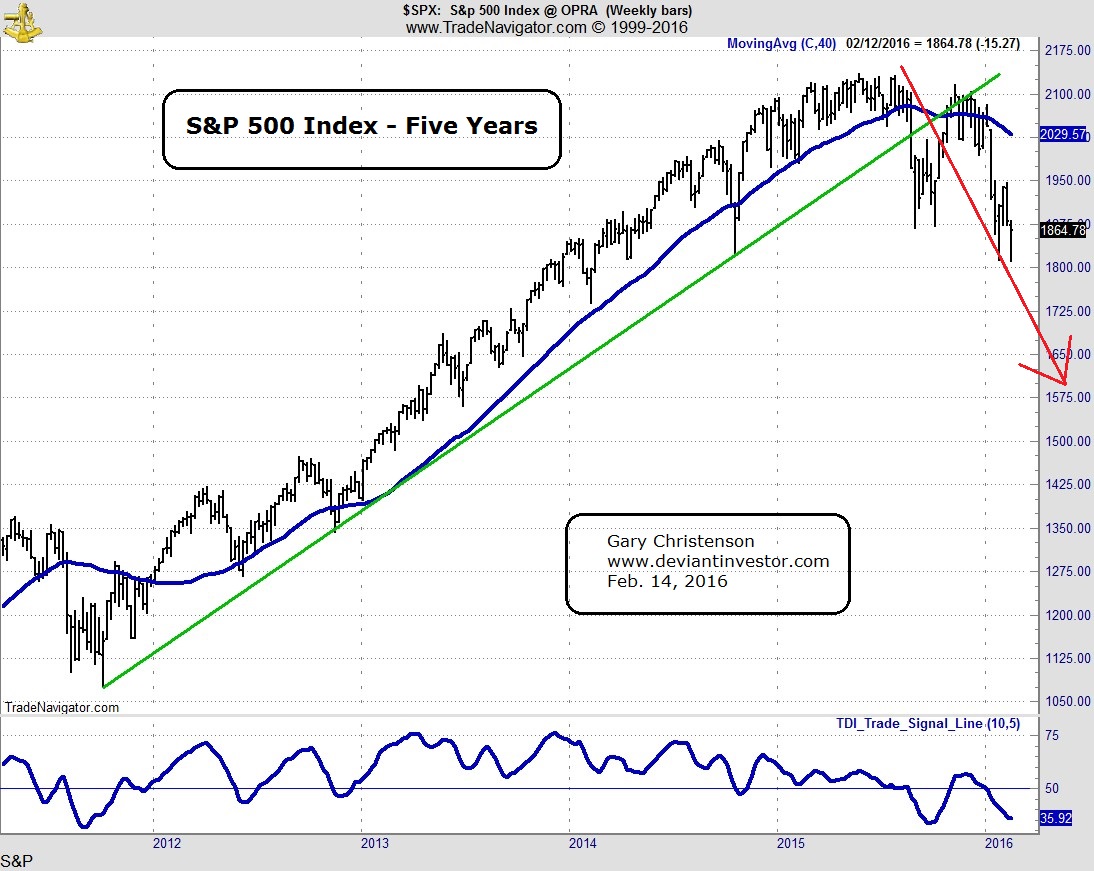
The S&P 500 Index (chart below) shows a top in May 2015, a correction into August, and a deeper fall this month – February 2016. Look out below.
The Shanghai Composite Index looks grim.

-
I know Mike is a very solid investor and respect his opinions very much. So if he says pay attention to this or that - I will.
~ Dale G.
-
I've started managing my own investments so view Michael's site as a one-stop shop from which to get information and perspectives.
~ Dave E.
-
Michael offers easy reading, honest, common sense information that anyone can use in a practical manner.
~ der_al.
-
A sane voice in a scrambled investment world.
~ Ed R.
Inside Edge Pro Contributors

Greg Weldon

Josef Schachter

Tyler Bollhorn

Ryan Irvine

Paul Beattie

Martin Straith

Patrick Ceresna

Mark Leibovit

James Thorne

Victor Adair