
Stocks & Equities

A precious blood sample arrived at Laura Walker’s lab in Lebanon, New Hampshire one year ago.
It wasn’t much–just 50 milliliters (about 1.7 fluid ounces).
But this tiny sample turned out to hold tremendous scientific value. It was from a person fortunate to survive the deadly Ebola virus outbreak of 2014. Walker and her colleagues wanted to know if they could identify some special antibodies in that person’s blood. If this person had special Ebola-neutralizing antibodies, that might help explain why that person lived. The antibodies might also help provide a template for future development of a vaccine. Or, they could be the basis for genetically engineered copies that could be manufactured at large scale, stockpiled and used to rescue people newly infected in an outbreak.

- A potent move with two consecutive gaps and a sort of Three White Soldiers pattern represents a strong reversal. Bulls are launching a counterattack
- Although it is doubtful that corrective down leg from the February 2 high has completed the assumed wave (5) if SP 500 breaches the February peak then we should expect a large countertrend rally (Double Bottom?)
- Since price is now quite extended a pullback is probable. If the range 1895.50 – 1881 holds then odds should favor a break out above the February 2 high

- Hourly RSI is extremely overbought and it is displaying a small negative divergence hence some type of consolidation activity is plausible

- Due to the questionable ending pattern (Expanded Ending Diagonal?) a Triangle is still possible (Now unfolding the wave C) but less likely. If this is the case the first step is a reversal and the loss of the support located in the range 1895 (Today’s gap) – 1889 (200 hr. ma)

- Despite the doubts if bulls are able to reclaim the February 2 high then the key price levels (Potential reversal areas) are located at R1 = 1961 (50 dma) – 1963 (0.5 retracement); R2 = 1999 (0.618 retracement); R3 = 2032 (200 dma). The Double Bottom has a measured target at 2084.
- Bulls have on their side that the decline from the May top has unfolded a corrective 3-wave down leg (From the 2009 low a corrective decline has always been followed by the resumption of the uptrend), but with overhead resistance looming and short term indicators at extremes we shall see if buying pressure persist.
- If above 1948 I would be surprised if SP 500 exceeds the 0.618 retracement


We continue to classify the prospective equity market return/risk profile within the most negative climate we identify. The basis of this classification is fairly straightforward. Historically, once an extended speculative period of extreme overvalued, overbought, overbullish conditions gives way to increasing risk-aversion, as indicated by deterioration in market internals (and particularly in the presence of hostile yield trends in the form of widening credit spreads), the stock market has become vulnerable to vertical losses. Though not every instance of this syndrome has been followed by a market collapse, every notable panic and market crash across more than a century of data has featured that basic setup.

Monthly time frame:
The technical evidence is suggesting that the odds that SP 500 has begun a bearish cycle are large. To keep it simple we have four reasons:
- MACD has triggered a bearish signal cross
- The slope of the 10 mma has turned negative
- The 10 mma has crossed the 20 mma; Red arrows (Pending confirmation at end of the month)
- We have a sequence of lower lows/highs
If this is the case the trend line from the March 2009 low eventually will be breached and the MACD will lose the zero line. The bearish cycle should establish a bottom when the RSI crosses/reaches the oversold line
Initially as a guide we have three potential targets:
- Target 1 (Shallow): 2000-2007 double top break out and 0.382 retracement of the rally from 2009 low in the range 1574-1553
- Target 2 (Moderate): 0.5 retracement of the rally from 2009 low at 1402
- Target 3 (Severe): 0.618 retracement of the rally from 2009 low at 1227
During a bearish cycle usually there are sharp snap back rallies that fail at the 10 mma. During the 2000-2002 bearish cycle there were five attempts while only two during the 2007-2009 one (Black arrows)

Weekly time frame:
- From the May top so far we have a 3-wave down leg (ABC = Zig Zag)
- The assumed wave (C) can be the wave (A) of a much larger Zig Zag; the wave (W) of a Double Zig Zag or the wave (1) of an impulsive wave (C)
- The Fibonacci extension targets for the wave (C) are located in the range 1776 – 1683
- If the decline from the November lower high were impulsive then last week Hammer candlestick would have most likely completed the three wave decline from the May top. In my humble opinion a short-term bottom is doubtful. If this is the case a short-term bottom is more likely to be established at the trend line from the 2009 low, which is located at 177o ish
- In the weekly time frame the key resistance levels are located at R1 (Trend line that connects the October-August-February 2015 lows) at 1893 +/-; R2= 1908 ish; R3 = 1947
- If the wave (C) is in place R4 = 1972 and R5 = 1993 could come into play

Daily time frame:
- I have been suggesting that from the November lower high the current decline can be counted as impulsive
- The issue is that the down leg from the February 1 peak is overlapping hence EW wise a bottom should not be in place (The wave 5 cannot be considered completed)
- Even though next week I expect a larger bounce, if the R1 box (10 dma; 20 dma and trend line) is breached I expect SP 500 to fail at the R2 = 1927
- If I am wrong, this is the initial stage of a move towards T1 or even T2

60 minute time frame:
If the wave (5) is not in place we could have two scenarios. Once the wave (5) is in place I expect a large snap back rally that should establish another lower high.
- Triangle:

- Ending Diagonal:

 Charts Monitor, Rather Than Dismiss Fundamental Data
Critics of technical analysis often mistakenly believe that using charts discounts the importance of fundamental data, such as earnings, employment, and economic growth. Charts allow investors to monitor the aggregate investor interpretation of all the fundamental data. Said another way, charts are efficient tools used to monitor vast amounts of fundamental data, which is important since fundamentals ultimately determine which assets classes will perform best. When the economy is healthy, stocks tend to beat bonds. When economic fear dominates, bonds tend to beat stocks. In this article, we will cover the latest signal from the markets that came on February 11, 2016.
Dow Theory Is Based On Economic Common Sense
Dow Theory is based on a series of Wall Street Journal articles written by Charles Dow. The basic tenets of Dow Theory are easy to understand. Charles Dow believed that:
 In order for industrial companies to increase their earnings, they had to produce and sell more goods.
- If industrial companies are selling more goods, then transportation companies must be delivering more goods to retailers and wholesalers.
- Therefore, in a healthy economy, both industrial companies and transportation companies should be experiencing revenue growth.
- If industrial and transportation companies are growing their revenues, then the industrial and transportation stocks should be attractive to investors.
- If industrial and transportation companies are doing well and are attractive to investors, both the Dow Jones Industrial Average and the Dow Jones Transportation Average should be making new highs in unison, serving to confirm a healthy economy.
- From a bearish perspective, signals are generated when the two indexes make important new closing lows, which is indicative of a weakening economy.
Behind The Averages
After reviewing the companies in the industrial and transportation averages, it is easy to see why they represent logical vehicles to monitor the pulse of the U.S. economy. I the present day, our economy is driven by more than just industrial or manufacturing companies. The Dow Jones Industrial Average contains traditional producers, such as IBM (IBM), 3M (MMM), Boeing (BA), Chevron (CVX), and Johnson & Johnson (JNJ). However, the Dow (DIA) also contains Visa (V), Goldman Sachs (GS), and American Express (AXP), since the present day economy relies heavily on the financial sector. The Dow Jones Transportation Average (IYT) still has railroads, such as Union Pacific (UNP) and Norfolk Southern (NSC), but it also contains more modern logistics companies, such as United Parcel Service (UPS), Fed-Ex (FDX), and J.B. Hunt (JBHT).
Just Reconfirmed Primary Bear Market
If investors believe industrial and transportation stocks are starting to become less desirable that speaks to their conviction to own these key sectors vs. their conviction to sell. When aggregate bearish conviction starts to outweigh aggregate bullish conviction, stock prices start to fall, which is also a reflection of investors’ perception regarding future economic outcomes. The Dow Jones Industrial Average posted a new closing low on Thursday, February 11, 2016.
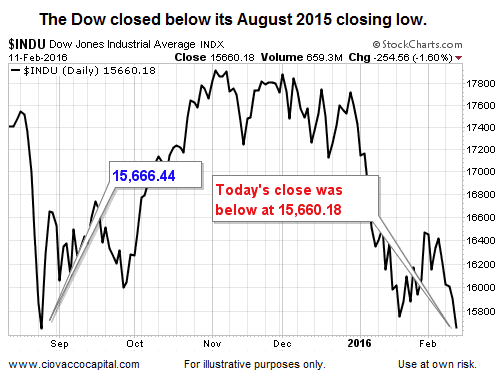
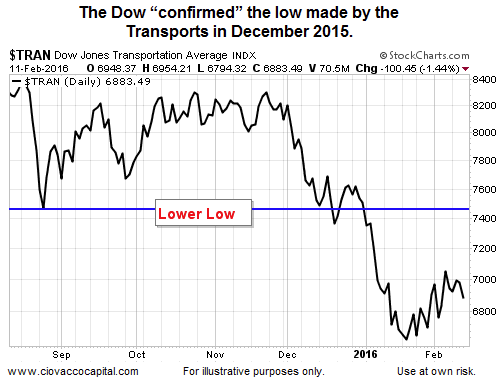
Similarly, the Dow Jones Transportation Average also posted a new closing low in December of last year. These lows are the basis for a new Dow Theory primary bear market confirmation signal.
Investment Implications – The Weight Of The Evidence
Our market model does not use Dow Theory, but it does use numerous inputs based on the Dow Jones Industrial Average. As noted in early January, the evidence has been saying “It Is A Good Time To Check Your Bear Market Game Plan”. The Dow Theory signal that occurred on February 11 is another form of evidence saying the same thing. We continue to be concerned about the set-ups described on February 5. Conditions can begin to improve at any time, but until they do our allocations will continue to favor conservative assets (TLT) over growth-oriented assets (SPY).

-
I know Mike is a very solid investor and respect his opinions very much. So if he says pay attention to this or that - I will.
~ Dale G.
-
I've started managing my own investments so view Michael's site as a one-stop shop from which to get information and perspectives.
~ Dave E.
-
Michael offers easy reading, honest, common sense information that anyone can use in a practical manner.
~ der_al.
-
A sane voice in a scrambled investment world.
~ Ed R.
Inside Edge Pro Contributors

Greg Weldon

Josef Schachter

Tyler Bollhorn

Ryan Irvine

Paul Beattie

Martin Straith

Patrick Ceresna

Mark Leibovit

James Thorne

Victor Adair