
Stocks & Equities
 If you think the recent bounce in the Dow and other world markets means an end to this year’s opening curtain of turbulence, think again and instead, fasten your seatbelts. The fact is you haven’t seen anything, yet.
In the weeks ahead, the Dow Industrials will fall as low as 13,938 … the S&P 500, as low as 1,353.00.
After some pullbacks, the dollar will stair-step higher this year to over 112 on the Dollar Index, roughly a 13% gain. The euro, conversely, will plunge to 0.91, or worse. The pound sterling will crash into the 1.30 level. And even the Chinese yuan will suffer one blow after another.


- The gold price rally is accelerating. Please click on the chart above to enlarge. That’s the four hour bars gold chart, and the price action is solid. Gold has broken out to the upside, from a second inverse head and shoulders bottom pattern.
- After a sharp pullback to the $1100 – $1108 area, gold should move nicely higher, towards my $1145 target zone.
- Please click here now. Double-click to enlarge. That’s the four hour bars chart for silver, and it’s staging a solid upside breakout from a symmetrical triangle pattern this morning! The target is the $15 area, which is the break-even point for a number of silver mining companies.
- From a fundamental perspective, gold now has a vast array of supportive price drivers. In the immediate term, Chinese New Year buying is a factor.
- Also, India’s finance minister may be poised to unveil a massive gold import duty cut in the upcoming annual budget. That’s because supply-related collapse in oil prices has dramatically cut the nation’s current account deficit, as a percentage of GDP. The gold import duty is no longer a viable scapegoat for that shrinking deficit.
- The El Nino weather system may end as early as May, and La Nina is poised to replace it. La Nina is bad news for US grain and South American crops, and good news for Indian crops, which is good news for Indian farmers, who are the world’s largest buyers of gold.
- Gold peaked near $1923 in 2011, just a few months after the horrific Japanese earthquake occurred. The dollar then began soaring against the yen, but now it has stalled, and yesterday Japan announced the first monthly trade surplus since the earthquake.
- On that note, please click here now. Double-click to enlarge this important dollar versus yen daily bars chart.
- Most amateur technicians follow the USDX (dollar index) chart for cues about gold, but the dollar versus yen chart is vastly more important. Large FOREX traders view the yen, not the dollar, as the world’s safe haven fiat currency.
- When money flows out of the yen, it flows out of gold. When money flows into the yen, it moves into gold. The yen and gold are both poised to begin what will likely be the largest rally of the past five years.
- Janet Yellen and her fellow Fed workers are scheduled to begin their next meeting today, with an announcement expected tomorrow. Please click here now. Goldman Sachs economists feel the US stock market will have another “wet noodle” year, and that’s my view.
- Ben Bernanke was Wall Street’s best friend. He unveiled a bizarre QE program that ravaged Main Street. That program encouraged Wall Street to borrow money and use it for stock buybacks and dividends. In a nutshell, Ben Bernanke helped engineer what I call “marked to model price/earnings ratios” for US companies.
- Over the past seven years, Wall Street arguably spent more money on stock buybacks and dividends than it did on company operations, and the piper must be paid.
- Janet Yellen should not be confused with Ben Bernanke. She is Main Street’s friend. She proved it by tapering Ben’s horrific QE program off the board, exactly as I predicted she would. Now, she is poised to raise interest rates repeatedly, much to Wall Street’s chagrin.
- US citizens (Main Street) will then put money into bank accounts, and banks will lend that money in the fractional reserve system, reversing US money velocity.
- The US stock market will probably experience many more violent sell-offs as Janet hikes again, again, and again. That will fuel more FOREX trader safe haven buying of the yen, and of gold.
- Janet could hike rates this week, but I think she’ll give Wall Street a break. She’ll likely wait until the spring, before hammering global stock markets with her next hike.
- Please click here now. Double-click to enlarge this daily bars oil chart. Horrifically, some oil producers are getting less than $20 a barrel for their oil right now. That’s because their oil is not the high quality “West Texas Intermediate” oil that the NYMEX uses for their benchmark pricing.
- Please click here now. Ominously, the storage tanks in Cushing, Oklahoma are in danger of reaching full capacity, and may have already briefly done so last week.
- US frackers are still pumping oil fiendishly, trying to pay substantial debt from unprofitable revenues. OPEC can produce profitably at much lower prices than the frackers, but OPEC governments need high revenues to prevent social unrest.
- While oil could now rally to my $37 – $41 short term target zone, storage tanks are likely to hit full capacity by then, triggering a terrible meltdown to the $10 – $20 zone.
- Civil unrest could occur in OPEC nations as the oil price tumbles, and Iran-Saudi tensions could grow, creating a gold buying frenzy by institutional investors. It’s hard to know how the US stock market would respond to such a horrific event, but I would suggest that the Western gold community may want to seek shelter from that storm, before it happens.
- On that note, please click here now . Double-click to enlarge. Barrick has just staged a solid upside breakout, and where Barrick goes, most gold stocks tend to go.
- Please click here now. Double-click to enlarge this key GDX daily bars chart. The massive bull wedge pattern in play suggests than an “institutional awakening” is at hand for the gold stocks sector, as the oil supply glut and Janet’s rate hikes send global stock markets into a financial gulag. I’ll dare to suggest that equity-oriented money managers are soon going to view gold stocks as asset class champagne!
Jan 26, 2016
Stewart Thomson
Graceland Updates
website: www.gracelandupdates.com
email for questions: stewart@gracelandupdates.com
email to request the free reports: freereports@gracelandupdates.com
Graceland Updates Subscription Service: Note we are privacy oriented. We accept cheques. And credit cards thru PayPal only on our website. For your protection we don’t see your credit card information. Only PayPal does.
| Subscribe via major credit cards at Graceland Updates – or make checks payable to: “Stewart Thomson” Mail to: Stewart Thomson / 1276 Lakeview Drive / Oakville, Ontario L6H 2M8 / Canada |
Stewart Thomson is a retired Merrill Lynch broker. Stewart writes the Graceland Updates daily between 4am-7am. They are sent out around 8am. The newsletter is attractively priced and the format is a unique numbered point form; giving clarity to each point and saving valuable reading time.
Risks, Disclaimers, Legal
Stewart Thomson is no longer an investment advisor. The information provided by Stewart and Graceland Updates is for general information purposes only. Before taking any action on any investment, it is imperative that you consult with multiple properly licensed, experienced and qualifed investment advisors and get numerous opinions before taking any action. Your minimum risk on any investment in the world is 100% loss of all your money. You may be taking or preparing to take leveraged positions in investments and not know it, exposing yourself to unlimited risks. This is highly concerning if you are an investor in any derivatives products. There is an approx $700 trillion OTC Derivatives Iceberg with a tiny portion written off officially. The bottom line:
Are You Prepared?


STRATEGY OF THE WEEK
For Active Traders, this is a great time. The volatility in the market provides lots of reward for risk potential if you have a very short term time horizon and the skill to trade the market through the day. For the longer term investor, I recommend staying on the sidelines in cash until the market shows stability and a reversal of the downward trend. Correction bring great opportunity but you have to be patient and wait for the dust to settle. Sit on your hands for now.
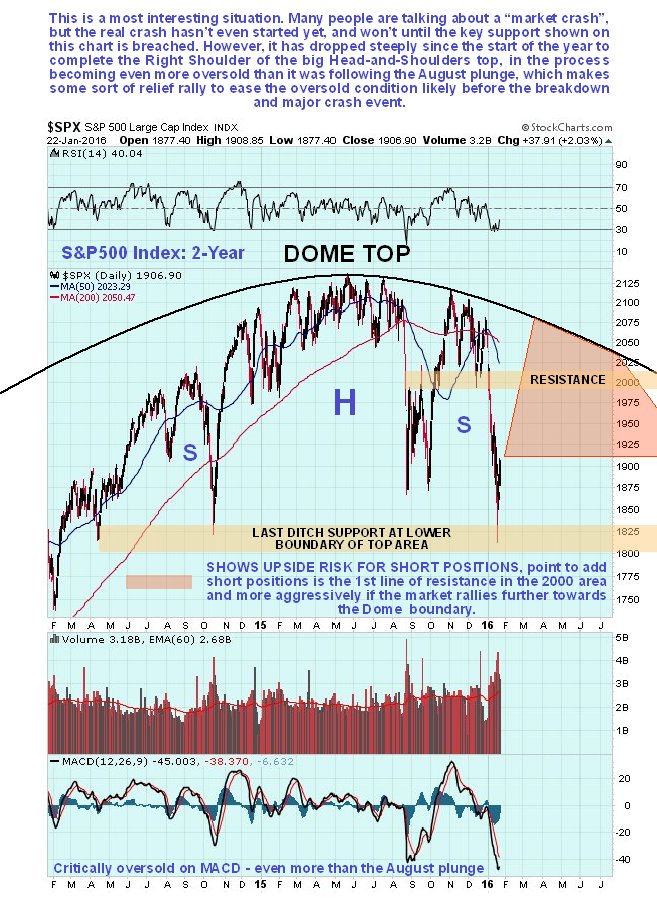
The purpose of this update is to define exactly where we are on the market clock, because if we know where we are, broadly speaking we will know where we are going.
Last week the market plunged to arrive at the last ditch support level in the 1800 – 1850 zone on the S&P500 index that we had earlier defined as marking the lower boundary of the giant Head-and-Shoulders top. Once this level is breached, the full-on crash starts. Because it arrived at this support level in an even more oversold state than it was at the depths of the plunge last August, and because Smart Money has become bullish, it made it unlikely that it would break down and crash just yet, and sure enough the market has started to bounce, which means that the danger has probably abated, for now.
As discussed last weekend at length, the markets are currently exhibiting all the traits of a “correction action.” During these discussions, I have reiterated that you should not “panic sell” into the decline but instead take a disciplined approach to exiting the markets. To wit:
“I know as I write this, that come Monday morning my inbox will be flooded with emails asking if it’s time to go to ‘all cash.’
No. I NEVER suggest being in ‘all cash.’ From a management standpoint, this is never a good idea. Trying to ‘time the market’ is impossible over the long-term and leads to very poor emotionally based decision making. However, as I regularly write, it is our job to reduce portfolio risk to manageable levels to preserve capital over time. We can do that by increasing and reducing our exposure to equity-related risk by paying attention to the price trends of the market.
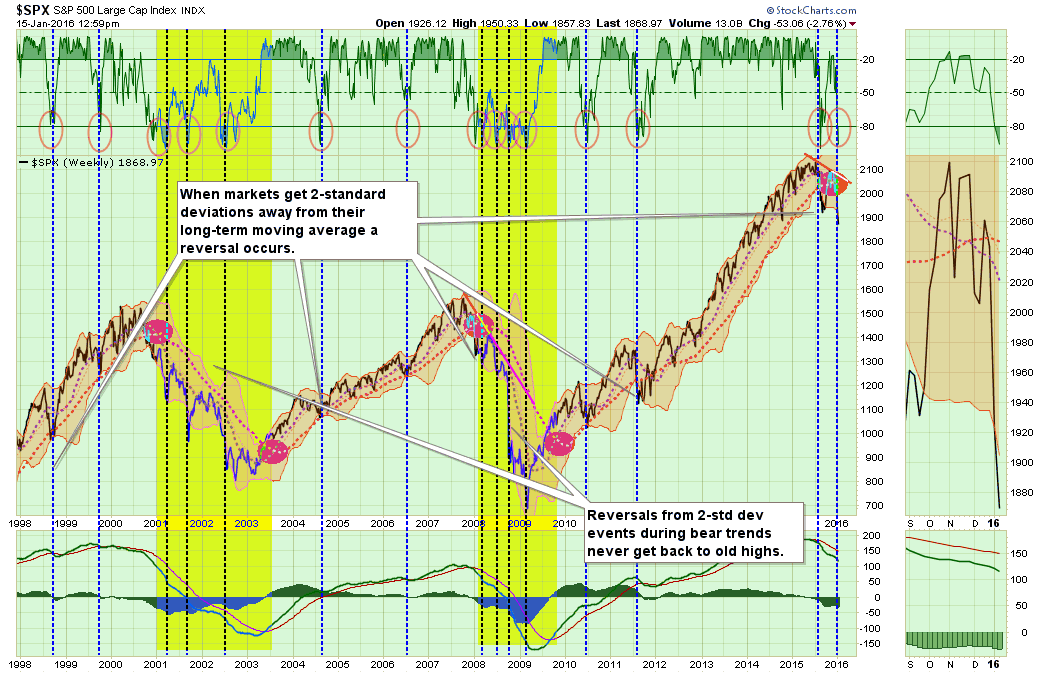
By the time the markets register important “sell signals” denoting a change from the bullish to bearish trend,the markets are generally oversold from the previous selling. This is, as shown in the chart below, always the case.”
….for more analysis and more larger charts go HERE
….for more analysis and more larger charts go HERE

-
I know Mike is a very solid investor and respect his opinions very much. So if he says pay attention to this or that - I will.
~ Dale G.
-
I've started managing my own investments so view Michael's site as a one-stop shop from which to get information and perspectives.
~ Dave E.
-
Michael offers easy reading, honest, common sense information that anyone can use in a practical manner.
~ der_al.
-
A sane voice in a scrambled investment world.
~ Ed R.
Inside Edge Pro Contributors

Greg Weldon

Josef Schachter

Tyler Bollhorn

Ryan Irvine

Paul Beattie

Martin Straith

Patrick Ceresna

Mark Leibovit

James Thorne

Victor Adair