
Stocks & Equities
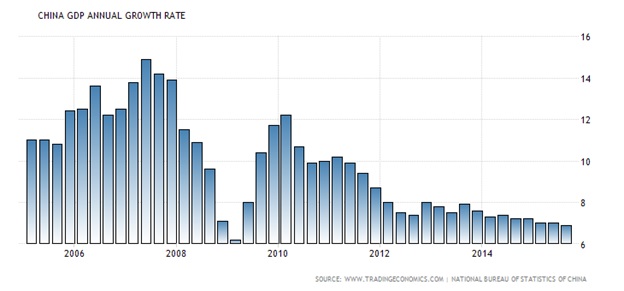
This coming New Year of 2016 is the year of the Monkey, according to the Chinese calendar. Will this cause wild gyrations in the Chinese and World stock markets, which are symbolized by the volatile nature of the Monkey? Many do not believe that China can derail the world economy, however, but here I explain why they are missing the point. Directly or indirectly, China’s slowdown will definitely lead to a global meltdown.

For Monday January 4, 2016 Mon- Friday after 6:00 P.M. Eastern, 3:00 Pacific.
| Thu. | Mon. | Tue. | Wed. | Thu. | Mon. | Evaluation | |
| Monetary conditions | 0 | 0 | 0 | 0 | 0 | 0 | 0 |
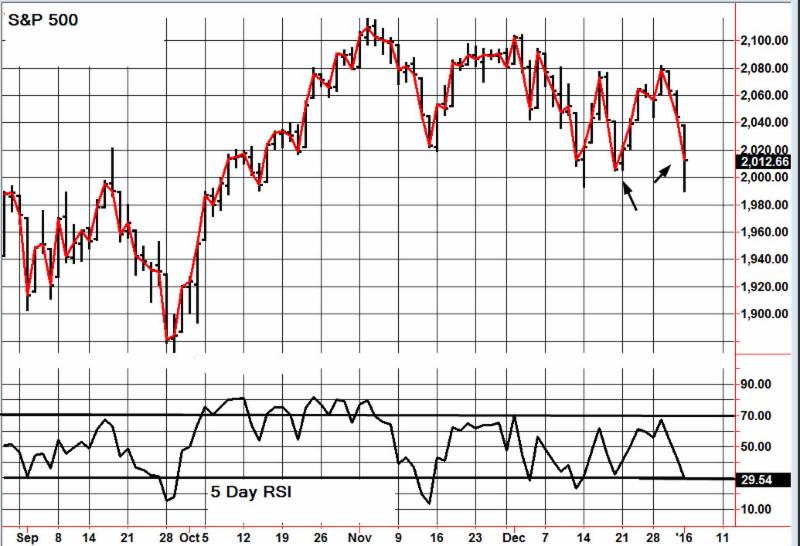
| 5 day RSI S&P 500 | 59 | 56 | 67 | 55 | 43 | 30 | + |
| 5 day RSI NASDAQ | 60 | 57 | 71 | 57 | 42 | 26 | + |
|
McCl-
lAN OSC.
|
+159 | +98 | +149 | +68 | +32 | -30 |
0
|
| Composite Gauge | 10 | 11 | 5 | 15 | 16 | 15 | + |
| Comp. Gauge, 5 day m.a. | 7.8 | 6.8 | 6.8 | 9.0 | 11.4 | 12.4 | 0 |
| CBOE Put Call Ratio | .92 | 1.30 | .82 | .99 | 1.01 | 1.07 |
+
|
| VIX | 15.74 | 16.91 | 16.08 | 17.29 | 18.21 | 20.70 | 0 |
| VIX % change | +1 | +7 | -5 | +8 | +5 | +14 | + |
| VIX % change 5 day m.a. | -3.4 | -3.8 | -2.8 | +1.0 | +3.2 | +5.8 | + |
| Adv – Dec 3 day m.a. | +1374 | +592 | +266 | -277 | -255 | -1063 | + |
| Supply Demand 5 day m.a. | .60 | .78 | .77 | .62 | .42 | .47 | 0 |
| Trading Index (TRIN) | 1.83 | 1.62 | .68 | 2.86 | 1.22 | 1.29 |
+
|
|
S&P 500
|
2061 | 2057 | 2078 | 2063 | 2044 | 2013 | Plurality +8 |

Most “first-level investors” spent the holiday season dumping any and all fixed income holdings like expired eggnog. The Fed rate hike got in their heads, and in their panic they tossed some perfectly good funds in the return bin.
Many closed-end funds are now trading at double-digit discounts to their net asset values (NAVs). Doubleline Capital founder and famed bond guru Jeffrey Gundlach recently told CNBC that buying a fund trading at a 15-20% discount is “sort of a no-brainer.”
Reason being, you’re getting $1 worth of assets for just 80 or 85 cents. That’s free money for us calculated second-level thinkers. All we need to do to collect it is buy these issues on sale, wait for the discount to close, and collect monthly yields of 0.5% or better while we wait.
Of course there’s no guarantee that a cheap fund won’t get cheaper in the short term. But over time, the market will normalize and discounted funds will see their prices trend up towards their underlying NAVs. Fund managers can even force the appreciation by buying back their own shares.
I love watching these closed-end fund discounts because they’re clear contrarian indicators. The more investors dislike a strategy at the moment, the greater the discount they demand. The irony being that most people love chasing recent performance, which means they’re most inclined to sell a loser at the moment it’s most likely to turn around.
Another good thing about closed-end funds is that their pool of investors – and hence capital – is actually fixed. An open-end fund issues as many shares as investors want to buy. That’s great until investors decide they want out, and the manager must sell perfectly good positions for cheap to cash out fleeing shareholders.
Closed-end fund investors, on the other hand, have to sell their shares to someone else on the way out. So, these managers don’t have to worry about a capital crunch. They’ve got a set pool of money thanks to the public markets, and they can sit tight on their positions through any panic.
5 Funds With 6-10% Yields and 10-15% Upside
Looking for some contrarian income today? Here are five closed-end funds with 6% yields or better, with double-digit upside to boot thanks to their current discounts. Let’s review them from cheap, to cheapest…
The Nuveen Municipal Opportunity Fund (NIO) is a nice way to capitalize on the periodic panic that engulfs the municipal bond market. “Muni bonds” are issued by states, cities, and counties to raise money for capital projects (like public transportation and infrastructure improvements).
The fund sells for a 10.8% discount to NAV today, and pays a 6.2% annual dividend that’s distributed monthly. It’s rarely this cheap:
NIO Is Rarely This Cheap
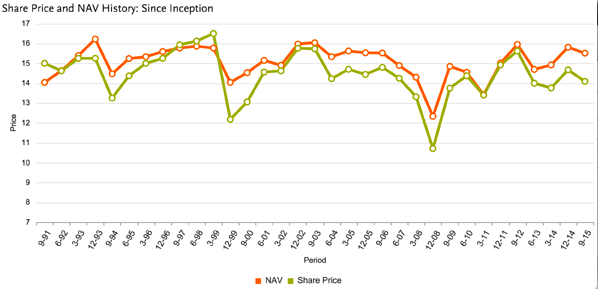
The BlackRock Corporate High Yield Fund (HYT) is a direct way to make a contrarian play on the recent free-fall in high yield. It’s a 4-star Morningstar fund with an 11.4% discount to NAV – about as steep as there’s ever been since the fund’s 2003 inception.
HYT owns debt issued by companies such as Ally Financial, HD Supply, and First Data. It pays a monthly dividend that adds up to an 8.4% annual yield.
The Calamos Strategic Total Return Fund (CSQ) invests in common stock, corporate bonds, and convertible bonds. It pays a juicy 10% annual dividend and sells at an 11.8% discount to NAV.
My problem with CSQ is its high allocation (59%) to common stocks. When stocks got crushed in 2008, the fund saw its NAV fall by 45%. The next time equities see a bear market, this fund is going to follow them south.
That’s why I like to see a little more “alpha” from my closed-end fund managers. The BlackRock Enhanced Equity Dividend Trust (BDJ) fits the bill from a strategy perspective. It buys dividend payers and sells covered call options on its holdings to generate additional income.
In doing so, BDJ is giving up the upside of a stock rally (because its shares will be “called” away). But in return, it will receive a bit of capital appreciation, the dividends, and the income from the call options it writes.
The net result is a portfolio that yields 7.8% annually. After fees, the fund pays 7.4% to investors. It sells at a 12.8% discount to NAV today.
Finally you can buy your own virtual toll bridge with the Cohen & Steers Infrastructure Fund (UTF). It invests in infrastructure companies that own and operate utilities, airports, toll roads, railroads, and other physical framework.
Since inception 11 years ago, UTF has returned 7.8% annually to investors, outpacing the S&P 500’s 7% gain. It will likely outperform in the years ahead thanks to its current 8.7% yield and 16% discount to NAV.
Before You Buy, Verify The “No-Brainer”
Sometimes cheap funds are “cheap for a reason.” Do your homework, and make sure you know what issues a fund holds before you buy it. Also be sure to research management’s track record and current strategy – they’re the ones pulling the strings.
Otherwise, you might end up with a fund like CSQ that delivers yield and looks great – until a bear market hits and you lose 40% or more!
If that sounds like a lot of work, don’t worry about it. I’m wrapping up my research in the next edition of the Contrarian Income Report as we speak. I’ll highlight my favorite closed-end fund for you to buy right now. We’ll also review the best bargains in our current portfolio.
If you’re not yet a subscriber, and you’d like to receive my favorite high yield picks immediately (which pay an average of 7.1%), you can learn more right here.
 Charts Help Us With Fundamental Perceptions
A properly conducted poll can help us better understand the net aggregate opinion of a general population. Using similar logic, stock market charts can help us monitor the net aggregate opinion of all market participants.
When the interpretation of all the relevant factors (earnings, valuations, Fed policy, future expectations, etc.) produces a net bullish opinion, stocks tend to perform well. When the net opinion is mixed, stocks tend to go sideways. During the early stages of a new bear market, the net aggregate opinion shifts from mixed to net bearish.
What Are The Stock Market Polls Telling Us Now?
2015 has, for the most part, been a sideways year for stocks, which tells us the present day net aggregate opinion of all market participants is mixed. From a mixed profile, eventually one of two things can happen to break the stalemate:
- The net aggregate opinion continues to roll over and stocks eventually drop.
- The net aggregate opinion improves and the market’s resolution is to the upside
This week’s stock market video uses a historical perspective to demonstrate why the stock market may be near a major inflection point. The general concepts outlined in the video are captured in the three stock market charts covered in the remainder of this article (below the video player).

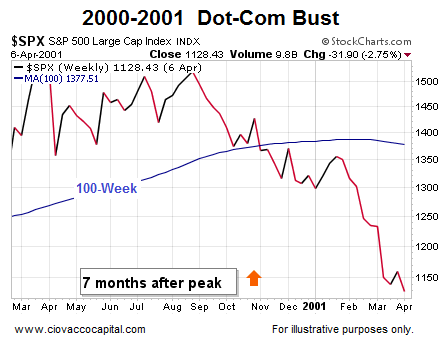
Net Aggregate Opinion Rolls Over In 2000-2001
Our market model looks at a wide array of market data using multiple timeframes. The 100-week moving average does a good job summarizing the present state of the observable facts. On the left side of the S&P 500 chart below, the net aggregate opinion still had a bullish bias (see slope of 100-week moving average in blue). The net aggregate opinion flipped to a mixed state as the slope of the 100-week moving average flattened out. Early in 2001, the market poll started returning bearish results.
Orange Arrows and Apples-to-Apples
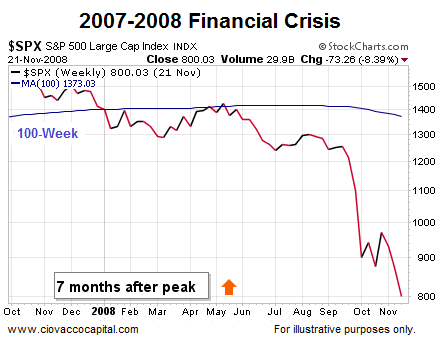
In 2015, the S&P 500 peaked in May, or seven months ago. Therefore, the most relevant point in the 2000-2001 chart above and 2007-2008 chart below is denoted by the orange arrows (seven months after the S&P 500 peaked).
2007-2008: Net Aggregate Opinion Turns Bearish
Is there anything magical about the 100-week moving average? No; remember we are using the 100-week moving average as an illustrative proxy for numerous other forms of hard evidence that are painting a similar picture as the stock market calendar prepares to flip into 2016. A similar “the net aggregate opinion rolled over” look was evident as stocks flipped from a bull market to a bear market in 2007-2008 (see below).
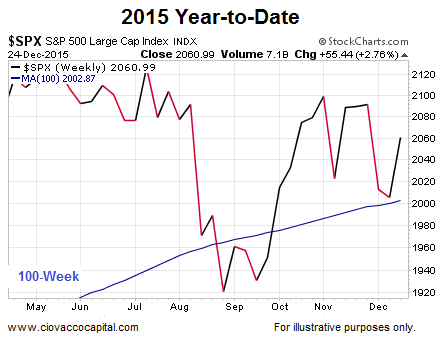
2015: Looks A Bit Better, But Still Vulnerable
This video clip compares the three charts (2000, 2007, & 2015) head-to-head. The key takeaway is the bulls have not thrown in the towel yet (price is still above the 100-week and the slope is still bullish in the 2015 chart below), but the margin of bullish error is getting very thin (price could easily drop below the 100-week and the slope could flatten out and roll over as it did in 2001 and 2008).
How Much Additional Damage Was Done in 2001 and 2008?
Since the S&P 500 peaked seven months ago, our analysis above focuses on seven months after the peak in 2000 and 2007. How much pain was inflicted on retirement plans and stock portfolios from seven months after the peaks in the S&P 500 to the end of the bear markets? The answers are not pretty. In 2001, stocks lost an additional 54%. In 2008, stocks lost an additional 48%, meaning it makes sense from a probability perspective to respect that big moves can follow possible inflection points in investor perceptions.
Flexibility Key Near Possible Inflection Points
As noted in the video, big moves following possible inflection points can be bearish (2000 & 2007) or bullish (1987, 1994, 2011). Therefore, it is prudent to have both bullish and bearish contingency plans in place as we prepare for 2016.
 ETF.com: Do you see value in the emerging market stock market after they’ve come down so much?
Marc Faber: There is value here and there. But in general, considering the slowdown I’m expecting, there’s no hurry to buy these emerging markets. You can wait for another six months or so.
If you said, “Marc, here’s $1 million. You have to choose, and you can only choose one thing: You can buy the U.S. stock market or you can buy emerging market stocks.” If this was an investment for the next five to 10 years, I would say to buy emerging market stocks.
related:
Marc Faber : Everything is distorted, and it’s a Relative Game
“The global economy is probably already in recession now. It will be more obvious in the U.S. in March or June of next year,” Marc Faber told ETF.com.
“At that time, the Fed will say, “Well, we didn’t want to increase interest rates, but there was pressure on us to do so. So we increased them, and now we have a recession, and now we have to cut them again and flood the market with QE4,”
“If you said, ‘Marc, here is $1 million, but you have to put everything in either gold or in the Dow Jones,’ then I would say I’d take gold,” he said.
“Everything is distorted, and it’s a relative game. Looking at the fundamentals of the world, including the quantity of money, the magnitude of debt as a percent of GDP, the low economic potential and the mad frame of mind of central bankers and their intellectual dishonesty, I would own gold,”
Marc Faber is an international investor known for his uncanny predictions of the stock market and futures markets around the world.Dr. Doom also trades currencies and commodity futures like Gold and Oil.

-
I know Mike is a very solid investor and respect his opinions very much. So if he says pay attention to this or that - I will.
~ Dale G.
-
I've started managing my own investments so view Michael's site as a one-stop shop from which to get information and perspectives.
~ Dave E.
-
Michael offers easy reading, honest, common sense information that anyone can use in a practical manner.
~ der_al.
-
A sane voice in a scrambled investment world.
~ Ed R.
Inside Edge Pro Contributors

Greg Weldon

Josef Schachter

Tyler Bollhorn

Ryan Irvine

Paul Beattie

Martin Straith

Patrick Ceresna

Mark Leibovit

James Thorne

Victor Adair