
Stocks & Equities
Tuesday December 15, 2015 3:00 Pacific
| Tue. | Wed. | Thu. | Fri. | Mon. | Tue. | Evaluation | |
| Monetary conditions | 0 | 0 | 0 | 0 | 0 | 0 | 0 |
| 5 day RSI S&P 500 | 41 | 34 | 38 | 23 | 31 | 47 | 0 |
| 5 day RSI NASDAQ | 49 | 33 | 40 | 24 | 30 | 43 | 0 |
|
McCl-
lAN OSC.
|
-169 | -176 | -152 | -252 | -290 | -156 |
+
|
| Composite Gauge | 15 | 13 | 12 | 17 | 9 | 9 | 0 |
| Comp. Gauge, 5 day m.a. | 13.6 | 13.0 | 12.2 | 14.4 | 13.2 | 12.0 | 0 |
| CBOE Put Call Ratio | 1.11 | .91 | 1.22 | 1.07 | 1.07 | .88 |
0
|
| VIX | 17.60 | 19.61 | 19.61 | 24.39 | 22.73 | 20.95 | 0 |
| VIX % change | +11 | +11 | -1 | +26 | -7 | -8 | – |
| VIX % change 5 day m.a. | +4.4 | +5.0 | +2.0 | +10.8 | +8.0 | +4.2 | + |
| Adv – Dec 3 day m.a. | -621 | -726 | -645 | -972 | -1252 | -613 | + |
| Supply Demand 5 day m.a. | .43 | .47 | .49 | .32 | .43 | .45 | + |
| Trading Index (TRIN) | 1.26 | .70 | .61 | 1.54 | .55 | .75 |
0
|
|
S&P 500
|
2064 | 2048 | 2052 | 2012 | 2022 | 2043 | Plurality +3 |

Wall Street’s proclivity to create serial equity bubbles off the back of cheap credit has once again set up the middle class for disaster. The warning signs of this next correction have now clearly manifested, but are being skillfully obfuscated and trivialized by financial institutions. Nevertheless, here are ten salient warning signs that astute investors should heed as we roll into 2016.
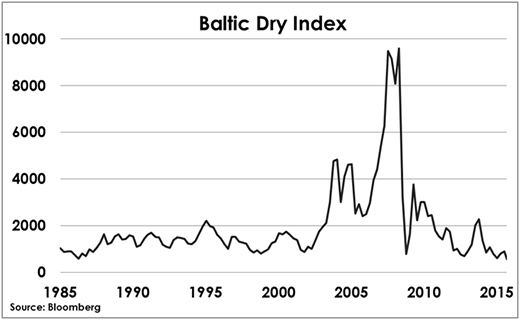
1. The Baltic Dry Index, a measure of shipping rates and a barometer for worldwide commodity demand, recently fell to its lowest level since 1985. This index clearly portrays the dramatic decrease in global trade and forebodes a worldwide recession.
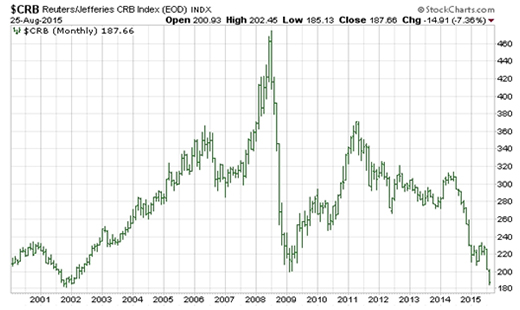
2. Further validating this significant slowdown in global growth is the CRB index, which measures nineteen commodities. After a modest recovery in 2011, it has now dropped below the 2009 level—which was the nadir of the Great Recession.
3. Nominal GDP growth for the third quarter of 2015 was just 2.7%. The problem is Ms. Yellen wants to begin raising rates at a time when nominal GDP is signaling deflation and recession. The last time the Fed began a rate hike cycle was in the second quarter of 2004. Back then nominal GDP was a robust 6.6%. Furthermore, the last several times the Fed began to raise interest rates nominal GDP ranged between 5%-7%.
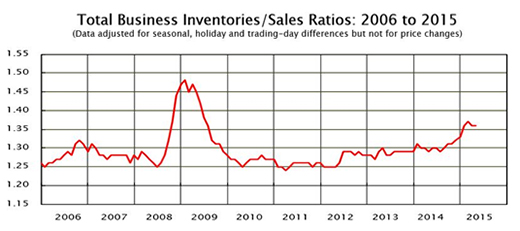
4. The Total Business Inventories to Sales Ratio shows an ominous overhang: sales are declining as inventories are increasing. This has been the hallmark of every previous recession.
5. The Treasury Yield curve, which measures the spread between 2 and 10 Year Notes, is narrowing. Recently, the 10-year benchmark Treasury bond saw its yield falling to a three-week low, while the yield on the Two-year note pushed up to a five-year high. This is happening because the short end of the curve is anticipating the Fed’s December hike, while the long end is concerned about slow growth and deflation.
Banks, which borrow on the short end of the curve and lend on the long end, are less incentivized to make loans when this spread narrows. This chokes off money supply growth and causes a recession.
6. S&P 500 Non-GAAP earnings for the third quarter were down 1%, and on a GAAP basis earnings plummeted 14%. It is clear that companies are desperate to please Wall Street and are becoming more aggressive in their classification of non-recurring items to make their numbers look better. The main point is why pay 19 times earnings on the S&P 500 when earnings growth is negative–especially when those earnings appear to be aggressively manipulated by share buy backs and through inappropriate charges.
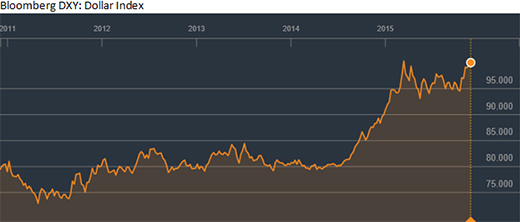
7. The rising US dollar is hurting the revenue and earnings of multi-national companies. Until recently, multinational companies have enjoyed a slow and steadily declining dollar from its mid-1980’s Plaza Accord highs. This decline boosted the translated earnings of multi-national companies. As the dollar index breaks above 100 on the DXY, multinational companies, which are already struggling to make earnings from a slowing global economy, are going to have to grapple with the effects of an even more unfavorable currency translation. In the long-term, a rising US dollar is great for America. However, it in the short-term it will not only negatively affect S&P 500 earnings, but also place extreme duress on the over $9 trillion worth of debt borrowed by non-financial companies outside of the U.S.A.
8. Recent data confirms that the US is currently in a manufacturing recession:
- The November ISM Manufacturing Index entered into contraction for the first time in 36 months posting a reading of 48.6. This is a decline from the anemic October reading of 50.1 and marked the fifth straight month this index was in decline.
- The Chicago purchasing manager’s index (PMI) came in at 48.7 for November signaling contraction.
- The latest Dallas Fed Manufacturing Business Index fell to -4.9, from -12.7 in the preceding month.
- The Empire State Manufacturing Survey came in at -10.7, a fractional increase from last month’s -11.6, signaling a decline in activity and registering close to the lowest levels since 2009.
- The November Richmond Fed Manufacturing Index dropped 2 points to -3 from last month’s -1.
9. Credit Spreads are widening as investors flee corporate debt for the safety of Treasuries. The TED spread, the difference between Three-month interest rates on Eurodollar loans and on Three-month T-bills, has been on a steady rise since October of 2013; at the end of September it was at its widest since August of 2012 at the height of the European debt crisis.
10. The S&P 500 is at the second highest valuation in its history:
- The Cyclically Adjusted Price-Earnings (CAPE) ratio, was 26.19 in November, a value greater than 25 indicates that the stock market is overpriced in comparison to its earnings history. The CAPE ratio has averaged 17 going back to 1881.
- The Q RATIO, the total price of the market divided by the replacement cost of all its companies, historically averages around .68, but is now hovering around 1.04.
- The P/E RATIO of the S&P 500 is around 19 – above the long-term historic average of 15.
- Total Market Cap to GDP ratio is 122, ten percentage points above the 2007 level and eighty percentage points higher than it was in 1980.
- The Price to Sales Ratio for the S&P is 1.82. That is higher than 2007, when it was 1.52 and is at the highest since the end of 2000.
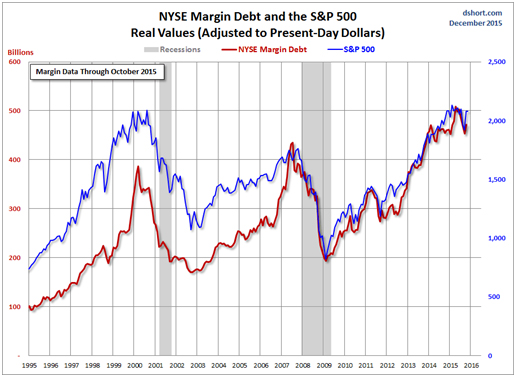
- And finally, Advisors Perspectives chart of inflation-adjusted NYSE Margin Debt and the S&P 500 demonstrates the profoundly over-leveraged condition of the market. Margin debt in real terms is now 20% greater than it was at the peak of the dotcom bubble
If those ten warning signs weren’t enough to rattle investors…this should. The Fed is threatening to do something highly unusual; to begin a rate hiking cycle when the global economy is on the brink of recession. Ms. Yellen has virtually promised to raise rates on December 16th and continue to slowly hike the cost of money throughout next year. Investors should forget about the “one and done” rate hike scenario. The truth is the Fed will be very slowly tightening monetary policy until the fragile US economy officially rolls over into a contractionary phase and the meaningless U3 unemployment rate begins to move higher.
This current economic expansion is now 78 months old, making it one of the longest in U.S. history. There have been six recessions since the modern fiat currency era began in 1971. The average of those has brought the S&P 500 down a whopping 36.5%. Given that this imminent recession will begin with the stock market flirting with all-time highs, the next stock market crash should be closer to the 2001 and 2008 debacles that saw the major averages cut in half.
Total U.S. public and private debt levels have climbed to the staggering level of 327% of GDP. Therefore, humongous debt levels and massive capital imbalances have set up the stock market for its third major collapse since the year 2000. Investors should proceed with extreme caution now that the warning signs have been blatantly explained.
 High-yield bond weakness has led investors to fear that a recession or bear market may be forthcoming. Widening of high-yield bond spreads (the spread between yields on high-yield bonds and comparable U.S. Treasuries) preceded the start of the stock market downturns in 2000 and 2008, causing many to ask if the latest bout of high-yield weakness portends another downturn.
Here we try to answer that question by looking at characteristics unique to the high-yield bond market and prior periods of similar high-yield weakness.
HIGH-YIELD DISTINCTIONS

Currently, stocks are extremely overvalued by multiple methods.
- The first way is by looking at Cyclically Adjusted P/E Ratios commonly known as CAPE, Shiller P/E, or P/E 10 ratio.
- The second is by looking at median P/E and P/S (Price to Sales) measures
We will look at both, but here’s a description of CAPE.
CAPE is a valuation measure applied to stock market indexes. It’s defined as price divided by the average of ten years of earnings (Moving average), adjusted for inflation. The essential idea is earnings are mean-reverting making forward looking earnings frequently too optimistic, and current PEs too high following steep corrections. 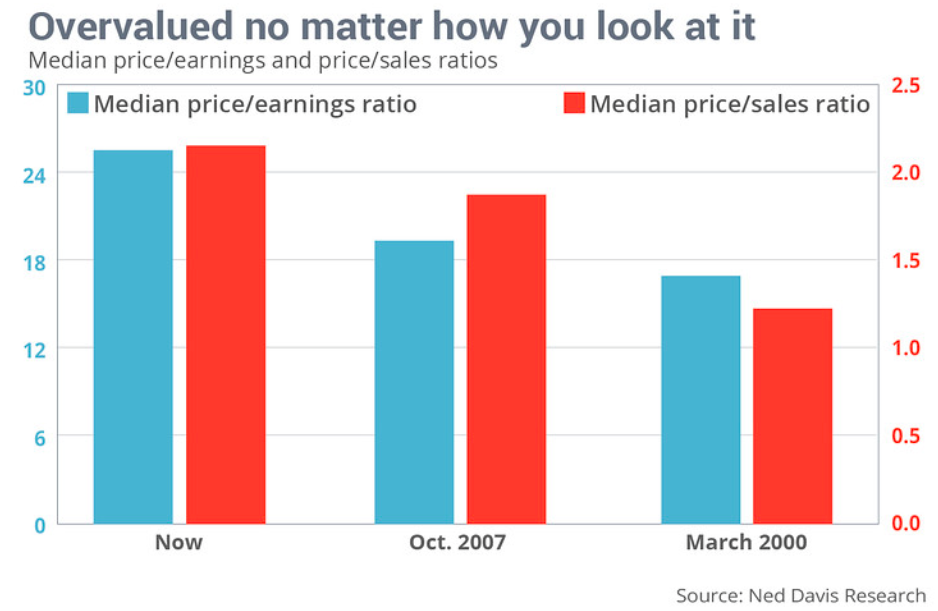
 The first increase in the Fed Fund rate historically has had a significant impact on equity markets, both before and after the event. Since 1955, the Federal Reserve reversed its interest rate policy with an increase in the Fed Fund rate on 12 occasions. Equity investors anticipated a negative response during the six month period prior to the first increase.

-
I know Mike is a very solid investor and respect his opinions very much. So if he says pay attention to this or that - I will.
~ Dale G.
-
I've started managing my own investments so view Michael's site as a one-stop shop from which to get information and perspectives.
~ Dave E.
-
Michael offers easy reading, honest, common sense information that anyone can use in a practical manner.
~ der_al.
-
A sane voice in a scrambled investment world.
~ Ed R.
Inside Edge Pro Contributors

Greg Weldon

Josef Schachter

Tyler Bollhorn

Ryan Irvine

Paul Beattie

Martin Straith

Patrick Ceresna

Mark Leibovit

James Thorne

Victor Adair