
Stocks & Equities
Here is a list of common reasons I use to throw a stock out of consideration:
Also in This Week’s Issue:
– Stockscores’ Market Minutes Video – Overcoming Impatience
– Stockscores Trader Training – Say No to the Trade
– Stock Features of the Week – Downward Trend Reversals

“Don’t ever take a fence down until you know why it was put up.” ~ Robert Frost
We have seen the same song sung over and over again by the Doctors of Doom; the markets are going to crash, the world is going to come to an end, or some other pretentious title. Let’s cut to the chase, the markets are not going to crash; they could experience a strong correction at some future date but that would just present you with another opportunity to buy quality stocks. Could the markets crash? That is a possibility, but you could kick the bucket before the event plays out the way the naysayers have envisioned. In fact, one could go as far as to state that there has never been a real market crash in the true sense of the word and that every so-called crash event was nothing but a buying opportunity in disguise. Crash or correction is a matter of perspective and that perspective depends on where you boarded the train; if you got in towards the end of the ride, then it will certainly feel like a crash. We will examine this concept in more detail in a follow-up article.
Less than two months ago a lot of fuss was made about the death cross formation on the Dow; we immediately repudiated that nonsense and stated the Dow would continue to trend upwards. Fast Forward and the Dow followed the projected course. Now some professors are stating that all is not well with the NYSE and that it is signalling a massive breakdown in the markets. With the advent of Quantitative easing and an ultra low rate environment that has been artificially maintained for an inordinate amount of time, many technical indicators ceased to function normally. As the environment had changed and the Fed had eliminated all semblance of free market forces, the laws of the jungle came into play; adapt or die. It is hot money that is powering this market and it is hot money that will continue to power this market, much to the anguish of the naysayers. The bull market will end one day but that day is not yet upon us. We do not believe that the NYSE Index is signalling impending disaster; at most it is signalling that another correction could be in the works, with extremely strong emphasis on the word “could“.
Let’s take a look at long term chart and see what it’s implying.
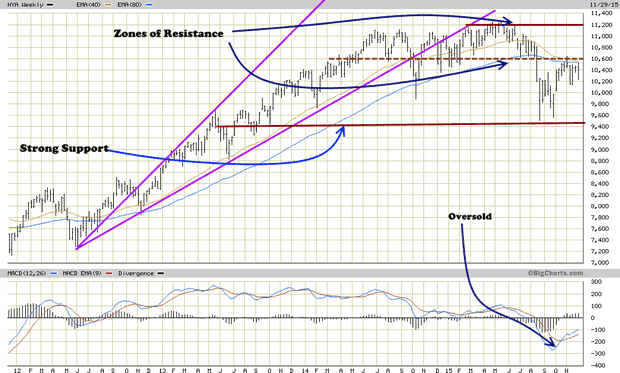
There is a strong layer of support that comes into play in the 9450-9500 ranges. It would take a monthly close below this level to indicate lower prices. Even in the off chance this did occur, the astute investor will view it for what it is and view it as opportunity knocking in disguise. However, don’t place all your eggs in one basket and hope for this target to be hit. For now, it is a low probability target, unless Turkey and Russia suddenly decide to go to war.
The inability of the NYSE to trade above 10,700 on weekly basis, suggests further downside testing and a possible retest of the October lows. The NYSE is building momentum to take out the 11,200 ranges and eventually put in a series of new highs. Overall the expectation is for the NYSE to be trading higher next year.
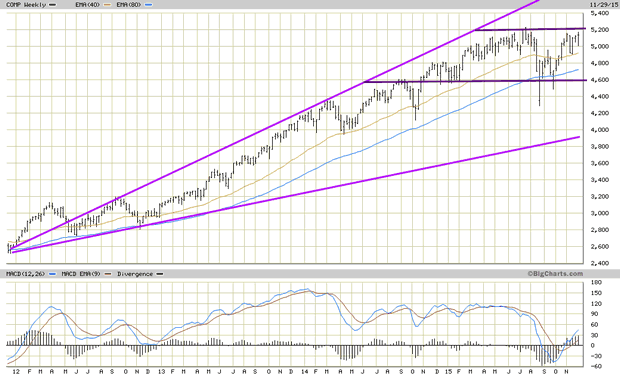
The NASDAQ is already trading well of its lows and is dangerously close to taking out its old highs. As this is the most speculative index out of all the major indices, it suggests that this trend is likely to continue, as there is still a large percentage of individuals sitting on the sideline. Our analysis indicates that there are currently more individuals sitting in the neutral camp than in either the bullish or bearish camps. Neutrality equates to fear, you sit out because you don’t know what to expect and markets love to climb a wall of worry. Despite trading dangerously close to its highs, the MACDS are still trading in the oversold ranges, validating that there is more upside to this market.
In what light should you view the dire warnings coming from the Professors of doom? Dump these warnings of doom into the nearest dustbin and move on. Our game plan is to view every pullback as a buying opportunity. What is your game plan?
“I can stand brute force, but brute reason is quite unbearable. There is something unfair about its use. It is hitting below the intellect.” ~ Oscar Wilde

The US Dollar index has made marginal new highs which I believe will turn out to be a false break top. Let’s take a top down approach beginning with the monthly chart.
US Dollar Index Monthly Chart
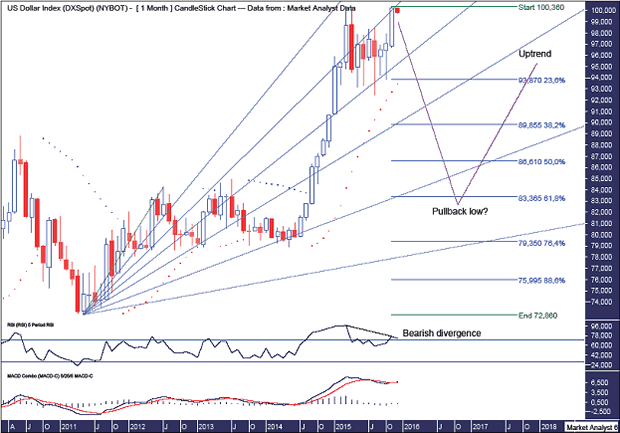
Today price has traded marginally above the November high and I am looking for the month of December to show a bearish outside reversal candle. A tall order one may think given the big bullish November candle. Time will tell.
The PSAR indicator is still bullish with the dots at 93.45. Breaking that level will confirm a multi month correction is at hand.
The Fibonacci Fan shows some nice symmetry with price. The recent low was at support from the 38.2% angle with price rallying back to the 23.6% angle. I expect resistance to come in here and turn price back down.
I have added Fibonacci retracement levels of the recent major move up and I am still targeting price to clip the 61.8% level to put in the final pullback low.
The RSI shows a bearish divergence at this high. After the pullback I expect price to trade to new highs and potentially put in a triple bearish divergence. All in good time.
The MACD indicator is actually marginally bullish but below the recent high. It looks to be waiting for an order on which direction to take next. I favour down.
US Dollar Index Weekly Chart
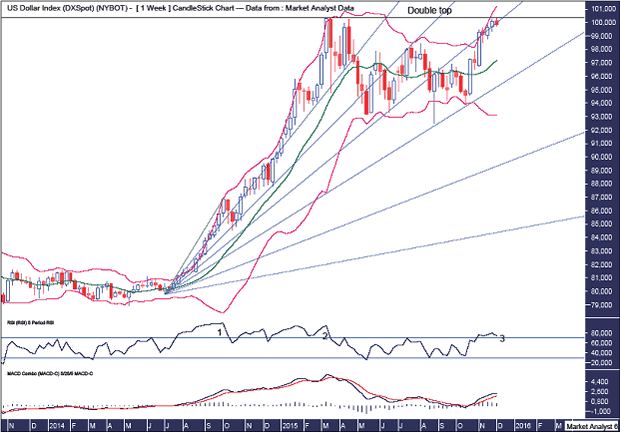
We can see this high, if indeed price does turn down from here, sets up a big double top. This double top is against the trend so after a big reaction down price should then come back up and bust to new highs.
The Bollinger Bands show price bouncing up and down between the bands which is consistent with a consolidation or trend change. I favour the latter.
The Fibonacci Fan shows price making its way through the angles. The most recent low was at support from the 61.8% angle and this last gasp rally looks to be struggling to overcome the 50% angle. If a high forms now then price should trade back down and take out the 61.8% angle in short order.
The RSI shows a triple bearish divergence at this new price high.
The MACD indicator is still bullish but the averages appear to be curling over.
US Dollar Index Daily Chart
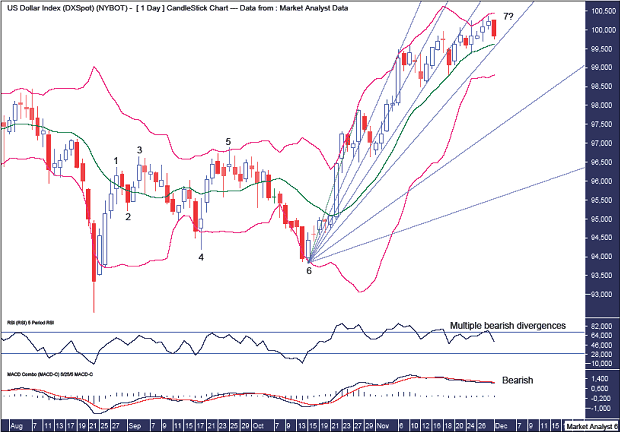
We can see this high is expected to be the final point 7 high in a very bearish 7 point broadening top. Also, as shown in previous analysis, this is also a point 4 and point 5 high in larger formations.
The Bollinger Bands show price crawling higher between the middle and upper bands. If my analysis is correct and a top is at hand then the next move down should be impulsive and see price get back down to the lower band pretty quick smart.
The Fibonacci Fan shows price making its way through the angles and then next support angle is the 61.8% angle with a big drop thereafter to the 76.4%. Might be time to hold on to your hats!
The RSI shows multiple bearish divergences forming at this new price high.
The MACD indicator is bearish with multiple bearish divergences as well.
Summing up, the expectation of a multi month move down remains unchanged and I believe that move to be imminent.

Many people think that they ring a bell at the top of a bull market. Ding-a-ling-a-ling.
That is indeed often the case. The bell was rung in 2000 at the top of the dot-com bubble—I like to think it was 3Com spinning off Palm that broke its back.
But sometimes there is no bell, no catalyst, no story to tell. A bull market becomes a bear market, and it happens just like that.
Silicon Valley has been in a food fight for about three years now. Everyone knows it’s going to end, except for the folks in Silicon Valley. These guys are funny. I met a few of them in the last cycle. They really thought it was going to go on forever.
There are now 145 unicorn companies (private companies with a valuation of $1 billion or more), with a total combined valuation of $506 billion.
We are watching the top happen right before our eyes.
Square
If you were paying attention a couple of weeks ago, you might have read the news about a company called Square going public. Jack Dorsey is the CEO of Square. He is also the CEO of Twitter. I think of this sometimes whenever I complain that I’m too busy.
Square got a round of financing in 2014 at a $6 billion valuation, and now it’s a public company. If you pull up SQ on Yahoo! Finance, you will see that the market cap is $4 billion.
As Square was making the rounds in the roadshow, investors decided they didn’t want to overpay just to make the mezzanine round investors rich. So there wasn’t much demand for Square at a $6 billion market cap. It eventually went public at a $3 billion market cap, or $9/share. (The deal performed well in the aftermarket, at least. The stock is trading at $12.)
No catalyst. No bell ringing. The price simply got too high, and people pulled back. But you know what this means. If one deal can trade below private valuations, they can all trade below private valuations.
On to the next data point…
Fidelity
You may not know this, but Fidelity owns shares of private companies in some of its funds (like Contrafund). Fidelity has to figure out how to value these things.
In general, venture capital firms have to mark their investments to “market,” whatever that means. To do this, they use the services of third party valuation firms. Those valuation guesses are probably subject to mood or opinion, and as you can imagine, there are a lot of bad guesses. The valuations don’t mean much—if you’re an LP (limited partner), at the end of the day, you care about cash in and cash out. But mark-to-market creates some interesting short-term incentives.
As for Fidelity, they also have to mark things to market, and they also use valuation firms. But valuation firm A that Sequoia is using is different than valuation firm B that Fidelity is using. And Fidelity perhaps wants its valuation firm to be more conservative.
So Fidelity has been marking its private investments to market at levels that are below the most recent funding rounds. This puts the VCs in a bit of a pickle. Do they copy Fidelity or do they press on with their own, higher valuations in the face of dissenting opinions?
None of this makes people very bullish on startups.
Uber
Uber is the biggest unicorn of all, with a $50 billion valuation. Side note: they don’t make any money.
Uber is trying to raise another billion—at a $70 billion valuation.
Now, the only reason you would invest in Uber at a $70 billion valuation is if you thought they would go public at $80 billion or more. But looking at what happened to Square, that will almost definitely not happen.
And why would you pay $70 billion for Uber when Fidelity is going to mark it in your mush? Another great question.
I don’t think anyone is in the mood to pay $70 billion for Uber. Uber is stuck. They will have to go public or take a down round if they really need the cash.
And this, folks, is how bear markets start.
Brainstorming Session
So let’s do some brainstorming on what this could mean if it really were the end of the line for Silicon Valley (at least in the medium term).
- Since tech has been going up while energy/mining has been going down, could this trend reverse?
- Could value start to outperform growth? (If I’m not mistaken, it already is.)
- Could large cap start to outperform small cap? (Boy, is it ever.)
- If you lived in the Bay Area, would you want to sell your house and rent?
- As new tech is in the process of topping, have you seen what old tech has been doing? Check out the chart of Microsoft, at 15-year highs:
For full disclosure, I started calling the top (or at least asking hard questions) on Silicon Valley about a year and a half ago. But I think most dedicated observers saw what happened with the Square IPO and said, “Yep, that might be the top.”
The other thing I’ve learned is that even when people recognize the top, they vastly underestimate how bad the pain is going to be on the downside. “Oh, it’ll just be a quick correction.” Never is.
One last riposte: Anyone who invested at these valuations will richly deserve what’s coming to them. Those prices were cuckoo.

Jared Dillian
Jared’s premium investment service, Street Freak, is available now. Click here for our introductory offer. Jared Dillian, former head of ETF Trading at one of the biggest Wall Street firms and author of the highly acclaimed book, Street Freak: Money and Madness at Lehman Brothers, shows you how to pick and trade trends, and master your inner instincts. Learn how to use “Angry Analytics” as a leading indicator of budding trends you can profit from… and how to view any market situation through the lens of a trader. Jared’s keen insight into market psychology combined with an edgy, provocative voice make Street Freak an investment advisory like no other. Follow Jared on Twitter at @dailydirtnap.
Great sentiment charts. So much value in this information. Summary: Overall, fund managers’ asset allocations in September and October indicated the most bearishness since 2012. It was a strong contrarian bullish set up for equities, especially in the US (post).


-
I know Mike is a very solid investor and respect his opinions very much. So if he says pay attention to this or that - I will.
~ Dale G.
-
I've started managing my own investments so view Michael's site as a one-stop shop from which to get information and perspectives.
~ Dave E.
-
Michael offers easy reading, honest, common sense information that anyone can use in a practical manner.
~ der_al.
-
A sane voice in a scrambled investment world.
~ Ed R.
Inside Edge Pro Contributors

Greg Weldon

Josef Schachter

Tyler Bollhorn

Ryan Irvine

Paul Beattie

Martin Straith

Patrick Ceresna

Mark Leibovit

James Thorne

Victor Adair