
Stocks & Equities
Briefly: In our opinion, speculative short positions are favored (with stop-loss at 2,140 and profit target at 1,990, S&P 500 index)
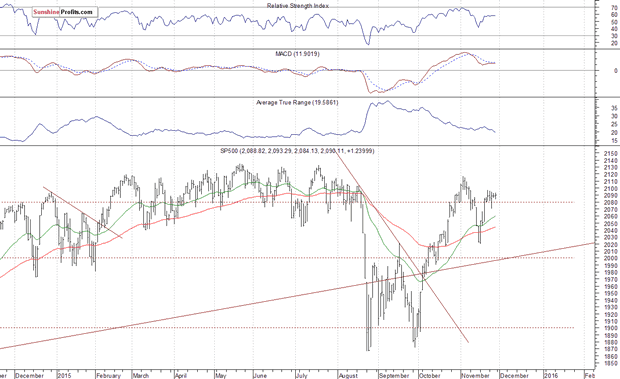
The main U.S. stock market indexes were virtually flat on Friday, as investors had a long holiday weekend. The S&P 500 index continues to fluctuate following recent move up. The nearest important level of resistance is at around 2,100, and the next resistance level is at 2,130, marked by late May all-time high. On the other hand, support level is at 2,070, and the next support level is at 2,020-2,050, marked by previous local lows. For now, it looks like a consolidation following October rally:

 If you look at Bloomberg’s 25 year chart of China’s Shanghai stock market, not only does it dramatically outperform the S&P 500, it crushes it by rising a staggering 35-fold in the last 25 years. Yes, despite China’s latest stock market crash, the Shanghai stock market has still risen a jaw-dropping 3,500 percent in just 25 years (see chart below).
Small cap stocks have really lagged the overall market but are now starting to show some signs of life. With that in mind, I set out to find lower priced stocks that were showing patterns which indicate a turn up from long term weakness. Breaks from a rising bottom after breaking the downward trend is a good sign of a downward trend reversal.
1. SGMO
SGMO broke the downward trend in October and built a rising bottom in November. Late this week it started to turn up from that rising bottom. This pattern has the Sentiment Stockscore rising. Lack of volume a concern but trading was very light in the market overall this week. Support at $7.

Here are the results since the topping of the last cyclical bull, with SPX valuations recently surging up to lofty nosebleed levels. Contrary to Wall Street’s endless claims that the stock markets aren’t expensive today, prevailing valuations are actually way up at dangerous bull-slaying levels. The SPX and therefore US stock markets are trading at topping valuations today, which is a super-bearish omen going forward.
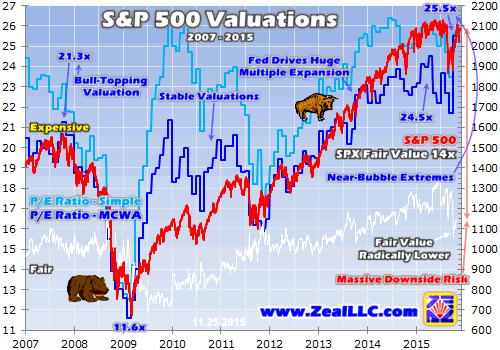
While I’m eager to see November’s valuation data, this month isn’t quite over yet. So our latest SPX valuation data is from the end of October. And that proved pretty ominous, with the market-capitalization-weighted-average price-to-earnings ratio of all 500 SPX component stocks rocketing 17.5% higher on a monthly basis to 25.5x earnings! These elite companies’ simple-average P/E ratio was right in line at 25.6x.

Prove It To Me Market
As we outlined in a November 20 video clip, the “return to the year of the whipsaw” action in the S&P 500 over the last few weeks means we prefer to make the market “prove it” by clearing some overhead guideposts.
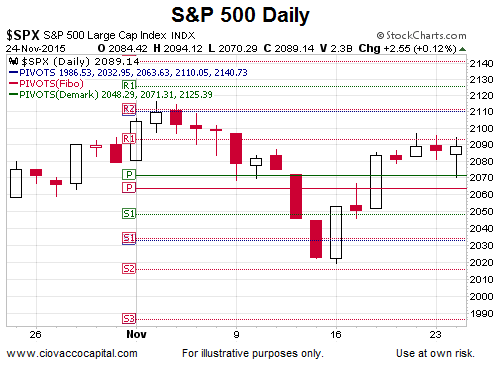
Daily Guidepost
If the S&P 500 is to rally for several months and go on to make significant higher highs, it has to clear and hold above 2093, which is the R1 line shown in the chart below. The S&P 500 closed at 2089 on Tuesday, November 24.
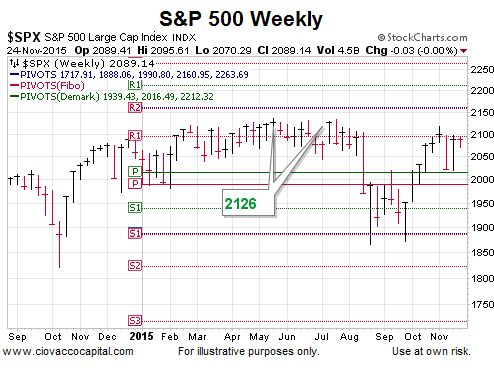
Weekly Guidepost
When areas of possible resistance or signals occur on multiple timeframes they tend to be more useful. The R1 level on the weekly chart of the S&P 500 sits at 2095. The S&P 500 closed at 2089 on Tuesday, November 24.
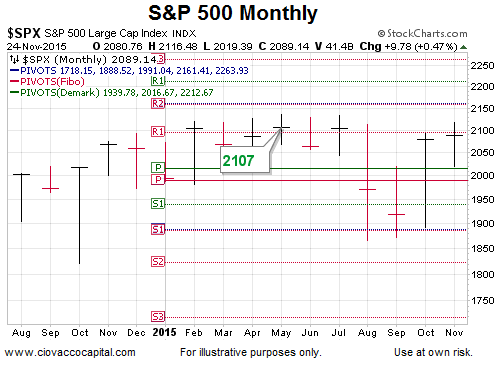
Monthly Guidepost
The possible resistance trifecta is in play with R1 on the monthly S&P 500 chart coming into the picture at 2095. The S&P 500 closed at 2089 on Tuesday, November 24.
How Can This Help Us?
If the S&P 500 closes over 2095, does it mean we have entered bullish utopia? No. A single close or even a handful of closes over 2095 does not necessarily mean resistance has been cleared; there is no magic number of days. If 2095 is cleared and held, the longer the market stays above 2095 and the further it moves above 2095, the more relevant it becomes.

-
I know Mike is a very solid investor and respect his opinions very much. So if he says pay attention to this or that - I will.
~ Dale G.
-
I've started managing my own investments so view Michael's site as a one-stop shop from which to get information and perspectives.
~ Dave E.
-
Michael offers easy reading, honest, common sense information that anyone can use in a practical manner.
~ der_al.
-
A sane voice in a scrambled investment world.
~ Ed R.
Inside Edge Pro Contributors

Greg Weldon

Josef Schachter

Tyler Bollhorn

Ryan Irvine

Paul Beattie

Martin Straith

Patrick Ceresna

Mark Leibovit

James Thorne

Victor Adair