
Stocks & Equities
Trading is Simple (But Not Easy)
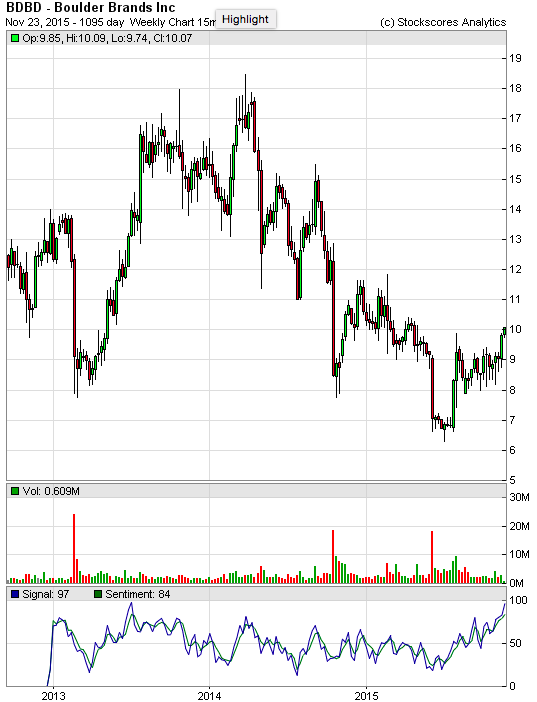
This week, I ran the Stockscores Simple Weekly Market Scan. This strategy looks for stocks breaking from predictive chart patterns on the 3 year weekly chart. It is a great strategy for the longer term trader who only has 15 – 30 minutes a week to dedicate to checking the market. Found one good candidate this week:

 Dollar will likely continue to rise. We Are NOT In a CURRENCY WAR said Faber……


Over the last week we (NFTRH) have used market sentiment indicators and index charts to gauge the prospects of finding a high on the post-September relief ‘bounce’ rally.
During August and September market sentiment had become brutally over bearish and this was very dangerous from the bears’ perspective. We set upside bounce targets for the SPX at 2020, 2040, 2060 and 2100. The first three were resistance levels (broken support) and the last was the general measurement of the ‘W’ bottom that formed in August and September. With the extremes in bearish sentiment, it was not so surprising that SPX climbed all the way to just above 2100.
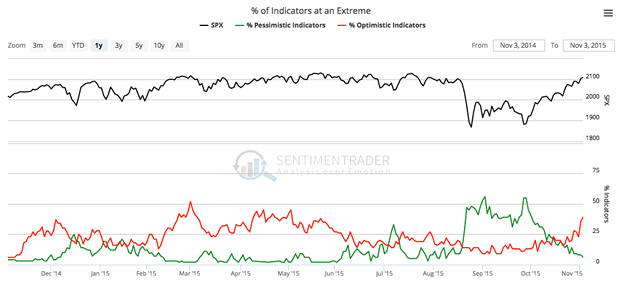
Well, as we have noted in weekly reports and in-week updates recently, that problem for the bears was methodically eliminated by the rally as bulls’ backbones firmed up very well to the point of strenuous (though not hideously extreme) over bullishness. Here is one chart (courtesy Sentimentrader.com) among many sentiment graphics and data points we used in an NFTRH update on November 4. We had been watching pessimism dissipate quite nicely, but now the other component – rapidly growing optimism – was kicking in as well. This would pave the way for a correction from a sentiment standpoint.
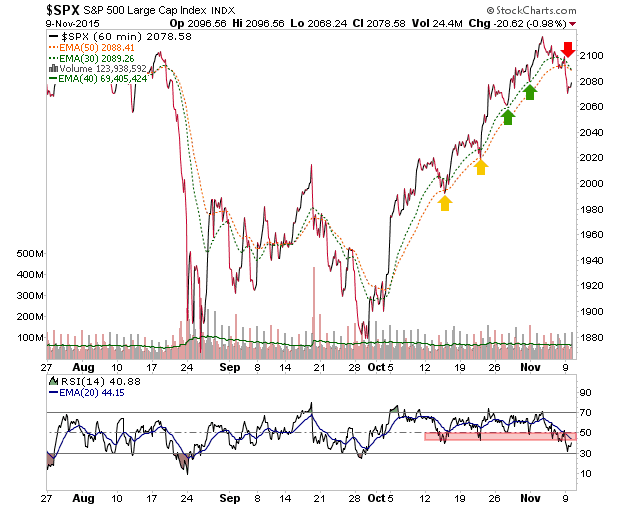
As a ‘look ahead’ we then used and continually updated this 60 minute chart of the SPX beginning with an update called What to Look for w/ Respect to the 1st Signs of a Market Breakdown in order to be prepared to view the very first inkling of what a correction might look like, now that sentiment was coming in line. The ensuing string of updates also included daily charts of SPX for viewing forward-looking support parameters in the event that the market did have an initial breakdown (per the 60 minute view).
The two 60 minute moving averages (EMA 30 & 50) had supported the entire post-September rally and as long as they were intact, there was no bear signal.
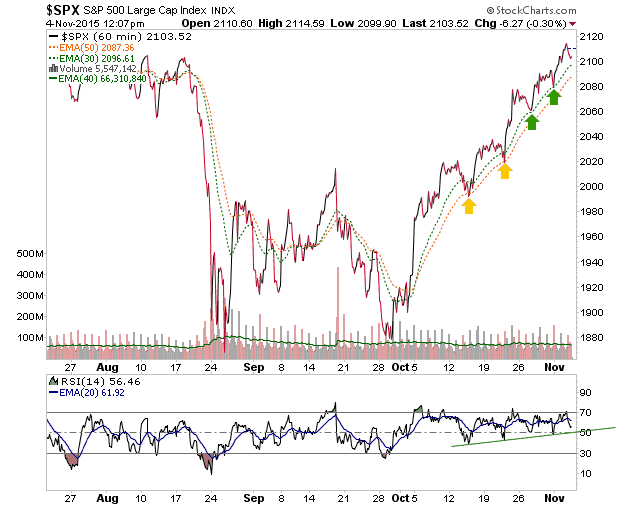
Then two days later it made its initial signal. Here is the chart from another update that went out to subscribers on the spot. We noted that SPX was “on track to begin a reaction, correction or more” as the first moving average gave way and RSI lost support.
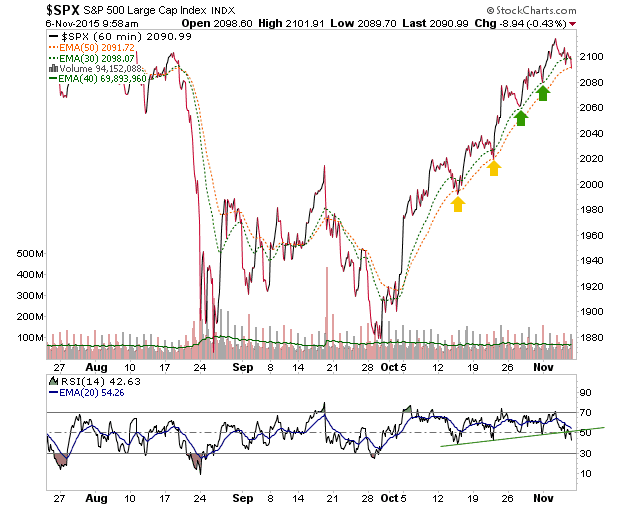
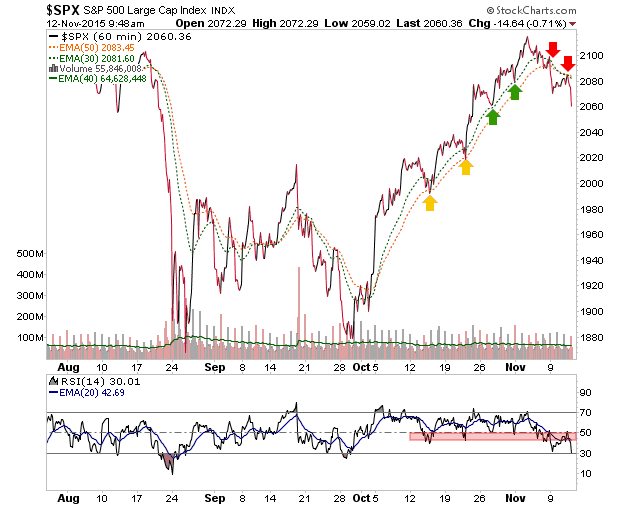
On November 9 the signal got better as the second moving average was pierced and the moving averages turned down. We noted SPX could bounce to test the breakdown.
Sure enough it did… and it failed to negate the damage. Thursday morning we had an update shortly after the open showing the next move down after the bounce failure.
Finally, here is how it looks after the close on Thursday.
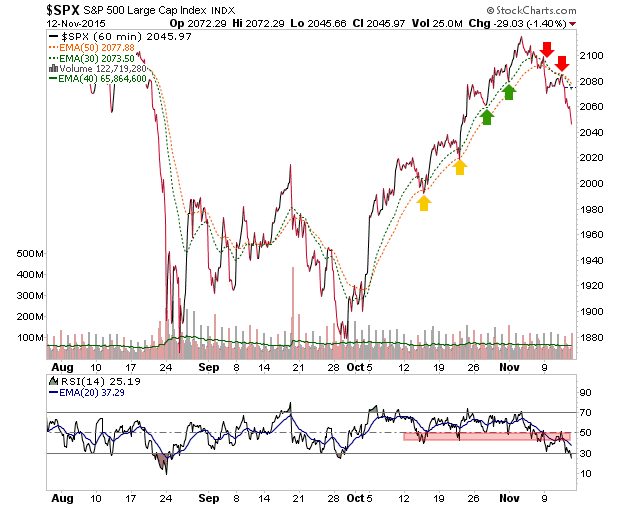
The 60 minute chart’s usefulness has been expressed and now it is on to the daily views for managing the depth of the reaction/correction and if it gets bad enough, the weeklies and monthlies, which will resume guiding the big picture.
Indeed, let’s end the piece by going from one extreme (hourly) to the other (monthly). This chart included in NFTRH 368 kept me in my bearish positions, even though they had been losing me money on paper (but are now very green, I am happy to say). That dome on SPX’s head and the bearish MACD kept me in the game and not out thinking myself. But there is more work to do, because the other more sensitive momentum indicators could well be mimicking 1998 and 2011 as opposed to 2000 and 2008.
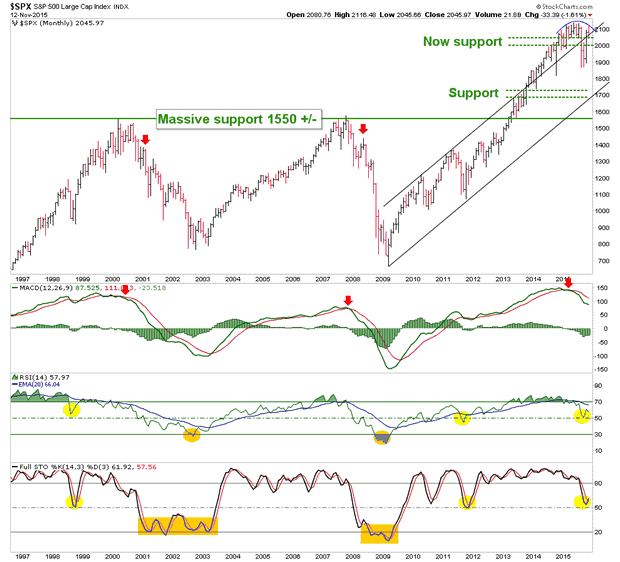
Since the market’s long flat-lining momentum drainage that finally resolved in the August decline, we have successfully gauged and managed every important turn. Down, bottom, bottom re-test, rally and now… the topping of the recovery rally.
I see no reason why people should try to predict how this situation will resolve on the big picture. Ongoing management like the ‘touchy feely’ hourly stuff we did and the daily parameters we are working now are good enough in order to be prepared at any given juncture. Eventually the weeklies and monthlies will make their signals as well. It’s a process folks. Consider joining us before NFTRH’s moderate price increase at year-end.
Subscribe to NFTRH Premium for your 25-35 page weekly report, interim updates and NFTRH+ chart and trade ideas or the free eLetter for an introduction to our work. Or simply keep up to date with plenty of public content at NFTRH.com and Biiwii.com. Also, you can follow via Twitter @BiiwiiNFTRH.

In This Week’s Issue:
– Stockscores Trader Training – November Webinars
– Stockscores’ Market Minutes Video – Weekly Market Analysis
– Stockscores Trader Training – The Money Can’t Matter
– Stock Features of the Week – Weakness Ahead
Stockscores November Webinars
First webinar for November runs this Thursday at 6pm PT (9 ET) with more planned for the following week. Click here to see the schedule and topics.
Stockscores Market Minutes Video – Weekly Market Analysis
See my analysis for the US and Canadian stock markets plus Gold, Oil and the US Dollar. Important developments for the week ahead.Click Here to Watch To get instant updates when I upload a new video, subscribe to the Stockscores Youtube Channel.
Trader Training – The Money Can’t Matter
What are your motivations for trading the stock market? If you are a relatively normal person then it is likely that you trade to make money. However, I have found that trading to make money is dangerous because of the emotional attachment we have to our cash. The
best traders have different motivations.
Consider something as simple as crossing the road. What do you think about when crossing a busy street? Are you solely motivated to achieve the obvious goal of getting to the other side? Not likely. You are probably thinking a lot about getting to the other side without getting run over.
While this seems obviously silly, the correlation that can be made to trading demonstrates an important point. When we focus on money, when we are motivated by greed, we tend to ignore the obvious. If you are trading to make money then a number of psychological problems enter the trading decision.
First, we worry about missing out on an opportunity. We may look at a trade and think that it is not ideal but still “pretty good”. We remember the last “pretty good” trade set up that came along and how it did really well. We remember the pain that we associate with missing out on that pretty good trade set up that we ignored and that motivates us to take this trade, even though it is less than ideal.
Would you cross a busy road if you had a “pretty good” chance of making it without being hit? Would you jump out of an airplane if there was a “pretty good chance” that your parachute would open?
Second, when our trading decisions are motivated solely by money, we tend to work very hard to find something to trade. While a good work ethic is important to be successful in life, working hard to identify opportunities in the stock market is not always good. Doing so means we work hard to find things that are not obvious, and therefore, may not be good enough to even be worth trading. I find that my very best trades are the ones that I don’t have to think twice about, those that jump off my trading screen when the stock is in front of me. I don’t work hard to find them, they find me.
Third, when we trade just to make money we tend to sell our winners too soon. We want to lock in that good feeling of making a profit and don’t want to ever feel the frustration of having a winner turn in to a loser. So, we exit the stock when it feels good or at the first sign that the trade might make us feel bad. This causes us to not ride out the inevitable pull backs along a longer term trend.
Finally, focusing on the money causes us to now manage risk ineffectively. When we think about how much we “could” make if the stock goes up then we might buy a position larger than we are willing to lose. By taking too much risk, we are more likely to not sell our losers when they reach a sell signal or exit our winners too soon because of the fear that the winner will turn in to a loser.
Rather than focus on money when you trade, I want you to focus on being right. Do your analysis on a stock and then ask, “am I right to buy this stock?” “Am I right to short sell this stock?”
Make your trading an intellectual exercise, a challenge to your brain to be right more than you are wrong. Take your focus off of the green and on to the black and white. The easiest way to do this is to only look at the charts and not look at your account’s profit and loss indicator. I strongly believe that if you focus on making the right decision instead of focusing on making money, you will end up making more of it anyway.

The six week upward trend for the market was broken today indicating that there will be some near term profit taking in US stocks. I have found that the best way to take advantage of market weakness is through the VIX related ETFs. Below are the two that I will focus on trading as long as the volatility continues.
1. VXX
VXX is what I play on a day like today (Monday) when there is heavy selling in stocks as it tends to go up when the market goes down. It is based on the implied volatility of the S&P 500 index futures. The more people are worried about a correction, the more protection they buy in the futures market and that raises the implied volatility. i base my trading decisions on the intraday chart rather than the daily which tends to be too slow.

2. XIV
XIV represents the inverse of the VXX, it will go up when the market makes its inevitable bounces in a downward trend. Since a trend rarely goes straight up or down, I like to switch back and forth between this and the VXX as prices gyrate within the trend.

References
- Get the Stockscore on any of over 20,000 North American stocks.
- Background on the theories used by Stockscores.
- Strategies that can help you find new opportunities.
- Scan the market using extensive filter criteria.
- Build a portfolio of stocks and view a slide show of their charts.
- See which sectors are leading the market, and their components.
Disclaimer
This is not an investment advisory, and should not be used to make investment decisions. Information in Stockscores Perspectives is often opinionated and should be considered for information purposes only. No stock exchange anywhere has approved or disapproved of the information contained herein. There is no express or implied solicitation to buy or sell securities. The writers and editors of Perspectives may have positions in the stocks discussed above and may trade in the stocks mentioned. Don’t consider buying or selling any stock without conducting your own due diligence.

-
I know Mike is a very solid investor and respect his opinions very much. So if he says pay attention to this or that - I will.
~ Dale G.
-
I've started managing my own investments so view Michael's site as a one-stop shop from which to get information and perspectives.
~ Dave E.
-
Michael offers easy reading, honest, common sense information that anyone can use in a practical manner.
~ der_al.
-
A sane voice in a scrambled investment world.
~ Ed R.
Inside Edge Pro Contributors

Greg Weldon

Josef Schachter

Tyler Bollhorn

Ryan Irvine

Paul Beattie

Martin Straith

Patrick Ceresna

Mark Leibovit

James Thorne

Victor Adair