
Stocks & Equities
Long-Term Trend
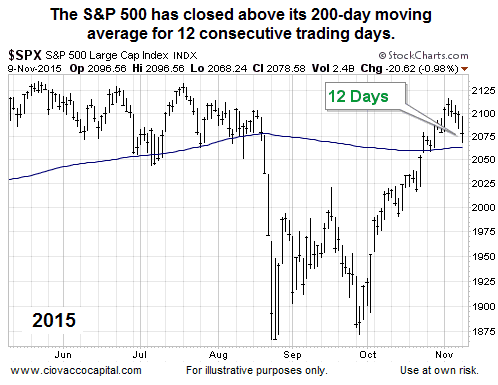
The S&P 500’s 200-day moving average is commonly used to track long-term trends. All things being equal, the stock market bulls prefer the S&P 500 to remain above the 200-day. The bears are more content when price drops and stays below the 200-day. As shown in the 2015 chart below, the S&P 500 has printed twelve consecutive daily closes above its 200-day moving average. From a historical perspective, do rallies typically fail or succeed after twelve consecutive closes above the 200-day?
1990 – The Rally Continued
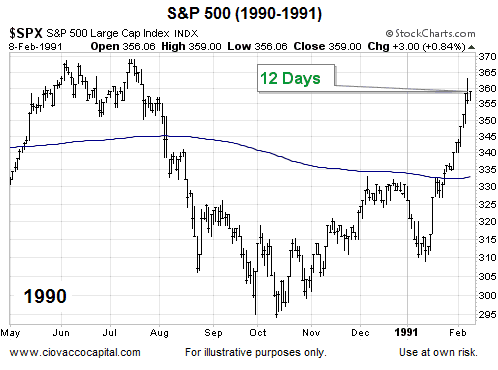
There are not too many historical cases in the last 30 years that featured a significant drop below the 200-day (7% to 19%) followed by a rally back above the 200-day. One case that fits the profile is 1990.
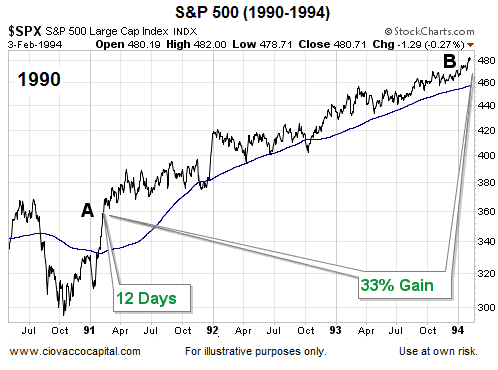
What happened after the twelfth consecutive close? Stocks tacked on an additional 33% between point A and point B.
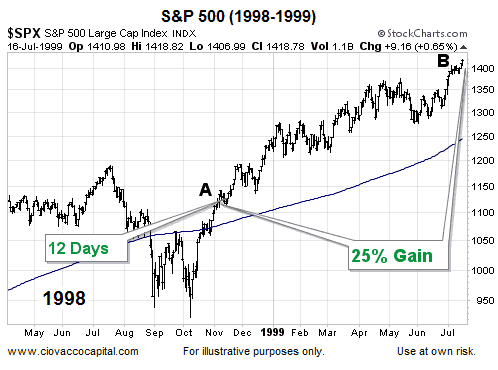
1998 – The Rally Continued
In 1998, the S&P 500 slashed through its 200-day moving average, formed a double bottom, and then rallied back above its 200-day moving average for twelve consecutive sessions, which is similar to what we have seen in 2015.
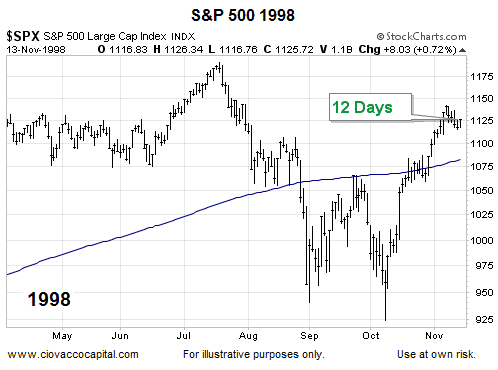
What happened after the twelfth consecutive close in 1998? Stocks tacked on an additional 25% between point A and point B.
Does The Bigger Picture Have Bullish Characteristics?
This week’s stock market video takes a broader look at the market’s risk-reward profile.
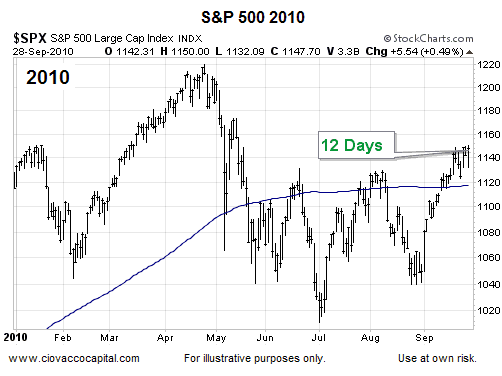
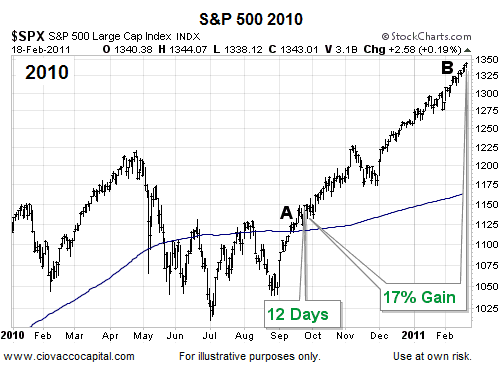
After the 2010 “flash crash” correction, the S&P 500 was unable to post twelve consecutive daily closes above its 200-day moving average until mid-September.
What happened after the twelfth consecutive close in 2010? Stocks tacked on an additional 17% between point A and point B.
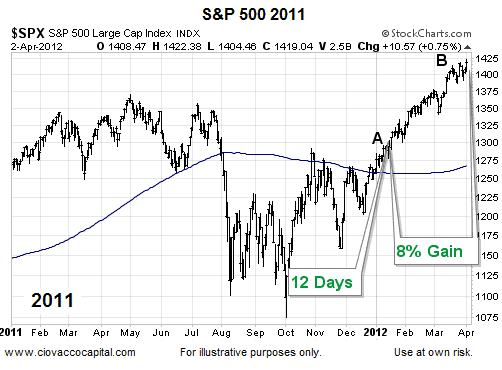
2011 – The Rally Continued
Calendar year 2011 saw numerous events that were similar to 2015; a consolidation period, a sharp plunge, a double bottom, and a rally back above the 200-day moving average. The twelfth consecutive daily close above the 200-day did not occur until early 2012.
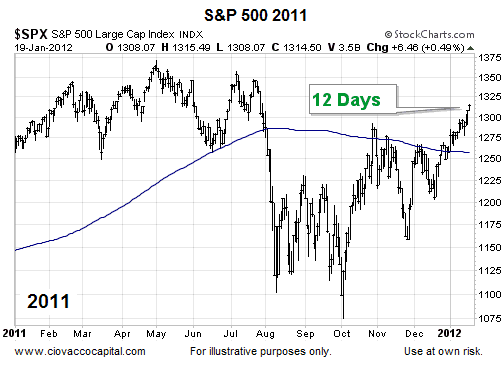
What happened after the twelfth consecutive close in 2012? Stocks tacked on an additional 8% between point A and point B.
How Can We Use This?
Does history tell us what is going to happen in late 2015/early 2016? No, history can only speak to probabilities. In each of the historical cases above, once the S&P 500 posted twelve consecutive daily closes above its 200-day moving average, the rally continued and tacked on significant gains.
What About 1987?
1987 has some similarities and could be included in this analysis. We decided to omit it for two reasons: (1) the S&P 500 stayed below its 200-day moving average for seven months, which is quite a bit different than 2015 (two months), and (2) the negative slope of the 200-day was significantly steeper (more bearish) in 1987.

| Mon. | Tue. | Wed. | Thu. | Fri. | Mon. | Evaluation | |
| Monetary conditions | 0 | 0 | 0 | 0 | 0 | 0 | 0 |
| 5 day RSI S&P 500 | 77 | 79 | 69 | 66 | 75 | 50 | 0 |
| 5 day RSI NASDAQ | 78 | 80 | 79 | 71 | 65 | 39 | 0 |
|
McCl-
lAN OSC.
|
+103 | +103 | +52 | +31 | -18 | -114 |
+
|
| Composite Gauge | 5 | 8 | 12 | 11 | 10 | 15 | + |
| Comp. Gauge, 5 day m.a. | 9.0 | 8.0 | 9.6 | 9.6 | 9.2 | 11.2 | 0 |
| CBOE Put Call Ratio | .90 | .95 | .99 | 1.05 | 1.02 | 1.11 |
+
|
| VIX | 14.15 | 14.54 | 15.51 | 15.05 | 14.33 | 16.52 | 0 |
| VIX % change | -6 | +3 | +7 | -3 | -5 | +15 | + |
| VIX % change 5 day m.a. | -1.40 | -1.0 | +1.8 | +0.8 | -0.8 | +3.4 | + |
| Adv – Dec 3 day m.a. | +458 | +857 | +575 | -89 | -506 | -915 | + |
| Supply Demand 5 day m.a. | .64 | 65 | .51 | .48 | .65 | .54 | 0 |
| Trading Index (TRIN) | .78 | .67 | 1.70 | 1.13 | .72 | 1.21 |
0
|
|
S&P 500
|
2104 | 2110 | 2102 | 2100 | 2100 | 2079 | Plurality+6 |
 “Stanley Druckenmiller doesn’t think the Federal Reserve’s experiment of keeping interest rates near 0% to spur economic growth will end well.”
“all you do” when keeping interest rates at 0% for this long is “pulling demand forward today.” “This is not some permanent boost you get — you’re borrowing from the future”

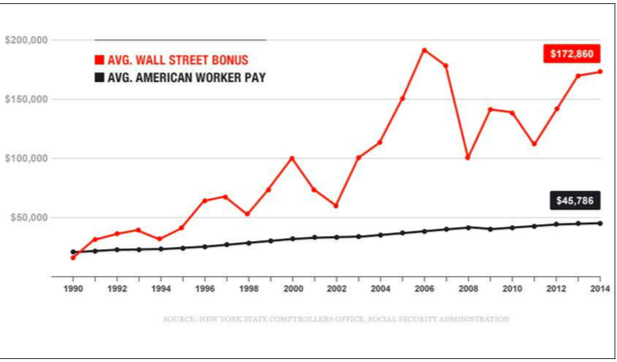
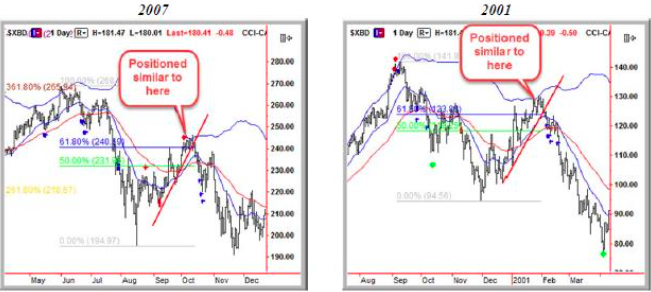
The Broker-Dealer Index (XBD) is where the wonders of financial engineering take place. When the sector is soaring, bonuses have been outstanding. When it is in a distinctive decline bonuses get whacked. Recent chart action is similar to the key rebound and reversal in October 2007 and in February 2001.
Both were followed by serious financial contractions. In December 2007, the establishment boasted that because of the “Dream Team” of economists at the Fed – nothing could go wrong. Eventually, the same establishment described the contraction following the 2007 Bubble as the “worst calamity since the 1930s”.
Needless to say, but Wall Street bonuses going into that Christmas were severely reduced. In 2001 the Bonus Pool plunged by 48 percent and in 2007 it was 49 percent. Porsches and Ferraris were sold, not bought. Through open-ended student loans, students and teachers remained aloof from reality. Staff at the New York Fed grew from 271 in 2005 to 514 in 2013, the latest report.
XBD

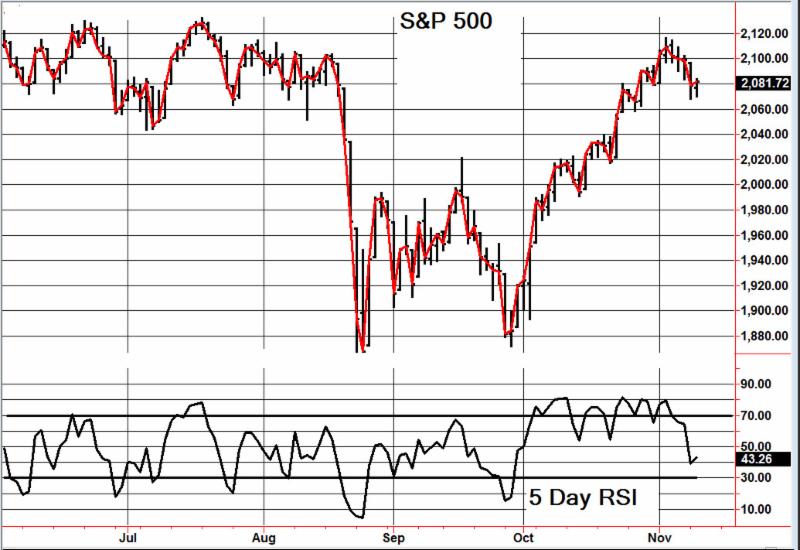
The rally out of the August hit has clocked an outstanding swing in the Daily RSI. Similar to the one in August-October 2007. This covers momentum and this week’s action has registered a Sequential (13) Sell. This is pattern and the index should soon roll over.

Two points on a short of S&P 500 here:
-
We know the risk and it isn’t far away…new highs
-
The Fed will now likely raise interest rates—the market loses some juice at the margin..
Take a look….

Regards,
Jack
Black Swan Capital’s Black Swan Forex is strictly an informational publication and does not provide personalized or individualized investment or trading advice. Commodity futures and forex trading involves substantial risk of loss and may not be suitable for you. The money you allocate to futures or forex trading should be money that you can afford to lose. www.blackswantrading.com

-
I know Mike is a very solid investor and respect his opinions very much. So if he says pay attention to this or that - I will.
~ Dale G.
-
I've started managing my own investments so view Michael's site as a one-stop shop from which to get information and perspectives.
~ Dave E.
-
Michael offers easy reading, honest, common sense information that anyone can use in a practical manner.
~ der_al.
-
A sane voice in a scrambled investment world.
~ Ed R.
Inside Edge Pro Contributors

Greg Weldon

Josef Schachter

Tyler Bollhorn

Ryan Irvine

Paul Beattie

Martin Straith

Patrick Ceresna

Mark Leibovit

James Thorne

Victor Adair