
Stocks & Equities
 Being ignorant is not so much a shame as being unwilling to learn.
Benjamin Franklin
Fear sells, and like misery it demands company. The so-called crash in August triggered dozens of hibernating bears to emerge from the woodwork. Rested from the last severe beating they took, they are ready for another healthy dose of pain. In their quest to push the fear factor a notch higher, celebrity perma-bears such as David Tice are brought out confirm that all is not well. If the markets were destined to sink into the gutter, David Tice would not have sold his Prudent Bear fund at the peak of the 2008-2009 financial crisis. Then you have many others taking out expensive ads calling for the end of the world. A close look will reveal that these same chaps were bullish once an upon a time and have now jumped ship. Then you will have those who came out when the markets were pulling back, 2003 and 2008 come to mind. On each occasion, these chaps were right for a brief period. The better option would have been to open long positions in top companies and let your profits soar. Something so simple, is not easy to sell, so the spin doctors to sensationalize the event. If you something sounds too bad to be true, then it probably is and vice versa.
Even though the markets pulled very strongly in August, these fear mongers are still pushing the same old theme. Avoid these individuals like the plague. From a contrarian perspective, the only role they play is to inform you of what you should not be doing. We find it quite amusing that even though the markets have virtually recouped all their losses, these guys keep stating that a crash is in the works.
A recent report illustrated that roughly 90% of all articles published in the Washington post have a negative connotation. With the election cycle underway and as the candidates jockey for the head position of Jackass, the airwaves will be blasted with even more negativity. Negativity attracts even more negativity; expect every negative story to be blown out of contextwhile positive events will be marginalized. As far as we are concerned, this is a great development, for negativity is a precursor to panic and panic is the precursor to opportunity.
We believe the markets will trend upwards for the following reasons:
- Markets do not top off without Fed intervention. While the Fed has been hinting forever that they are going to raise rates, so far they have done nothing. Even if they do muster the courage to raise it by a paltry 0.25%, it will be treated as a non-event. History illustrates that markets trend upwards, for more than two years after the Fed’s start hiking rates.
- Our trend indicator is bullish, we have never seen a market crash when this indicator is bullish. This indicator blends technical analysis with Psychological indicators and has not flashed any signs that a bear market is about to emerge.
- The crowd has to be euphoric and currently the sentiment is not even close to Euphoric. The crowd is far from Euphoric at present. In fact, the number of individuals sitting in the bullish camp and the neutral camp are dangerously close. Clearly, a lot of individuals are still sitting on the sidelines; this is one of the most hated bull markets in history.
- In case you missed it, the stock market just emerged from a strong correction. From peak to low, the Dow shed over 14%. Hence, speculative forces were purged, and the markets are ready to trend upwards.
- Markets also tend to top due to overvaluation and a hawkish Fed. Both of these factors are a non-issue. While the markets are not cheap, they are certainly not overvalued. When the markets collapsed in 2000, valuations were absurd, we are nowhere next to those levels right now.
- In this ultra low rate environment, speculators are rewarded, and savers are punished. There are not too many choices out there for investors. You can park your money in 10-year treasuries and walk away with a paltry 2.23%, or you could put that money into many blue chip stocks that yield over 2% and offer you the option of walking away with capital gains. In fact, we warned our subscribers in July before the markets collapsed to view all strong pullbacks as buying opportunities. Those that used the correction to open new positions are already holding onto gains more than 10% and some cases as much as 30%.
- Corporations are plowing enormous amounts of money into share buybacks. In fact, it is estimated that stock buybacks and dividend payments could top $1 trillion for the first time. Additionally a slew of corporations that have not purchased their shares over the past few years are joining the share buyback bandwagon.
- At the Tactical Investor Mass Psychology plays a central role in all our analysis. From where we stand, sentiment levels are going to take some time to hit the euphoric stage. This market has a lot more room to run. This market will run a lot higher than even the most zealous bear could ever dream off. Every strong pullback should be viewed through a bullish lens; the stronger the pull back, the more willing you should be to jump in.
What’s next for the Dow Industrials?
The markets have covered a lot of ground over a very short period of time. Thus, we feel that it’s time for another bloodletting stage. Ideally the Dow would come close to testing its lows again, and put in a higher low. This will set the stage for a nice strong year-end rally, that should continue well into the first quarter.
Markets climb a wall of worry and plunge down an abyss of joy. As masses are far from joyful, treat every strong pullback as a buying opportunity.
He was so learned that he could name a horse in nine languages; so ignorant that he bought a cow to ride on.
Benjamin Franklin

 Some markets are still strong, but the bulk is no longer moving up.
“The Fed has basically created with their colleagues in Japan and at the European Central Bank (ECB) and the Bank of England (BOE), they’ve created a colossal asset bubble. And the returns going forward will be disappointing,” said Faber. “The composition of an index is that it’s usually capitalization weighted. So one stock that goes up vertically could theoretically drive up an index and 99 percent of the shares don’t make new highs.”“Some markets are still strong, but the bulk is no longer moving up so the advance of asset price inflation has been narrowing significantly,” Faber said.
also:
Dr Doom Calls Bubble, adding to Gloomy Calls
The Federal Reserve has inflated an asset bubble and that`s going to damp market returns, perma-bear Marc Faber, publisher of The Gloom, Boom and Doom Report, told CNBC Tuesday. “Say you`re a young person and you`re just starting to work. So take me in the 1970s. In the US, with 20 hours of work, I could buy the SandP 500. Now you need more than 90 hours of work to buy the SandP 500 if you`re young, with a medium income,” Faber told CNBC in an interview. “The Fed has basically created with their colleagues in Japan and at the European Central Bank (ECB) and the Bank of England (BOE), they`ve created a colossal asset bubble. And the returns going forward will be disappointing.”
related:
Faber: Markets Are Manipulated by Clowns in Central Banks
In the September 10 column entitled, “The bear makes a welcome return”, we discussed the return of the infamous bear image on the front cover of several news magazines and newspapers. The most conspicuous example of the bear could be seen on the front cover of Businessweek magazine, shown below.

From a contrarian’s perspective, this was a most welcome return for it strongly suggested that the bottom would soon be in for the stock market after the August decline. As I observed, “From a contrarian standpoint it doesn’t get any more emphatic than this.” Since then the major indices have rallied off their lows with some even making token new highs (e.g. the NASDAQ 100). I’ve never heard of a manifestation of the bear cover indicator failing to mark a decisive market bottom, and this time proved no exception.
Now that the Dow Industrials and the S&P 500 index have rallied back to the February-July resistance zones, should we expect a resumption of the selling pressure that plagued the market this summer? Or should we rather expect a period of consolidation (i.e. backing and filling) and eventually a breakout to new highs? As always, the answer to that question will be answered by the market itself but the current weight of evidence does provide us a meaningful clue as to the most likely outcome.
Before we look at the evidence, it’s worth making an observation about the previous sell-off. What happened to the stock market over the three days between August 20-24 qualified as a classic selling panic, as opposed to a fundamentally-driven crash or credit episode. This distinction is important, for if true it will make the difference between entering a bear market in 2016 and continuing with the bull market that began over six years ago.
A market panic is catalyzed by an adverse and extreme reaction to a news event. In the August sell-off it was the currency devaluation in China that panicked investors into selling. One thing that history consistently has shown is that true selling panics are usually retraced in short order once the fear subsides, i.e. usually within a couple of months. The less time it takes for the major indices to recover their losses, the less likely the selling was fundamentally driven. Hence, a true selling panic isn’t typically the precursor of an imminent bear market.
It’s also worth noting that the market’s present internal condition is virtually in complete contrast to what it was earlier this summer heading into the August panic. Prior to the summer swoon, the market’s extremely weak breadth could be seen on a daily basis for weeks on end. From June onward the number of NYSE stocks making new 52-week lows each day was extremely elevated and showed that the market wasn’t internally healthy. Moreover, this showed up in the NYSE internal momentum indicators (which are based on the new 52-week highs and lows). Most of those indicators were in decline as I mentioned earlier this summer.
Since the August bottom, the situation has reversed. The number of new 52-week lows has been drying up since September and have numbered less than 40 for most days since Oct. 5. The NYSE internal momentum indicators are now mostly in a rising pattern as opposed to the declining pattern before the August crash. Below is a chart showing the six major component of the Hi-Lo Momentum (HILMO) index. Only the longer-term component (orange line) is still in decline; the others are either rising or bottoming, in the case of the dominant interim indicator (blue line at bottom).

These indicators are very important because they show the stock market’s near-term path of least resistance. There is at least one fly still in the ointment, namely the longer-term internal momentum indicator which is still declining, as already mentioned. But all the other indicators – short-term and intermediate-term – are rising. This implies that the bulls currently have the advantage and that the heavy internal selling pressure which characterized the stock market this spring and summer is not an issue right now. This doesn’t preclude another (potentially sharp) pullback between now and year’s end, but the market’s main uptrend should remain intact.
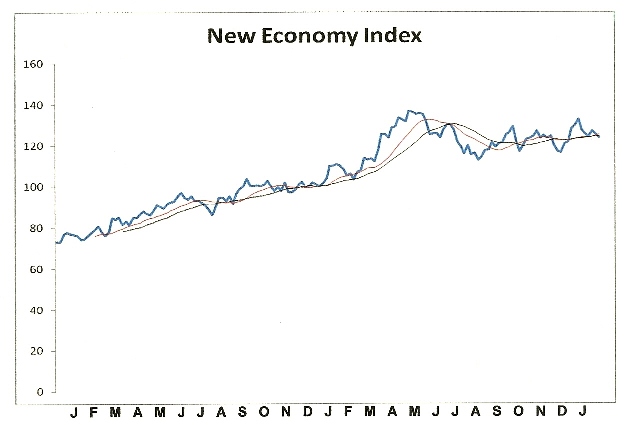
Also worth mentioning is that the New Economy Index (NEI), our in-house measure of how strong or weak U.S. retail spending is, hit a new all-time high last Friday, Oct. 30. Although business owners remain worried over growth prospects, mainly because of overseas woes, consumers don’t seem the least bit concerned. They just keep spending as the NEI chart suggests (below). What’s more, we’re about to enter the critical holiday season when retail sales typically hit their highest levels.
After a major decline in the stock market it always pays to monitor the sectors and industry groups for signs of relative strength. When, for example, the Dow Jones Industrial Average makes a series of lower lows during the final stage of a decline and certain individual stocks make higher lows, that’s a tip-off that informed buying is likely taking place. When the market turns up again and these individual stocks continue leading the market, that confirms it. At the bottom of the August panic, the industry groups which showed the greatest resilience to the decline were water, defense, and broadline retail stocks along with toy companies.
Among Dow Jones industries currently showing exceptional relative strength are: Broadline Retailers (DJUSRB), Business Training and Employment (DJUSBE), Consumer Finance (DJUSSF), Defense (DJUSDN), Leisure Goods (DJUSLE), Restaurants and Bars (DJUSRU), Software (DJUSSW), Toys (DJUSTY), and Water (DJUSWU). This group of industry leaders is very much in keeping with the bullish consumer spending patterns we’ve seen reflected in the New Economy Index lately.

There are, however, some industries that are conspicuous laggards which are close to their yearly lows. If these industry groups don’t improve soon it could pose a problem at some point in 2016. Not surprisingly, most of them are commodity and industry related and were heavily impacted by this year’s global economic slowdown. They aren’t likely to a pose a problem for the balance of 2015, however, especially if they remain within their 2-month holding patterns. They include: Aluminum (DJUSAL), Coal (DJUSCL), Healthcare Providers (DJUSHP), Mortgage Finance (DJUSMF), Pipelines (DJUSPL), Steel (DJUSST), Railroads (DJUSRR), and Recreational Products (DJUSRP).
If commodities can establish a bottom in the next couple of months, particularly crude oil, then the global economic woes of 2015 are far less likely to be of concern to the U.S. in 2016. Moreover, if the stimulus measures of the ECB and China continue the global economic slide will likely be halted next year.
Mastering Moving Averages
The moving average is one of the most versatile of all trading tools and should be a part of every investor’s arsenal. Far more than a simple trend line, it’s also a dynamic momentum indicator as well as a means of identifying support and resistance across variable time frames. It can also be used in place of an overbought/oversold oscillator when used in relationship to the price of the stock or ETF you’re trading in.
In my latest book, Mastering Moving Averages, I remove the mystique behind stock and ETF trading and reveal a simple and reliable system that allows retail traders to profit from both up and down moves in the market. The trading techniques discussed in the book have been carefully calibrated to match today’s fast-moving and sometimes volatile market envipolment. If you’re interested in moving average trading techniques, you’ll want to read this book.
Order today and receive an autographed copy along with a copy of the book, The Best Strategies for Momentum Traders. Your order also includes a FREE 1-month trial subscription to the Momentum Strategies Report newsletter:
http://www.clifdroke.com/books/masteringma.html
Clif Droke is a recognized authority on moving averages and internal momentum. He is the editor of the Momentum Strategies Report newsletter, published since 1997. He has also authored numerous books covering the fields of economics and financial market analysis. His latest book is Mastering Moving Averages. For more information visit www.clifdroke.com

I’ve often emphasized that market peaks are not an event, but a process. One of the elements of that process, as I observed approaching the 2000 and 2007 peaks, and again during the extended range-bound period of recent quarters, is that deterioration in broad market internals — particularly following an extended period of overvalued, overbought, overbullish conditions — is a sign of increasing risk-aversion that typically precedes more extensive losses in the capitalization-weighted averages.
Following an abrupt air pocket in the market during August, the capitalization-weighted indices enjoyed a strong rebound in October. Equal-weighted indices have strikingly lagged that rebound. Our own measures of market internals remain unfavorable, and trading volume has been persistently weak, suggesting that the rebound may be more reflective of short-covering than a resumption of the insistent yield-seeking speculation observed prior to mid-2014. Moreover, with the S&P 500 now within a couple of percent of its May record high, only 38% of individual stocks are above their own respective 200-day moving averages. Even among stocks that comprise the S&P 500 index itself, the majority remain below their own 200-day averages.
Historically, when the stock market has deteriorated internally following a recent period of overvalued, overbought, overbullish conditions, we know that market outcomes have been negative on average. But what if the S&P 500 Index falls below its 200-day moving average, and then recovers above it again? Doesn’t that recovery signal a resumption of the bull market? The answer largely depends on market internals.
If market internals recruit a great deal of uniformity across individual stocks, industries, sectors, and other risk-sensitive securities, then one has to infer that investors have recovered their willingness to speculate. That alone should at least shift the outlook to neutral, and — regardless of the level of market overvaluation — at least defer any immediate expectation of steep market losses, even if the risk of such losses remains.
On the other hand, if the recovery of cap-weighted indices like the S&P 500 is not confirmed by uniformity across a broad range of other securities, the historical evidence is that investors have generally been facing the last gasp of a bull market. The chart below should offer some perspective in that regard.

The difficult feature of the interim, at least for hedged equity strategies, is that as the “troops” diverge from the
“generals,” portfolios that aren’t comprised of the largest and most speculative stocks of the preceding bull market often underperform the indices during top formations. The same was true in the approach to the 2000 and 2007 peaks. If one is long a broadly diversified portfolio of stocks and hedged with a short position in the major indices, the result is a net portfolio loss — and that can feel excruciating if the major indices are advancing at the same time. All of that tends to reverse itself once the cap-weighted averages break down, or once market internals improve enough to suggest fresh risk-seeking among investors (though that sort of recovery is not typical at extreme valuations). In either event, the interim can be uncomfortable.
Emphatically, we can’t rule out the possibility that market internals could improve and support a more neutral or modestly constructive outlook. We also can’t rule out the possibility that this same process of breakdown and recovery could be completed more than once, as it was during the 2000 top formation. But without even a clear improvement in market internals, my impression is that this continues to be an outstanding opportunity for investors to at least rebalance their portfolios to align with their investment horizon and risk tolerance.
Equities are essentially 50-year duration investments at current valuations, and even if investors are passive and don’t hold any view about future market returns at all, one of the basic principles of financial planning is to align the duration of ones assets with the expected horizon over which the funds are expected to be spent. A 40% allocation to equities contributes 20 years to portfolio duration. My sense is that many investors presently carry heavy equity allocations that are wholly inappropriate in relation to their investment horizons. For investors who take a full-cycle approach rather than a passive one, a more defensive stance is appropriate. We associate current conditions with negative average expected returns, coupled with risk that is highly skewed to the downside.
While we can’t be certain of a market peak until well after the fact, the sequence we observe here is all too familiar. I detailed this transition in real-time during the two prior valuation bubbles of the past 15 years. Despite the most extreme market valuations in history, I wrote in August 2000 “as long as trend uniformity remains modestly constructive, we have to view the market as being in an extended top formation. Historically, market crashes have emerged only after trend conditions have deteriorated measurably, and that will require renewed weakness in market internals. The prospective return from a bullish position is unlikely to justify the risk, so hedging is appropriate.”
A few months later, in October 2000, I wrote “Historically, when trend uniformity has been positive, stocks have generally ignored overvaluation, no matter how extreme. When the market loses that uniformity, valuations often matter suddenly and with a vengeance. This is a lesson best learned before a crash rather than after one… On Friday September 1st, the S&P 500 rallied to a peak of 1520.77, capping a string of strong advances. Yet due to a deterioration of market action in a number of economically sensitive groups, our price trend model indicated that trend uniformity had shifted to an unfavorable condition, and we moved to defend our portfolios more fully against downside risk.”
That September 1, 2000 peak turned out, in hindsight, to be the final high of the bull market on a total return basis. The stock market followed by losing half of its value. The Nasdaq 100 — comprising the largest and most speculative stocks of the preceding bull market run — collapsed by 83%. It seems remarkable how easily investors forget how market cycles have historically ended. Even a run-of-the-mill bear market decline wipes out more than half of the preceding bull market gains.
Likewise, in July 2007, during the peaking process that preceded the 55% market plunge of the global financial crisis, I wrote:
“One of the best indications of the speculative willingness of investors is the ‘uniformity’ of positive market action across a broad range of internals. Probably the most important aspect of last week’s decline was the decisive negative shift in these measures. Since early October of last year, I have at least generally been able to say in these weekly comments that ‘market action is favorable on the basis of price trends and other market internals.’ Now, it also happens that once the market reaches overvalued, overbought and overbullish conditions, stocks have historically lagged Treasury bills, on average, even when those internals have been positive (a fact which kept us hedged). Still, the favorable market internals did tell us that investors were still willing to speculate, however abruptly that willingness might end. Evidently, it just ended, and the reversal is broad-based.”
Put simply, the central features of valuations and market action we observe today closely mirror what we observed, and warned of in real-time, at the 2000 and 2007 peaks. It stands repeating that our difficulty in the advancing half of the present market cycle was the inadvertent result of my 2009 insistence on stress-testing our methods against Depression-era data, after a market collapse that we fully anticipated. I’ve regularly detailed that narrative, along with the adaptations we introduced in mid-2014 to address those inadvertent challenges (see for example, A Better Lesson Than “This Time is Different”).
Ignore all of this if you like, but we are convinced that this is how financial markets work. Valuations are the primary driver of long-term returns, and the risk-preferences of investors — as conveyed by the uniformity or divergence of market action across a broad range of individual stocks, industries, sectors and security types (including credit) — drive returns over shorter portions of the market cycle.
At present, the valuation measures we find most strongly correlated with actual subsequent S&P 500 total returns suggest zero total returns for the S&P 500 over the coming 10 years, and total returns averaging only about 1% annually over the coming 12-year period. After inflation, we estimate negative prospective real returns on both horizons. Over shorter horizons, market internals, and the investor risk-preferences they convey, are the hinge that determines how stocks are likely to respond to a broad range of other factors, including valuations, interest rates, Fed action, and economic activity.
The combination of extreme valuations on historically reliable measures, the deterioration of market internals following an extended period of overvalued, overbought, overbullish conditions, and the weakening of leading economic measures, particularly on measures of new orders and order backlogs, has clear precedents historically, and those precedents are uniformly bad. The interim is uncomfortable for hedged equity strategies because internals typically break down before the capitalization-weighted indices do, but that too is a familiar feature of topping processes.
Importantly, and emphatically — if market internals improve, our near-term outlook will immediately shift to a much more neutral stance. Absent a clear retreat in valuations, we don’t see the likelihood of market conditions justifying a shift to a materially bullish outlook, but the immediacy of our downside concerns would be significantly eased were market internals to improve. We’ll respond to changes in market conditions as they emerge.
The foregoing comments represent the general investment analysis and economic views of the Advisor, and are provided solely for the purpose of information, instruction and discourse. Please see periodic remarks on the Fund Notes and Commentary page for discussion relating specifically to the Hussman Funds and the investment positions of the Funds.
—
Prospectuses for the Hussman Strategic Growth Fund, the Hussman Strategic Total Return Fund, the Hussman Strategic International Fund, and the Hussman Strategic Dividend Value Fund, as well as Fund reports and other information, are available by clicking “The Funds” menu button from any page of this website.
Estimates of prospective return and risk for equities, bonds, and other financial markets are forward-looking statements based the analysis and reasonable beliefs of Hussman Strategic Advisors. They are not a guarantee of future performance, and are not indicative of the prospective returns of any of the Hussman Funds. Actual returns may differ substantially from the estimates provided. Estimates of prospective long-term returns for the S&P 500 reflect our standard valuation methodology, focusing on the relationship between current market prices and earnings, dividends and other fundamentals, adjusted for variability over the economic cycle (see for example Investment, Speculation, Valuation, and Tinker Bell, The Likely Range of Market Returns in the Coming Decade and Valuing the S&P 500 Using Forward Operating Earnings ).
Read the entire StockScores Perspective Newsletter titled Opening Hour Research
STRATEGY OF THE WEEK
Today I ran a Market Scan with the following settings:
- Exchange = All Canadian
- Gain/Loss > 1%
- Number of Trades > 1000
- Candle = Bullish Candle
My aim was to look at the stocks that were moving higher on the TSX today so I could then judge the chart pattern. I want to see a break through resistance from a rising bottom, which is a show of optimism.
What stood out today was that there was a lot of stocks from the Energy sector making a move higher, breaking pull backs from a rising bottom. This is a good short term trade signal for these stocks. Keep in mind that the Energy sector is still in a long term Bearish trend so these trade ideas are only for short term moves at this point.
STOCKS THAT MEET THAT FEATURED STRATEGY
1. T.PWT
T.PWT is making a nice break higher from a rising bottom today. Support at $1.40.

2. 2. 2. T.TOG
T.TOG pulled back to its short term upward trend line and bounced off of it, a good sign that it will move higher over the next week or two. Support at $6.25.

Read the entire StockScores Perspective Newsletter titled Opening Hour Research

-
I know Mike is a very solid investor and respect his opinions very much. So if he says pay attention to this or that - I will.
~ Dale G.
-
I've started managing my own investments so view Michael's site as a one-stop shop from which to get information and perspectives.
~ Dave E.
-
Michael offers easy reading, honest, common sense information that anyone can use in a practical manner.
~ der_al.
-
A sane voice in a scrambled investment world.
~ Ed R.
Inside Edge Pro Contributors

Greg Weldon

Josef Schachter

Tyler Bollhorn

Ryan Irvine

Paul Beattie

Martin Straith

Patrick Ceresna

Mark Leibovit

James Thorne

Victor Adair