
Stocks & Equities

This past week, the Federal Reserve, as expected, failed to raise interest rates once again due to ongoing economic weakness and weak labor market results. However, while that meant “accommodative policies” are here to stay for a while longer, it was their forecast that got the “bulls” excited. As Mohamed El-Erian penned for Bloomberg:
“Of critical importance to markets is that a decision to raise interest rates for the first time in almost 10 years is now more of a ‘live’ possibility at the Fed’s next policy meeting, in December. In reasserting this policy flexibility and making it explicit, the central bank refrained from providing specifics about the elements that would drive the decision.
The Fed’s message conveyed greater unity among its policy-making officials. Only one member of the Federal Open Market Committee — Jeffrey Lacker, the president of the Richmond Fed, dissented. The near unanimity was an important accomplishment by Chair Janet Yellen, especially given the range of views expressed in the weeks leading up to the meeting, including by the usually united governors.
Many of those in the markets who had grown comfortable with the idea that the Fed would delay a hike until next year are now rushing to adjust. The result will be higher interest rates, especially for shorter maturity Treasury bills, and a stronger dollar.”
The last sentence is the most important. While the “bulls” came piling back into the market (creating a short-covering squeeze late Wednesday afternoon) the consequences of higher rates as noted really isn’t that bullish for stocks.
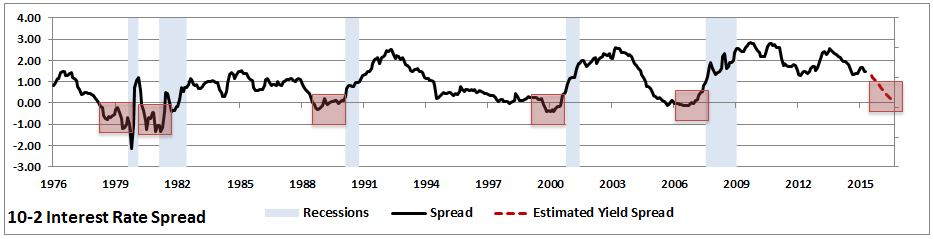
First, let’s take a look at the beloved yield-spread which is currently signaling “no recession” in the economy. As the chart below shows, the spread currently between the 10-year and the 2-year Treasury bonds is positive. However, as shown by the dashed red-line, when the Fed starts hiking the short-end of the curve, without economic growth picking up the long end, recessionary inversions can happen very quickly.
….read more HERE including Sector Analysis
Stocks could absolutely soar over the next 18 months, as we come out of the extreme of fear in August.
“Welcome to THE MELT UP.” That was the theme of my speech at our Stansberry conference in Las Vegas a few weeks ago…
The idea was simple…
You could feel the fear at our Vegas conference… Our speaker lineup was loaded with famous investors and hedge fund managers. Most of them were extremely pessimistic.
The thing is, whenever we reach an extreme of fear in the markets, a bottom is often right around the corner. Once the uptrend returns, you MUST own stocks. In August, we reached that extreme of fear. In September, the uptrend returned.
I was shocked at just how extreme the August extreme actually was… Fear levels were comparable to those of Black Monday 1987 or to those after the Asian Crisis in 1998.
The 1998 correction is a great one for us to learn from today…
In late 1998, investors were scared…
U.S. stocks had experienced a violent correction. From peak to trough, they fell 19%.
This had a big effect on investor psychology… You see, stocks hadn’t fallen this much from their peak since Black Monday in 1987 – when they fell more than 20% in one day.
“Bleak” was the best way to describe the feeling in late 1998… The Asian crisis was in full swing and U.S. stocks seemed expensive. In early September 1998, investor sentiment hit its lowest level of the entire decade, according to the Advisor and Investor Model (“AIM”) on SentimenTrader.com.
Investors thought this was surely the end of the boom. Stocks had been up every year of the decade (when you included dividends). Take a look:

Of course, investors got it completely wrong… You know what happened to stock prices after late 1998…
Over the next year and a half, the Nasdaq soared from about 1,500 to more than 5,000. That was a gain of more than 200%… in 18 months. (Even the “regular” stock index – the S&P 500 – soared by more than 60% in that
time.)

Many investors missed this massive run. They were scared that the bull market was over. Remember, the run started during the lowest sentiment level for the entire decade.
The previous time investors were this bleak (based on the SentimenTrader AIM) was right after Black Monday in October 1987. Of course, just like in 1998, stocks soared after investor sentiment hit a record low. The stock market went up 40% in less than two years after Black Monday.
Those two dates were extreme circumstances. It takes a lot to have an investor sentiment reading as extreme as it was on Black Monday or in late 1998.
But surprisingly, we hit a major extreme in investor sentiment at the end of August.
I say “surprisingly,” because it usually takes a dramatic bust to scare the bejesus out of people… But this time around, all it took was a 12% fall, peak to trough. Why did this relatively small correction scare people so badly? I think they were already edgy and predisposed to looking for the “bad” in the market.
The message from history is clear – when investor sentiment gets as extreme as it did in August, and the uptrend returns, then you want to own stocks. We have an incredible opportunity today.
Today, it’s potentially like late 1998 – all over again – in U.S. stocks. It’s time to be in.
Welcome to THE MELT UP…
Good investing,
Steve
….more from Steve: Gold Stocks Have NEVER Been This Cheap…
Always do what you are afraid to do. ~ Ralph Waldo Emerson
We are listing excerpts from past market updates to illustrate how the mass mindset is always wrong. Even big shots like Bill Gross are not exempt from being sucked into this black hole, otherwise known as the mass mindset. Herd psychology clearly indicates that the only time a market is going to crash is when emotions have hit a boiling point. In other words, the crowd is foaming with joy. However, regarding bonds, there is one more factor that needs to be considered. The element of control and that element has a name; it is called the Fed. They are the ones that are going to determine when rates rise, as they are holding it down for an unusually long period. The simple question that comes to one’s mind is why? The answer is equally simple. The current economic recovery is nothing but smoke and mirrors; the Fed understands that the Crowd is aware of this phenomenon, but if the markets are driven up, then a glimmer of hope emerges. Hope springs eternal and even though the masses know that all is not well, this ray of hope that things will get better because the markets are soaring higher is what keeps them trudging along. Lost to them is the fact that the markets are trending higher only because rates are being artificially kept lower, so this hope sets off a chain reaction. More hot money is needed to fuel the illusion that all is well. The only way to pull this off is to keep rates down at extremely low levels. Low rates create an environment that fosters speculation. In this environment, speculators are rewarded, and savers are punished. Unfair. Damn right but that is life. So before you jump on the bandwagon of doom, understand that most of those naysayers are like broken clocks. Even a broken clock is right twice a day. What you should strive to understand is that every disaster is nothing but opportunity dying to plant a big fat kiss on your cheeks. Embrace the bugger, instead of kicking him to the curb as most do. See the world for what it is and not what others (so-called) experts force you to see. March to your drumbeat and not to the drumbeat of the talking heads, whose sole function is to add make a simple development appear to be scary and frightening. If you bought the nonsense the world was going to end; the markets were supposed to crash, blah, blah. You would have lost your shirt, your pant and your knickers in the process. Do not give credibility to people who only employ the tool of fear to sell you a bag of magic bones.
The excerpts listed below together with this chart will illustrate how dangerous it is to follow the doctors of doom.

Bill Gross has been predicting a collapse in the bond markets for quite some time and one day most likely he will get it right. Rates have to be allowed to move a little otherwise it will appear that the Feds are completely controlling everything; even though this is true, the masses do not believe this, so appearances must be maintained. Higher rates mean higher debt payments and higher costs to business and this must be avoided at all costs. Business are always given the best deal. America is bought and paid for by the corporate world. ~ Market Update May 17, 2015
Since we made these comments, bonds have rallied nicely, but we feel that they should (key word should) retest their lows before moving higher and testing their old highs. The trend has not turned negative and the reason bonds sold off is because too many fools had over-leveraged themselves in the futures markets. When there was talk from the Feds that rate hikes would be inevitable, markets pulled back and some of these long positions were so leveraged that some players were forced to liquidate their positions; this turned what would have been an orderly pullback into a short-term blood bath. This pullback allowed the Feds to give the impression that they are not manipulating the markets, some stupid fat greedy bulls were slaughtered, the bears were pushed into opening new shorts, so everything has been set up for a rebound. At this point of the game, bonds are still expected to reverse course and trade higher. ~ Market Update May 31, 2015
Bonds pulled back strongly and not only did they test their lows; they dropped to new lows, fulfilling the illusion the Feds wanted to create that the markets are free. What most have failed to note is that bonds have sold off several times during this bull market that started in 2008? In every instance, bonds recouped their losses. One day, this pattern will stop, and the trend indicator will inform us of this in advance. Until then, let the good Samaritans try to help everyone, and the naysayers sing their infamous song of impending doom. This up and down process will further cement the view that the Fed is impartial. It is the classic story: strong correction, then consolidation (lots of up and down movement) and then a new breakout that leads to new highs. ~ Market Update,June 19, 2015
As the trend has not turned negative, we have to view the current correction (regardless of how strong it might or might not be) as a normal cyclical move, in an otherwise healthy market. ~ Market Update June 30, 2015
After letting out some steam, bonds rallied as expected and by the middle of July, they had recouped almost losses that incurred, confirming that the naysayers were wrong once again. One day bonds will correct strongly and in our opinion bonds are more likely to experience a stronger correction than the Stock market. Stocks are far from overvalued, and the sentiment is not euphoric yet. As long as the trend indicator is bullish or neutral we will view all strong corrections as buying opportunities. Additionally, the Fed is not in a rush to raise rates, and they could play this game of cat and mouse forever. Ultimately as this economic recovery is nothing but illusory in nature, and the Fed will be forced to come out with another QE program.
So, while many well-educated, but not savvy market penguins stated that bonds were going to plunge even more, they recovered as expected. They traded past 152-153 ranges and are now on the way to test the 156 ranges. If they close above 156 on a weekly basis, then they will challenge the old highs or at the very least test them. The weekly trend is up; therefore, all pull-backs have to be viewed as buying opportunities.~ Market Update July 31, 2015
Bonds traded as high as 159-28 before pulling back, setting up the path for a possible test of the old highs. The weekly trend is still up, so all pullbacks have to be viewed as buying opportunities. We could recite more nonsense, but that would mean wasting good time on a senseless endeavor, so we will respectively decline the offer. Bonds will crash one day; however, we would rather not fixate on one day. We prefer to look at today, and today is not the day they are going to crash. The move by China to devalue its Currency last week could very well be the excuse the Fed needed to leave interest rates untouched, and then slowly build the notion that some sort of stimulus is needed. ~ Market update August 19, 2015
Bonds rallied but failed to trade to new highs yet, as the trend is still up, one can expect bonds to attempt to test their highs again. As equity markets and bonds are diverging, a move to new highs by bonds, would coincide with another corrective wave in the equity markets. ~ Market update Sept 1st, 2015
Even if the Fed raises rates, and at this point its a 50-50 shot a best, we expect the Feds to come out with some insane form of QE. Perhaps a QE for the people might be the next game plan; It sounds insane, well believe it or not Jeremy Corbun, Britain’s new labour party leader has proposed just this. You can read the full story hereNote that QE is still going on in the form of share buybacks. Based on the number of share buybacks authorized this year, the total dollar amount is set to exceed $1 trillion, setting yet another new all-time record. There is strong support in the 150-15 to 152 ranges, and the current consolidation should end there. ~ Market Update Sept 15, 2015
Try to recollect how you acted every time the markets sold off, whether it’s the bond market or stock market, it’s irrelevant. Did you give into fear, did you panic and Join herd as it stampeded towards the exit. A mind driven by panic cannot act rationally. Therefore, any action is bound to lead to a negative outcome. The best thing to do is to focus on what the crowd is doing and then use technical tools to help determine entry or exit points. It is the masses that produce the extreme moves in the market, and if you understand that fact, then you can use it to your advantage. We viewed every pullback as buying opportunity because the trend was still up.
So what’s next?
First and foremost make sure you never listen to the Doctors of Doom. They are not out there to help you; they will cloud the picture even more. If they knew when the markets were going to crash, then they would be sitting on the beaches of some tropical paradise, sipping Pina Coladas and raking in the millions. Instead, you find them screaming bloody nonsense and doing their best to scare individuals into believing what they very well know to be nonsense. Understanding the psychology of the masses is key to being a successful trader. When you couple technical analysis to the powerful concept of mass psychology, it becomes easy to understand what the masses will and will not do. One can then use the Technical indicators to fine tune one’s entry point.
Bonds
Overall the bond market is far more overvalued than the stock market, and we believe that for now, it would be best to sit on the sidelines regarding bonds. Ideally they will test the 149-150 ranges, with a possible overshoot to the 147 ranges, at that point one could take a closer look at them. The reason for this view is simple. Stocks are far from being overvalued, and the sentiment is not trading in the euphoric ranges. Therefore, every strong pullback has to be viewed as a buying opportunity. We expect the Dow to experience another pullback, the final strong pullback for the year. It is expected to test the 15800-16000 ranges, with a possible overshoot to the 15500 ranges. If this comes to pass we, will view it as a splendid buying opportunity as the Dow should end the year in the black. Next year, the Dow index is expected to trade to new highs; this was covered in a recent article titled; the Dow is getting ready to soar
Tactical Investor, where mass psychology and technical analysis converge seamlessly

Read the entire StockScores Perspective Newsletter titled Measuring Your Trading Performance
STRATEGY OF THE WEEK
It is earnings season and this week is the busiest for announcements so there will be lots of action. If a company impresses investors with their announcement of earnings, the stock will often gap higher. These price gaps are a bit scary to trade because the distance down to support is far and that makes entry risky.
Often, these big gappers will pull back for a day or two after the big gap up and then resume their upward trend. This presents a great opportunity for the savvy day or swing trader who does not forget about the hot stocks of a few days ago. When stocks are hot on news, keep them on your watch list for a few days and wait for the echo, a break of a pull back after the gap. Here are two stocks that made big gaps in the last week and then went on to surge higher after a brief pause. These are not here for you to trade now, but as examples of what to watch for as other companies do the same thing on the heels of earnings news:
STOCKS THAT MEET THAT FEATURED STRATEGY
1. MSFT
MSFT sold off in to the close on Friday but broke that pull back this morning at around 10:22 and went for a good push up in to the close, giving the day trader a better than 3 to 1 reward for risk pay off. That means $1000 risked made over $3000 for the day.
 2. MCD
MCD is a stock that I shorted on the open after it gapped up on good news. I did not hold the position long as it soon stabilized and resumed its upward trend. Nice break of the pull back at around 10:30ET on Oct 22 that lead to a nice run over the next couple of days.


-
I know Mike is a very solid investor and respect his opinions very much. So if he says pay attention to this or that - I will.
~ Dale G.
-
I've started managing my own investments so view Michael's site as a one-stop shop from which to get information and perspectives.
~ Dave E.
-
Michael offers easy reading, honest, common sense information that anyone can use in a practical manner.
~ der_al.
-
A sane voice in a scrambled investment world.
~ Ed R.
Inside Edge Pro Contributors

Greg Weldon

Josef Schachter

Tyler Bollhorn

Ryan Irvine

Paul Beattie

Martin Straith

Patrick Ceresna

Mark Leibovit

James Thorne

Victor Adair