
Stocks & Equities
The paranoiac is the exact image of the ruler. The only difference is their position in the world. One might even think the paranoiac the more impressive of the two because he is sufficient unto himself and cannot be shaken by failure. ~ Elias Canetti
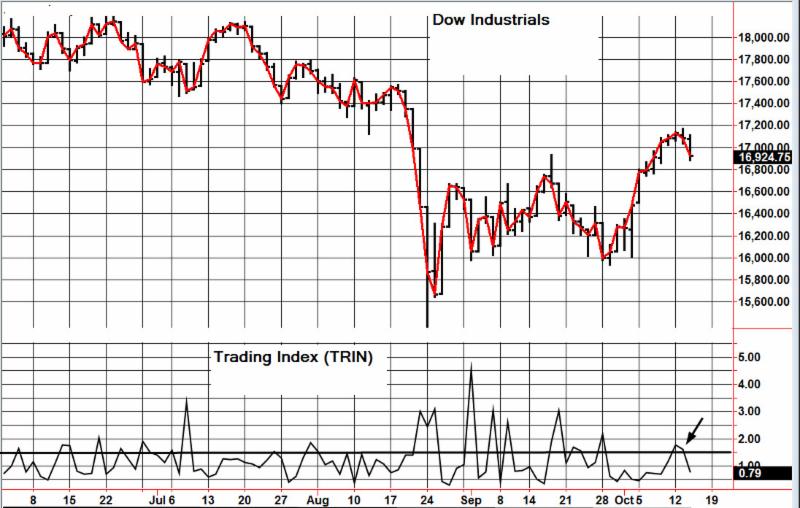
Feels like 2011 all over again. The Dow is tracing a pattern that bears an uncanny resemblance to the one set in 2011. History could be repeated again; the Dow could be ready to rumble instead of being taken down for the count. When the markets were plummeting in 2011, many experts were making the same dire predictions, while others were wondering if the bull had bashed its head into a brick wall. Turns out that the so-called crash was nothing but a hiccup in what turned out to be one of the most massive bull run’s of all time. Faced with the same paradigm again, the talking heads (many who actually have the impudence to call themselves experts) are marching to the same drumbeat and chanting the same hymn of doom.
As we live in an era of lies and deceit, where rampant manipulation is the order of the day; worse still, no one is contesting this manipulation. The masses have embraced that this is their destiny and surrendered to this new market norm. A norm that rewards speculators and punishes savers. As the laws of reality have been suspended (courtesy of the masters of deception, otherwise known as the friendly Fed), the markets will only crash if access to easy money is eliminated. This hot money is what’s fueling the markets and will continue to do so in the foreseeable future. Against this backdrop of deceit and corruption, normal market rules cease to apply.
Therefore, our contention has been that every major correction for the past several years is nothing but the market letting out a well deserved dose of steam and that a massive crash is not the makings; at least not yet. One day the markets will crash, but as this market is being propped up a by hot money, anything and everything will be done to prevent the markets from crashing. If there was any dose of freedom left in these markets, they would have crashed long ago. There is a stark difference between thinking you know what will happen and from knowing what is going to happen. Mass psychology clearly states that markets usually run into a brick wall when the Crowd is Euphoric and chanting “Kumbaya my love”. This is not the case yet and sentiment is far from the euphoric zone. This is one of the most hated bull markets in history.
Is this Deja Vu?
The predictions that Dow was destined for destruction during the correction of 2011 might have appeared erudite in nature. Those predictions, now in retrospect, sound more like the ravings of a lunatic. Be wary when the masses are joyous and Joyous when they are not, that in essence is the most basic tenet of mass psychology.
Dow Pattern in 2011

-
In 2011, the from high to low the Dow shed roughly 16.2% or 2,070 points. Now, depending on your entry point the experience could have ranged from being mild to crash like in nature. If you purchased right at the top, then the word crash was probably flashing through your mind. Just because you think it’s a crash does not necessarily signify that your perceptions, that are being overwhelmed by fear are correct.
-
All media outlets were busy flooding the waves with stories that extremely pessimistic in nature. Misery loves company and stupidity simply adores it. Consumer confidence was not strong, the U.S. credit rating was downgraded, manufacturing was slowing down, and the list goes on. . The 3rd quarter ended and the 4th quarter began and all those bogeyman stories well proved to be just that.
Markets climb a wall of worry and plunge down an abyss of joy; this is clearly demonstrated in the chart below

In 2011, the Dow ended the year on a positive note, defying all the predictions of disaster. Three months into the new year (20120, the Dow soared to a series of new highs. Like cockroaches, the naysayers vanished into the woodwork waiting for another day to sing the same old monotonous song, buoyant that time would make the masses forget the old proclamations and embrace the new ones; this falls dangerously close to the definition of insanity. Doing the same thing and expecting a different outcome. So far the outcome appears to be the same and if the pattern is repeated, then these chaps are going to get clobbered.
Dow outlook 2015

During the so-called market crash phase that started in August, the Dow from high to low shed approximately 16.3%….. Strikingly close to the 16.2% that the Dow gave up during the 3rd quarter of 2011. So far, in the 4th quarter, all the major market indices are faring much better as was the case back in 2011. In the 4th quarter, the Dow has tacked on almost 5%.
Market Sentiment during the so-called crash phase

The VIX, which is an index that measures fear blasted as it was being chased by the hounds of hell. ItX surged to a new 5 year high, pointedly illustrating that the masses were hysterical. Panic is the secret code name for opportunity. Mass psychology clearly indicates that when the crowds panic, the astute investor should be ready to jump in.
The bullish case for the Dow builds:
-
A host of technical indicators are still trading in the extremely oversold ranges.
-
Our trend indicator is dangerously close to triggering a new buy signal. The fact that it did not move into the sell zone validated that the correction was nothing but a market letting out some well-deserved steam.
-
Retailers like Costco (COST), L Brands (LB), Fred’s (FRED), etc., all surprised analysts by reporting stronger than projected same-store sales.
The Game plan going forward
Fear has to be avoided under any circumstance when it comes to investing. It is a detestable emotion that just sucks you dry. It takes and gives nothing back in return. When the crowd panics, one should resist the urge to become one with fear and the crowd. We are not in the jungle and fear is a useless emotion when it comes to making money in the markets. Get rid of it or it will get rid of you. Fear is a parasitic emotion; the only good parasite is a dead parasite. So shoot to kill when it comes to fear.
To break even for the year, the Dow only needs to trade approximately 600 points higher. If examines the entire journey (up and down) the Dow traversed from August to Oct, the count comes in at roughly 5000 points. Examined from this angle, 600 points does not amount to that much; the Dow still has roughly three months to achieve this objective.
The ride up is expected to be volatile as our V indicator is trading well above the danger zone; 1100 points higher to be precise. This means that extreme volatility is going to be the order of the day. One should not expect the ride up to be smooth. We have a fair amount of resistance in the 17300-17400 ranges. The ideal set up would be for the Dow would trade in these ranges, with a possible overshoot to 17,600 and then proceed to test 16,500-16,600 ranges. The Dow is then expected to put in a series of higher lows, ending the year on a positive note.
Bear in mind that the above targets should serve as rough guideposts. We never focus on trying to identify the exact bottom or top, a task we think is best left to fools with an inordinate appetite for pain. The game plan should be to view all strong pullback as buying opportunities.
Dow Dejavu? When one examines both the patterns (2011 and 2015); the answer appears to be “yes”
Action cures fear, inaction creates terror. ~ Doug Horton

Marc Faber comments on the outlook for stocks during this short video clip.
A look at the 1987 Stock Market Crash:
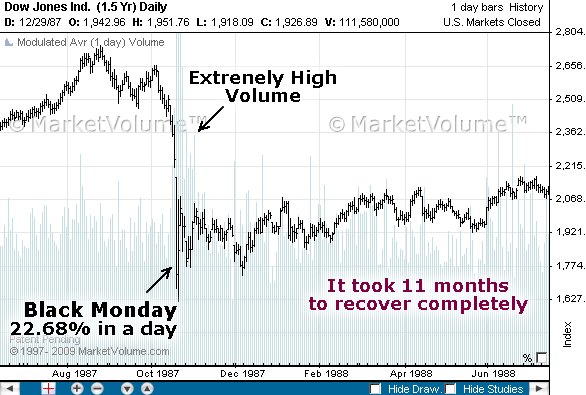
Chart via symonsez.wordpress.com
Faber interview with Bloomberg’s Joe Weisenthal, Scarlet Fu and Alix Steel on “What’d You Miss?” (Source: Bloomberg)
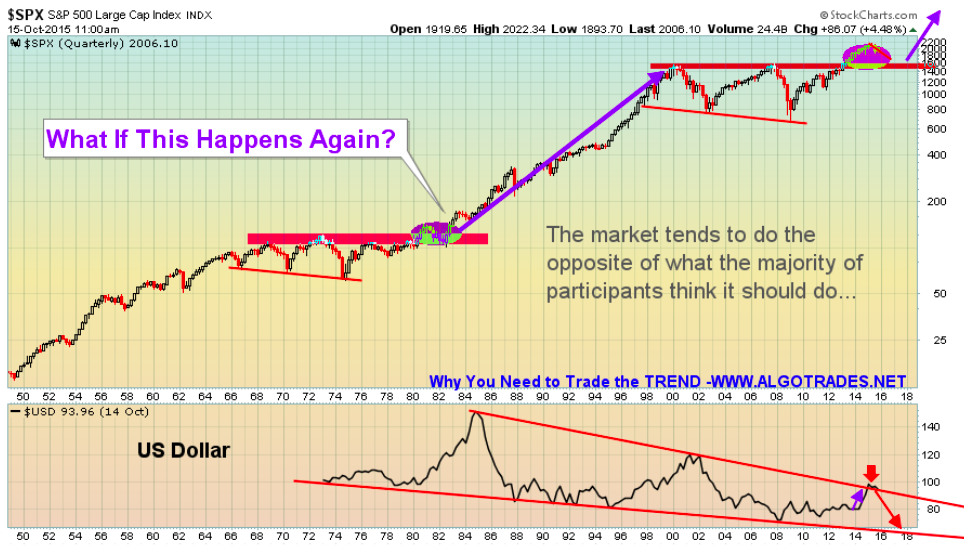
This chart I feel provides a great perspective on the overall market trend and price patterns. This is the 70 year historical chart. I hope something like this unfolds. Fingers crossed to a nominal 12 month correction/bear market. This will build a new base for the next super cycle.
US Dollar has now reached the upper resistance trend line… we could see weakness in the dollar going forward… Keep in mind this is a quarterly chart, lower prices may still be a few months away.
Over the past 13 trading sessions, the benchmark S&P 500 Index climbed 7.6%.
It’s a big move in a short time. One that has many people asking if the correction is over… and if it’s safe to “go big” in stocks.
Our answer: We’re not out of the woods just yet. The recent rally is encouraging… But there are a few major obstacles the market has to overcome first…
In today’s essay, we’ll review our current investment thesis… And we’ll show you the three things to look for before getting aggressive with new stock purchases.
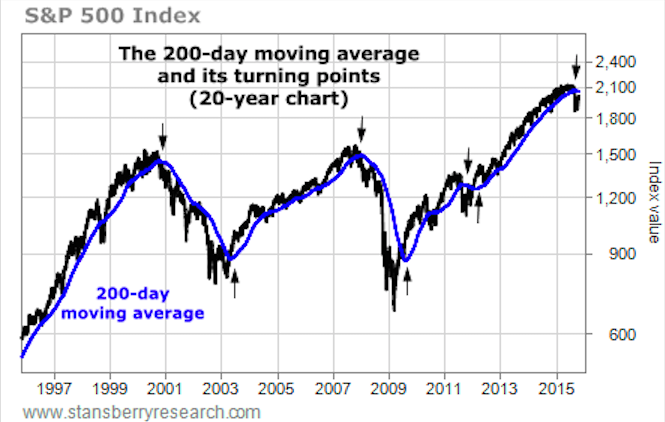
First, let’s discuss the 200-day moving average.
A lot of professionals like to use the 200-day moving average to size up a market’s long-term trend. It works by collecting an asset’s closing prices from the past 200 days, then taking the average of those prices. This produces a chart line that “smoothes out” market volatility.
There are two main things to consider when looking at the 200-day moving average:
- During bull markets, stocks tend to spend most of their time above the 200-day moving average. During bear markets, they spend most of their time below it.
- If the 200-day moving average itself changes direction, there’s a good chance a new big trend is underway.
You can get a good feel for these two ideas in the 20-year chart below. It shows the S&P 500 and its 200-day moving average. As you can see, during each of the three bull markets, the S&P 500 traded mostly above its 200-day moving average. And during the two bear markets, the S&P 500 traded mostly below it. The arrows show the seven times the 200-day moving average changed direction for at least a month.
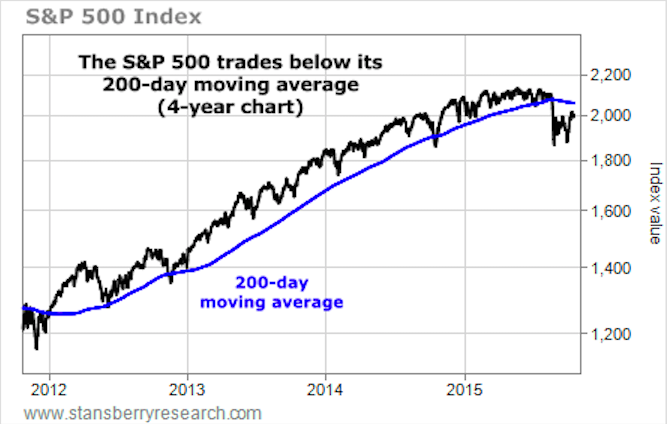
As of August 21, the S&P 500 has traded below its 200-day moving average… and the 200-day moving
average itself has been moving lower. You can see this more clearly in the four-year chart below.
For now, the trend is down. And we remain cautious on stocks. If investors can push the S&P 500 back into an uptrend, we’ll be much more comfortable adding to our stock holdings and even speculating on higher prices.
Before we’ll trust the uptrend, though, three things need to happen:
- The S&P 500 needs to break above its 200-day moving average,
- The 200-day moving average itself needs to turn higher, and
- The S&P 500 needs to close above the 2,131 level.
No. 3 may be the final hurdle… Or it may come before the 200-day moving average turns higher. Either way, as we explained in our September 8 essay, we believe the stock market will only offer significant potential gains if the S&P 500 breaks 2,131 to the upside. Until then, the broad market is in “no man’s land.”
As you can see in the chart below, 2,131 (2,130.82 to be exact) is the all-time high for the S&P 500.
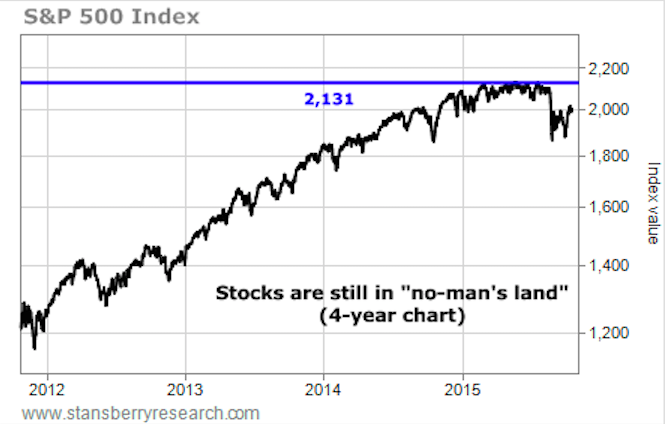
Old highs (like old lows) are important psychological levels. A move above 2,131 would mean investors believe the global economy is strengthening, not weakening. It would mean corporate profits are strong enough to shrug off today’s big worries, which include a recession in China, excessive corporate and government borrowing, and a strong U.S. dollar.
If the stock market were to break 2,131, it would go a long way toward repairing faith in the economy and the stock market.
The rapid 7.6% jump in stocks feels good. But that doesn’t mean it’s time to get aggressive… Until our three criteria are met, the stock market is “guilty until proven innocent.” The downside risk in stocks is larger than the upside potential.
So for now, our advice remains the same: Confine your stock purchases and trading to only the most attractive opportunities. Try some short trades. And keep plenty of cash on hand for any great buying opportunities that turn up.
Regards,
Brian Hunt and Ben Morris
Further Reading:
“If the S&P 500 falls 20% in the next year, how will your stock holdings perform?” Brian and Ben write. “If the S&P 500 climbs 20% in the next year, how will your stock holdings perform?” Thankfully, there’s a stock market strategy that allows you to make good money in either of these outcomes. You can learn all about it right here.
Brian and Ben say one of the simplest – and most important – ideas in all of investing is asset allocation. “It could save you hundreds of thousands of dollars over the course of your life,” they write. Get all the details here.
| Wed. | Thu. | Fri. | Mon. | Tue. | Wed. | Evaluation | |
| Monetary conditions | 0 | 0 | 0 | 0 | 0 | 0 | 0 |
| 5 day RSI S&P 500 | 75 | 80 | 80 | 81 | 64 | 54 | 0 |
| 5 day RSI NASDAQ | 67 | 70 | 73 | 74 | 56 | 51 | 0 |
|
McCl-
lAN OSC.
|
+244 | +297 | +275 | +241 | +133 | +89 |
0
|
| Composite Gauge | 5 | 7 | 9 | 7 | 15 | 12 | 0 |
| Comp. Gauge, 5 day m.a. | 6.2 | 6.2 | 7.0 | 7.4 | 8.6 | 10.6 | 0 |
| CBOE Put Call Ratio | 1.09 | 92 | .86 | .92 | .89 | .96 |
0
|
| VIX | 18.40 | 17.42 | 17.08 | 16.17 | 17.56 | 18.03 | 0 |
| VIX % change | -5 | -5 | -2 | -5 | +9 | +2 | 0 |
| VIX % change 5 day m.a. | -5.6 | -5.0 | -4.0 | -3.6 | -1.6 | -0.2 | 0 |
| Adv – Dec 3 day m.a. | +1445 | +1210 | +1228 | +819 | -345 | -655 | + |
| Supply Demand 5 day m.a. | .81 | .78 | .69 | .67 | .61 | .48 | 0 |
| Trading Index (TRIN) | .74 | .72 | 1.22 | 1.79 | 1.64 | .78 |
0
|
|
S&P 500
|
1996 | 2013 | 2015 | 2017 | 2004 | 1994 | Plurality +1 |


-
I know Mike is a very solid investor and respect his opinions very much. So if he says pay attention to this or that - I will.
~ Dale G.
-
I've started managing my own investments so view Michael's site as a one-stop shop from which to get information and perspectives.
~ Dave E.
-
Michael offers easy reading, honest, common sense information that anyone can use in a practical manner.
~ der_al.
-
A sane voice in a scrambled investment world.
~ Ed R.
Inside Edge Pro Contributors

Greg Weldon

Josef Schachter

Tyler Bollhorn

Ryan Irvine

Paul Beattie

Martin Straith

Patrick Ceresna

Mark Leibovit

James Thorne

Victor Adair