
Stocks & Equities
“Earnings are the mother’s milk of stocks.”
—Old Wall Street adage
Alcoa is the first major company to report its quarterly results, so it often sets the tone for the rest of earnings season. If Alcoa’s results are any indication, things could get very ugly very fast.

It’s no secret that commodity prices have dropped, but the impact on corporate profits is worse than Wall Street expects.
Alcoa reported earnings well below Wall Street’s already-lowered expectations of 7 cents per share on $5.57 billion in revenue; much lower than the 13 cents per share on a $5.65 billion forecast.
Alcoa shares got hit hard on that big miss, and while nobody likes losing money, it is a painful reminder that nothing goes up forever.
In the last 15 years, we’ve seen two painful bear markets that temporarily wiped out investors’ capital: $5 trillion during the dot-com bust and $7 trillion in the financial crisis of 2008.
The stock market goes up and the stock market goes down, but one thing that doesn’t change is the hunt for companies that are still growing their earnings.
If you can identify those companies… you will make money.
The earnings of the 500 stocks that make up the S&P 500 peaked in the third quarter of 2014 and have fallen since then. However, that doesn’t mean profits are falling everywhere.

Six out of the nine broad sector categories have seen their profits fall. Profits of energy companies (no surprise) have dropped the most, followed by Consumer Staples, Financials, Industrials, Materials, and Utilities.
However, the profits of Health Care (+28.7%), Consumer Discretionary (+12.1%), and Information Technology (+10.6%) are up during the same period.
More importantly, the stocks in those sectors that are growing their profits also delivered the best performance. As the chart below shows, Health Care and Consumer Discretionary were the two strongest-performing sectors.

The moral of the story is, of course, that identifying the sectors with the strongest-growing profits is more important than the bull versus bear market debate.
So what’s the earnings outlook today?
The S&P 500 is now trading at 17 times trailing 12-month earnings based on the consensus year-end earnings estimate of $111.62.
Those earnings estimates, however, have been steadily declining—from $137.19 in March 2014 to $111.62 today.

What about 2016? The average estimate for the S&P 500 is $131.46, which implies a 17.5% increase in corporate profits over the next year.
Of course, the actual earnings number will be different—perhaps a bit higher or perhaps even lower. But regardless of what the actual 2016 earnings end up being, there will certainly be sector winners and sector losers.
Our challenge is to make sure you stay away from the sector losers and concentrate on the sector winners.
Who will that be? That’s the million-dollar question, but I believe it’s NOT going to be energy and materials companies. You’ve been warned.

Tony Sagami![]()
30-year market expert Tony Sagami leads the Yield Shark and Rational Bear advisories at Mauldin Economics. To learn more about Yield Shark and how it helps you maximize dividend income, click here. To learn more about Rational Bear and how you can use it to benefit from falling stocks and sectors, click here.

 Investors can generally be categorized into different groups based on the strategies they use. At a very high level, the main strategy divide is between fundamental investing and technical investing. Put simply, fundamental investors look at the investment merits of the actual company they are buying, including earnings, growth, assets, debt and industry outlook. Technical investors, on the other hand, often pay no attention to the company, but rather analyze the stock’s chart patterns, price and volume movements.
Within the fundamentalist category there exist further divisions. The two key types of fundamental investment strategies are growth and value. As the name implies, growth investors look to find companies that have high revenue and earnings growth rates which can presumably be sustained over an extended period. This type of investor believes that revenue and earnings growth drive share price appreciation. The criticism of this strategy is that growth investors are often willing to pay obscenely high valuations in order to buy the company’s with the highest growth rates. On the other side of the spectrum are value investors who want to find companies that they can purchase at a bargain on a price-to-earnings or price-to-cash flow basis. This type of investor believes that investment return will either be a function of valuation expansion or through the receipt of free cash flow (likely in the form of dividends) generated by the company. The main criticism here is that value investors may purchase lower quality companies in an effort to obtain what they view as a bargain.
Each of these two strategies has its strengths and its weaknesses. Pure growth investing in particular seems to lure most investors due the appeal of “market confirmation.” Companies with high growth rates tend to go up in price (at least for a while) and a rising share price is often viewed as evidence of a quality investment. In hindsight, of course this is the case as a rising share price does equate to investment return. But the decision to buy or continue to hold a stock depends on what the investor believes the company will do in the future and not what it has done in the past. The main problem with growth investing, as we see it, is that high growth companies often trade at very high multiples to earnings and cash flow (valuations) which reflect an expectation from the market that this growth will continue or even accelerate. Often these expectations are overzealous. There is a saying in the market, “companies that have gone up in price have a tendency to continue to go up in price.”We heard this statement repeated a lot by so called financial professionals, but anyone who actually believes it would have very little credibility with us. We prefer an adapted version, “sometimes companies that have gone up in price continue to go up and sometimes they come crashing down.” The latter happens to even high-quality companies when investor expectations (valuations) get so high that even a slight deviation from the growth trend or setback in the corporate strategy can result in a massive downward revaluation of the stock.
Recent market volatility has provided us with numerous examples of these types of stocks. Let’s take a look at the once beloved Avigilon Corp (AVO). A few years ago this was a highly touted growth stock and at the height of its market success, the company achieved a lofty valuation multiple of over 70 times earnings (price-to-earnings). It was not surprising to us that it was at this point that the company garnered most o f its attention and praise. But very few companies can sustain a growth rate of 200% per year and in spite the fact that Avigilon’s earnings have continued to grow a very solid double digit rate since hitting its peak valuation less than 2 years ago, the stock has since lost over 60% of its value and now trades at about 16 times earnings. This is not a reflection of the market’s apathy towards profitability and earnings growth. It is a revaluation of a company that in spite of continued success with respect to earnings growth has fallen out of favour with the market because it was once so highly overvalued and encountered a setback.
Just in the past few weeks, two very prized Canadian pharmaceutical companies, Valeant Pharmaceuticals (VRX) and Concordia Healthcare (CXR), had their own doses of reality. As of the beginning of September, these giants posted 12 months share gains of 140% and 210%, respectively, and commanded valuations above 30 times earnings. The growth trend appeared to justify the premium multiple, but it didn’t take more than a couple of words of concern over pricing practices from U.S. Presidential Hopeful, Hillary Clinton, to send these stocks falling. In less than 6 weeks, Valeant has dropped 25% and Concordia has dropped 55%. Clearly there are some outside forces at work here and these companies may one day regain their luster. The lesson here is that high valuations often indicate that the market is not factoring in the full risk profile of the company but rather focusing on the best case scenario.
A few others include Patient Home Monitoring (PHM) which lost 70% of its value since April, AutoCanada (ACQ) which lost 65% of its value since hitting its peak a year ago, Sylogist (SYZ) who’s share price has been nearly cut in half in less than a year, and Nobilis Health Corp (NHC) who’s share just declined 27% in a single day, apparently as a result of a negative article on a popular investing site. These are just a few recent examples of some very highly touted, high valuation companies that were re-valued quickly in spite of overall fundamentals and earnings remaining more or less intact. In some cases, these particular companies continue to trade at high valuations. For others, the valuation has become more reasonable and now may be the time to start looking at them as solid investments.
Within fundamental investing, there is a third strategy category that recognizes the strengths of growth and value investing, while also trying to mitigate the weaknesses. This third strategy is called GARP or growth at a reasonable price. Like the growth investor, the GARP practitioner seeks to identify high-quality companies with attractive growth rates. However, unlike the growth investor, the GARP practitioner is still price sensitive while purchasing companies and avoids those stocks with very lofty valuations. Generally speaking, GARP is not as price sensitive as pure value investing and is willing to pay a higher valuation for attractive earnings growth, as long as the valuation lies within a reasonable range.
|
KeyStone’s Latest Reports Section 10/9/2015 |
The following is part of Pivotal Events that was published for our subscribers September 29, 2015.

Stock Markets
Our near-term target has been the low closes on August 24th, which levels are being reached. This would follow the momentum CCI bouncing to 100 (![]() ).
).
Our longer-term view on July 23rd was that the bull market was over. Our “Friends of the bull market” had been useful and had reached their “Best Before” date.
If the intra-day extremes are taken out it would mark the start of a cyclical bear market. Global stock markets (VEU) are virtually at the extreme. So are Biotechs (IBB). STOXX is almost there. The NYSE Comp (NYA) is at the low close. SSEC, having suffered the brunt of the storm, is a couple of percentage points above the low close.
Is this oversold enough to look for a bottom for this slide?
The senior indexes could spend a brief period at their August 24th closes. But it is possible that this could go to extremely oversold.
The S&P Weekly RSI is down to 31. Seasonal extreme RSIs in 2008 and in 2002 were at the 26 level.
Also, the typical seasonal low for the full discovery of illiquid markets has been in October. Small Caps (RUT) led the market turn in setting its high in June. The Weekly RSI is down to 31, around 26 would be extreme.
Momentum for Banks (XBD) is down to 36. Extreme would be just under 30.
Seasonality got us this far. Seasonality could bottom some two to four weeks from now. Momentum has further to go.
The prospect of trying to catch falling knives is always ghastly. Particularly as it overwhelms “buying the dips”. Ross will be monitoring for Downside Capitulations on momentum and Sequential Buys for pattern.
Credit Markets
Financial markets are again suffering declining liquidity and the intellectual classes are discussing whether the Fed should increase administered rates. Can’t believe it, but at least there is none of the nonsense last seen in late 2007. The Fed would cut rates and all would be well.
On this transition from bull market to contraction, credit spreads provided the guide – again. It worked for us in 2008, 2007 and with the LTCM disaster in 1998.
Spreads were expected to reverse to widening in May-June and complete the critical breakouts in July. This time around, the key breakout occurred in early August.
The initial hit took the spread (BBB to Treasuries) to 229 bps on August 26th. That week’s Pivot considered that relief could run for two to four weeks, when widening would resume. The best on relief was 220 bps set on September 24th. Monday’s number was 235 bps and widening has resumed.
We can track the technical dynamics on the ETFs. The “relief” made it to the 200-Day ma on September 17th. At .288 now it compares to .283 on Black Monday. Importantly, the Weekly RSI is at 38. Serious oversolds occurred at the 26 level last January and in October 2011.
The hit in JNK has further to run in price, season and momentum.
The following chart reviews the action in Junk in 2008 when the yield soared from 7.50 percent to over 23 percent. The increase was more than 15 percentage points.
The last cyclical low yield was set at 5.16% in June 2014. Fifteen percentage points puts the target at 20 percent. It is now at 7.98%.
Over in Treasuryland, TLT has rallied with this week’s decline in equities. The low was 118.55 a couple of weeks ago. Monday’s rally amounted to 2 points to 123.77. This is at the 200-Day ma. If it breaks out the next level of resistance is at 125.
While TLT can rally with these setbacks, we think the game has been played too many times.
A classic post-bubble contraction drives real rates (net of CPI inflation) up. In senior currency terms the increase has been in the order of 12 percentage points. It seems that a huge increase in the real cost of interest was needed to end the abuse of credit, otherwise known as a new financial era.
Currencies
For the past two weeks the DX has been trading between the 50-Day (above) and the 200-Day (support). Since early August, stock market declines have occurred with a weakening dollar. The low was 92.52 on Black Monday.
It is at 96.20 and we will let the chart tell us about the next near-term move. On the longer-term, we have been expecting debt service flows into New York to eventually drive the dollar up. That would be relative to most other currencies. In a financial world corrupted by intuitively contrived economic theories, a firming dollar, as the saying goes, would be equivalent to the guy in the leper colony with the most fingers. The Canadian dollar has been expected to be steady following Black Monday.
Other than the sudden jump to 76.82, most of the trade was at the 75.50 level. However, over the last three days it has dropped to 74.54.
The last rally was to 82.47 in June, which was just above the 50-Day ma. The next prominent rally was the one to 76.82, which was about the same amount above the same moving average.
The downtrend has resumed.

When markets get overly optimistic, meaning too many bulls, they have a tendency to struggle, even if it takes a while before they go down appreciably. See how the market did nothing most of last year except to move laterally. Then we had the strong and powerful move lower that took the Sp down 14%. Now we’re dealing with the opposite affect. The bull bears spread now at minus -4.2% which is off last weeks -10% reading but still below 0 which is very good news for the bulls. The Rydex bear fund is also at three year highs which shows you the bears are still quite aggressive which is a negative for them of course. The market has shown a few gap ups here over the past couple of days and may now be headed for a lateral bull flag type of set up. There’s no given amount of time it has to stay in the flag but it’s in a flag for now and that normally resolves itself from the direction it came from which was up. Add in that bull markets usually tend to test the old highs over and over even if the levels fall a bit shy and it’s not out of the question that we’ll continue to trend higher overall. Not easily but trend that way. We saw it today as overbought short term charts allowed for yet another move higher in the indexes before encountering resistance at Sp 2000 or the mid point from the recent high to low. They also encountered overbought again with some short term negative divergences. The fall wasn’t bearish off the top so I’d say again that it appears the indexes are trying to set up bull flags to work their way higher over time. No guarantee of this of course based on the continuing flow of poor economic news but this is what appears to be setting up in just about every index I look at. Times are a bit better now for the bulls. Nothing special but at least a bit better.
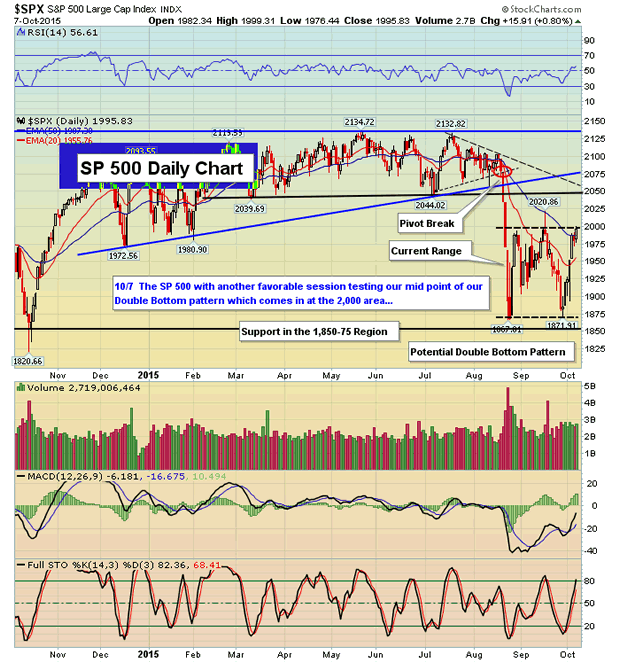
The key level to keep tabs on is the 2,000 area on the SP 500 as we setup in a potential Double Bottom pattern seen below:
For the bull market to continue on further than it already has you’d at least have to start with improving global economies. We are seeing anything but that for the most part, especially here at home over the past few months. Declining manufacturing and services. Declining job creation and the list goes on and on. To make matters worse from a technical perspective, any move to new highs would create massive negative divergences on the monthly index charts across the board. They would be quite sever in nature and that is often how bull markets make their final highs. If the fundamental picture continues to erode and can not help the technical picture I’d say the end is near for the bull market, even if we make a higher high first. I believe that even if the fundamental picture does improve, the bull would still end but the process would take longer to play out. Also, it wouldn’t be as severe in price or time. Those nasty monthly charts in the end I believe call a top if we make new highs, or even if we don’t. Hopefully we can push thing out until some time later next year but a lot of that depends on the fundamentals and all we can do is see how they come in day by day. Maybe we can get more surprises positive like we did with the euro zone earlier this week. On the other hand, the news out of China is so terrible that it’s hard to imagine things turning around bullish any time soon. The early earnings numbers are painting a bad picture for future growth out of China.
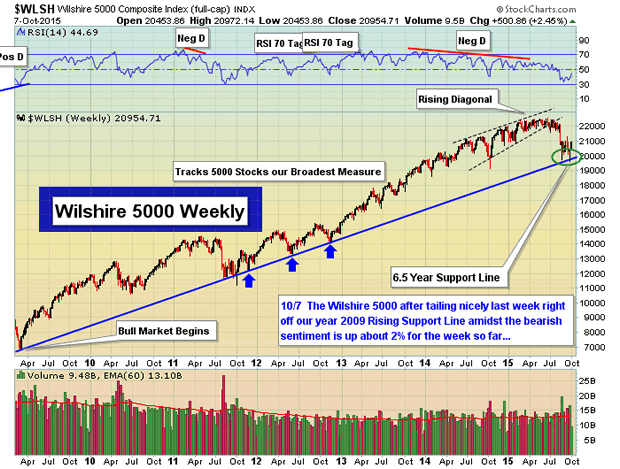
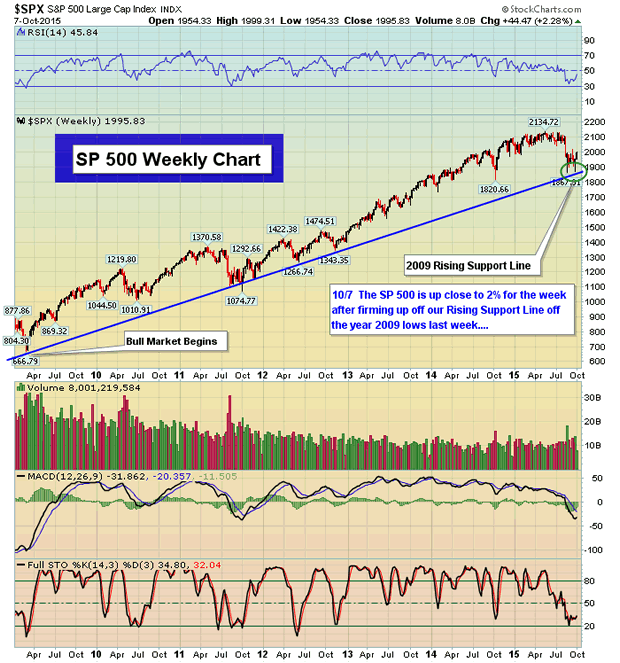
The SP 500 similar to the Wilshire 5000 firmed up off our Rising Support Line off the year 2009 lows this week:
The earnings season is upon us now. This scares me for the bulls since a lot of the economic problems have recently occurred and seems to be accelerating. I don’t believe many ceo’s were prepared three months back during the last earnings season in terms of their future guidance. Most taken by surprise by the recent down turn overseas as well as here at home. Maybe there will be more warnings than normal and I would expect no mercy since many p/e’s are simply too high. Yum for instance. Crushed on bad news last night. Nus And Adbe as well. Many pre earnings warnings are occurring now. It doesn’t look like a good season is upon us and if so, the ceo’s should throw in the towel and guide way down so as to be to beat three months down the road during the next earnings season. You get the feeling the market isn’t done with knocking out some stocks even though they’ve already been crushed. If you’re bad on your numbers you will continue to get smoked so as always, be smart about what you hold in to those reports. I think this will be the toughest quarter in the past many years. All that sais, just know the numbers. 2000 to 2031 is key resistance on the Sp with 1954 both gap support and the 20 day ema. A day at a time with buying weakness the best way to proceed.
Please join us for a free 3 week trial at www.TheInformedTrader.com
 A series of “bio-bombshells” is hitting the drug stocks where it hurts – in the wallet!
On Sunday, it was the New York Times that published a story headlined: “Valeant’s Drug Price Strategy Enriches It, but Infuriates Patients and Lawmakers.”
Yesterday, it was the Wall Street Journal with a story titled “For Prescription Drug Makers, Price Increases Drive Revenue.”
And of course, late last month, the industry got its bogeyman in the form of Martin Shkreli. His company, Turing Pharmaceuticals, bought a drug called Daraprim that treats an infection called toxoplasmosis. Then the company proceeded to hike the price by more than 5,000% before backtracking somewhat.
What the heck is going on?
Well, you have a wide variety of biotechnology and pharmaceutical companies that take different approaches to the business.
 Some of the biggest players funnel billions of dollars in profit from patent-protected drugs into research and development, in order to come up with new and better treatments for life-threatening diseases. Politicians and regulators grudgingly accept the rising cost of their drugs because at least they’re re-investing in their businesses.
But companies like Valeant Pharmaceuticals (VRX) are increasingly coming under fire. They’re buying old drugs or entire companies, hiking prices willy-nilly, and distributing huge chunks of profit to shareholders and management rather than investing in R&D.
The Times story notes that Valeant quadrupled the price of a drug called Cuprimine. That drove up the cost of one man’s treatment to $35,000 a month – a cost largely eaten by Medicare. His own out-of-pocket co-pays surged to $1,800 a month from $366.
The Journal tells a separate story about Biogen (BIIB) and its Avonex treatment for multiple sclerosis. Biogen raised its price 21 times, at an average annual increase of 16%, despite falling prescription volume and the fact it’s an older medication. The story goes on to note that U.S sales growth of 30 top drugs surged 61% on average, even as prescriptions rose one-third as much.
There are so many sides to this story that it’s hard to track them all. Surging drug prices raise widespread ethical, political and social concerns.
But this column is focused on the investment implications of world developments. And the negative publicity is clearly putting downside pressure on biotech stocks in particular and drug stocks in general. Reason: Investors are worried Washington could slap price controls or other punitive measures on pharma companies that have been making billions for their shareholders off the backs of vulnerable, sick Americans.
Valeant has tanked by $100 a share just since August, while Biogen has dropped $200 in only seven months. The benchmark iShares Nasdaq Biotechnology ETF (IBB) has lost more than 15% in only the past three months, and is desperately trying to hold above its August panic low.
 I would keep a very close eye on those August lows if I owned any biotech stocks or ETFs. If that area of technical support can’t hold, it will probably lead to even more follow-on selling as investors throw in the towel. That, in turn, could put more downward pressure on investments like the PowerShares QQQ Trust (QQQ). After all, biotech and other health-care companies make up around 14% of its holdings.
|
● Nelson Peltz and his Trian Fund Management firm are notorious for buying stakes in companies, taking board seats, and agitating for management changes, strategic shifts, and the like. But the activist investor’s latest $2.5 billion bet on General Electric (GE) appears different.
GE is a huge industrial conglomerate and Peltz’s suggestions for what it should do are fairly run-of-the-mill. That’s leading to questions about whether his involvement will actually do anything longer term for shareholders.
● Volkswagen AG is shutting down non-essential investments and planning to cut spending to the bone as it struggles with the potentially huge financial impact of its emissions scandal. The carmaker may need to pay more than $7 billion to fix affected vehicles, plus several billion dollars more in fines in the U.S., Europe, and elsewhere.
● The energy industry has been battered and bruised by the collapse in oil prices. But it appears to be getting closer to a significant legislative win: The repeal of the U.S.’s 40-year-old ban on exporting crude oil. The ban was enacted during the era of Arab oil embargos, but looks increasingly unnecessary thanks to the surge in U.S. oil and gas production.
Should we export oil? Will Volkswagen be able to survive this self-inflicted crisis? Do you think the gains in GE shares will stick? Hit up the website and let me hear about these or other topics of the day.
Until next time,
Mike Larson

-
I know Mike is a very solid investor and respect his opinions very much. So if he says pay attention to this or that - I will.
~ Dale G.
-
I've started managing my own investments so view Michael's site as a one-stop shop from which to get information and perspectives.
~ Dave E.
-
Michael offers easy reading, honest, common sense information that anyone can use in a practical manner.
~ der_al.
-
A sane voice in a scrambled investment world.
~ Ed R.
Inside Edge Pro Contributors

Greg Weldon

Josef Schachter

Tyler Bollhorn

Ryan Irvine

Paul Beattie

Martin Straith

Patrick Ceresna

Mark Leibovit

James Thorne

Victor Adair