
Stocks & Equities
The Fed Has Tried Both Sides
Last Thursday, the Federal Reserve did not raise interest rates. While the “no rate increase” scenario is typically favorable for stocks, the S&P 500 was unable to hold onto the post Fed statement gains. In fact, rather than rising after the Fed statement, the S&P 500 has seen a big drop in recent sessions (see chart below).

Let’s See How The Other Side Looks
In what appears to be a bit of a panic response from the Fed, after Friday’s big selloff in stocks, several Fed officials came forward making the case for increasing interest rates. Did the market cheer the Fed flip? No, the initial reaction was positive, but like last week, the gains were quickly given back (see below).

How Does The Bigger Picture Look?
While markets can begin to improve at any time, the facts we have in hand are not particularly encouraging for stock market bulls. This week’s video shows why stocks may be set up for another big leg down.
Have Things Improved This Week?
After Tuesday’s session, the S&P 500 was down 15 points this week, meaning it is difficult for improvement to occur on weekly charts. If we use the image below to compare the end of the 2011 correction and the 2009 bear market low to the present day, we can see the stock market bulls have some work to do.

If you want to get some insight into the three “looks” above, see Comparing 2015 To Past Market Bottoms
Improvement Can Begin At Anytime
2011 is an excellent example of a vulnerable market that began to improve quickly after a low was made. The charts looked ugly on October 3, 2011, but improved dramatically in the weeks that followed the October 4 intraday reversal. With Janet Yellen speaking Thursday, it is important for us to monitor the charts with a flexible, unbiased, and open mind.

It’s happening again. The amount of margin debt balances at New York Stock Exchange member firms fell to $473,412 billion in August, down 2.9% from September. It is the 2nd consecutive monthly decline and the first back-to-back monthly drop since December-January.
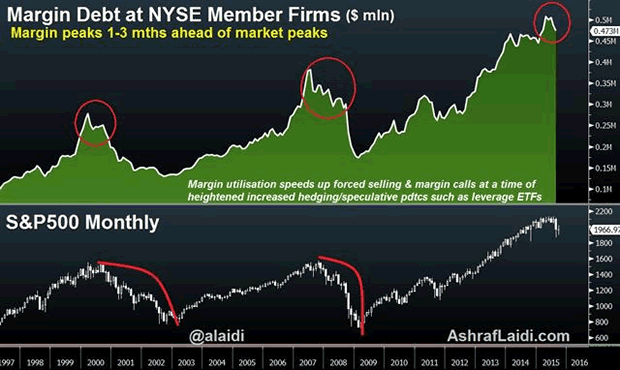
The importance of these figures is highlighted by the historical relationship between peaks in margin debt, and tops in the stock market, typically measured by the S&P500.
Margin calls & forced selling
As markets enter the early stages of a rally, smart money (hedge funds, index funds) usually leads the ascent until it is joined by retail
players to trigger the next buying wave. As the rally sustains itself to higher levels, existing and new payers add on to positons with varying use of leverage (buying on margin). Once markets peak out and/or start to pull back, buyers on margin are obliged to close or pare long positions as margin calls creep in. Clients’ losses at member firms escalate especially as soaring volatility triggers the cascading of stops, prompting further market downside.
The high correlation between margin debt and equities reflects the increasing use of debt in purchasing stocks by institutional and retail investors, shedding important light on the circular loop between price performance and the use of margin debt.
1-3 month lags
July 1998 – The stock market top of July 1998 coincided with the peak in margin debt before the decline was propagated by the EM fallout & LTCM collapse.
March 2000 – The peak in margin debt of March 2000 coincided with the market high in the S&P500 right before the burst of the dotcom bubble, which was intensified by a new generation of margined trading, made easy by online trading.
July 2007 – The peak in margin debt of July 2007 occurred three months prior to the pre-crisis top in the market.
The 1-month lag has reappeared as the latest margin debt figures show leverage has fallen 7% from its April peak — one month prior to the record high in the S&P500 and the Dow.
Margin buying & forced selling
The escalation and subsequent decline in margin debt highlights the risks of speculative stock buying at a time when equities are increasingly vulnerable to contracting earnings growth, slowing global trade, deepening China macro retreat, plunging commodities, falling capex and +$1.5 trillion in cancelled oil projects. The other risk to equities is the back-up of bond yields in an increasingly thin global bond market.
This will not help stock valuations, especially as chest-thumping reminders from Fed hawks fuel the risk of higher yields. And the last thing that’s needed is a bout of forced redemptions from hedge funds and margin calls by retail investors.
How I used margin debt in January 2008 and October 2008 to forecast further damage in equities
Margin debt can best be utilized for continuation patterns during selloffs rather than timing of turning points. On January 2008, margin balance helped me make the case for an additional 25% decline after equities had already fallen by 14% from their peak.
Then in October 2008, as stocks had plunged 25% from their 2007 peak, we remained negative on stocks to the extent of predicting further Fed easing against the prevailing market consensus, which leaned towards US rates reaching a bottom at 2.0%.

Originally published September 19th, 2015.
The market didn’t waste any time “getting on with it” yesterday after the bearish action on the day of the Fed announcement. It fell, and hard. We are going to look at this carefully because what appears to be starting is a devastating “end run around the line” smash – if so a brutal plunge is just around the corner.
A few days back we were a little too accommodating in adjusting the upper boundary of the Pennant shown on the 3-month chart below when the index pushed out of the top of it. We shouldn’t have and on this chart we are going back to our original Pennant boundaries, which is important as it enables us to define where the support is at the apex of the Pennant. As you will recall the upside breakout from the Pennant, on the basis of its original boundaries, was regarded with deep suspicion, and it appears to have been the product of manipulation – Fed buying to “paint the tape”, especially as there was no such breakout in other markets like the London FTSE and Tokyo Nikkei, where a parallel Pennant had formed. If so then they may soon end up with egg on their faces.

Other world market indices such as the Europe STOXX600 shown here, and the London FTSE and the Tokio Nikkei, which have similar bear Flags or Pennants completing, did not confirm the false upside breakout from the Pennant on the US S&P500 index before the Fed announcement…
 Meanwhile, the Transports, which had a surprisingly big recovery rally after the August plunge, are perfectly positioned to drop away hard after failing at downtrend line resistance with a bearish “Shooting Star” and then breaking down from their recovery uptrend…

The market is at a critical juncture because yesterday it dropped to the support at the apex of the Pennant. If this fails – and it is expected to perhaps after a minor bounce – then we will quickly find ourselves in an “end run” smash situation, which is what happens when a Pennant or Triangle breakout fails in this manner. The market should drop away fast, perhaps like a rock, and the downside target for this move is 1730, which it could easily exceed. However, if it doesn’t slice through the support at the August lows in the 1870 area and sticks there we may ditch half of our Puts there for a good profit, and let the rest ride. We’ll see how it looks when it gets there. With respect to nailing the get out point for Puts, the Transports chart shown above is helpful as it gives us a potential downside target at the lower boundary of its expanding downtrend channel.
Originally published on September 17, 2015, 6:54 AM:
Briefly: In our opinion, no speculative positions are justified
Our intraday outlook is neutral, and our short-term outlook is neutral:
Intraday outlook (next 24 hours): neutral
Short-term outlook (next 1-2 weeks): neutral
Medium-term outlook (next 1-3 months): bearish
Long-term outlook (next year): bullish
The main U.S. stock market indexes gained between 0.5% and 0.9% on Wednesday, as investors awaited today’s FOMC Rate Decision announcement. The S&P 500 index retraced some of its late August sell-off, however, it remains below the level of 2,000. The nearest important level of resistance is at 1,980–2,000. On the other hand, support level is at 1,950, and the next support level is at 1,900-1,920. There have been no confirmed positive signals so far. It still looks like an upward correction within a downtrend:

Expectations before the opening of today’s trading session are slightly negative, with index futures currently down 0.1-0.2%. The European stock market indexes have been mixed so far. Investors will now wait for some economic data announcements: Initial Claims, Housing Starts, Building Permits at 8:30 a.m., Philadelphia Fed number at 10:00 a.m., FOMC Rate Decision release at 2:00 p.m. The S&P 500 futures contract (CFD) trades within an intraday consolidation following recent move up. The nearest important level of resistance is at 1,990-2,000, and support level is at 1,970-1,980, as the 15-minute chart shows:

The technology Nasdaq 100 futures contract (CFD) trades within a similar intraday consolidation. The nearest important resistance level is at 4,380-4,400, and support level is at 4,350, among others, as we can see on the 15-minute chart:

Concluding, the broad stock market remains within a short-term uptrend following late August sell-off. However, there have been no confirmed positive signals so far. It looks like an upward correction within a medium-term downtrend. We prefer to be out of the market, avoiding low risk/reward ratio trades. We will let you know when we think it is safe to get back in the market.
Thank you.
 The Wall Street Journal on Friday noted that the market for technology initial public offerings has struggled this year, as it did last year. Is that meaningful?
In April, analyst Jason Goepfert started looking at the percentage of IPOs that were losing money, which has exceeded all-time highs. That kind of risk tolerance was troubling, Goepfert noted, so it has only been a matter of time before investors would have enough of profitless new companies.
IPO volume overall has thinned out, with August being one of the slowest months in three years according to Bloomberg data. And of those, tech offerings are the scarcest of all. Only 5% of new offerings have been in the technology sector.
That’s the lowest in 10 years, according to Goepfert’s data. This only includes pricings through August every year, so the analyst is not comparing partial data this year to full-year data in prior years. Not only is this year the slowest tech year in a decade, it is the third-lowest in 35 years. Only 2003 and 2005 were slower while the peak came in 2000, says Goepfert.
The big question is whether the current low number of tech offerings is a good sign or a bad one. Based on historical market behavior following other extremes in IPO data, Goepfert argues it has served better as a contrary indicator than as a bad omen.
The reason: A high appetite for IPOs — whether profitable or not — has usually suggested too much risk tolerance and lower future returns while a low one has suggested extreme risk aversion and better future returns, the analyst observes. Consider this a modest positive, from a contrarian point of view, for stocks going forward.
* * *
Will They or Won’t They?
Deutsche Bank economist Joseph LaVorgna told clients he sees seven reasons why the Federal Reserve won’t spook markets by raising rates on Thursday.
— Global stock markets are fragile.
— The dollar has been strong, weighing on GDP growth via trade.
— Financial markets continue to assign a low probability of a September rate hike based on futures trading (odds stand at 30% vs. 54% last month).
— Several key Fed officials seem to be subtly backing away from a September move with words like “less compelling” and “complicating factors” and “significant…headwinds.”
— There are meetings in October and December the Fed can hike at.
— The Fed doesn’t fear a loss of credibility if it waits.
— Inflation continues to be soft, with the Fed’s preferred measure up just 1.2% over the past 12 months.
With this in mind, the recent range-bound choppiness in stocks should continue until next week — when a dovish Fed could unleash a powerful rebound. Commodities, especially crude oil and gold, could be the big beneficiaries of a “no hike” decision, though the enthusiasm could be short-lived as it runs smack into the reality of lowered growth expectations for companies in the fourth quarter and next year.
While they put the odds of a September hike at 50-50, citing the cumulative improvement in the economy over the last few years that makes maintaining emergency 0% interest rate hard to justify, the team at Capital Economics believes that higher core inflation driven by rising wages will force Yellen to hike rates much more aggressively next year … something that markets have definitely not priced in yet.
* *
Fed Days in September
And now one last note from an analyst who keeps track of major repeating news and weather events, and the market’s reaction to them over time.
He reports that there have been 11 instances since 1976 when the Federal Reserve has met in September at a time when the Nasdaq is up in the past week.
The market has fallen over the next one, two and nine days in eight of those instances, he says, logging average losses of 0.7% the next day, 1.4% over the next two days, and -1.54% over the next nine days.
History is not destiny, but it’s good to know how investors have reacted in the past to similar stimuli. Combine that with the traditional view that the market often peaks for the autumn in the third week of September and it’s fair to consider exercising caution. On the other hand, if the market breezes through this period without a scratch, essentially whistling past the graveyard, you can consider it a big positive for the rest of the year.
Best wishes,
Jon Markman

-
I know Mike is a very solid investor and respect his opinions very much. So if he says pay attention to this or that - I will.
~ Dale G.
-
I've started managing my own investments so view Michael's site as a one-stop shop from which to get information and perspectives.
~ Dave E.
-
Michael offers easy reading, honest, common sense information that anyone can use in a practical manner.
~ der_al.
-
A sane voice in a scrambled investment world.
~ Ed R.
Inside Edge Pro Contributors

Greg Weldon

Josef Schachter

Tyler Bollhorn

Ryan Irvine

Paul Beattie

Martin Straith

Patrick Ceresna

Mark Leibovit

James Thorne

Victor Adair